| Param | Original file | Final file |
|---|---|---|
| Filename | modeM0/AS1C07_003T01_9000004754_32974cztM0_level2.evt | modeM0/AS1C07_003T01_9000004754_32974cztM0_level2_quad_clean.evt |
| Size (bytes) | 434,554,560 | 77,878,080 |
| Size | 414.4 MB | 74.3 MB |
| Events in quadrant A | 2,487,964 | 519,038 |
| Events in quadrant B | 2,852,934 | 532,842 |
| Events in quadrant C | 2,780,863 | 494,738 |
| Events in quadrant D | 4,694,572 | 456,053 |
| Mode SS | |||
|---|---|---|---|
| Quadrant | BADHDUFLAG | Total packets | Discarded packets |
| A | 0 | 104 | 0 |
| B | 0 | 104 | 0 |
| C | 0 | 104 | 0 |
| D | 0 | 104 | 0 |
| Mode M9 | |||
|---|---|---|---|
| Quadrant | BADHDUFLAG | Total packets | Discarded packets |
| A | 0 | 28 | 0 |
| B | 0 | 28 | 0 |
| C | 0 | 28 | 0 |
| D | 0 | 29 | 0 |
| Mode M0 | |||
|---|---|---|---|
| Quadrant | BADHDUFLAG | Total packets | Discarded packets |
| A | 0 | 10340 | 3 |
| B | 0 | 11393 | 2 |
| C | 0 | 11282 | 2 |
| D | 0 | 17565 | 2 |
| Quadrant | Total seconds | Saturated seconds | Saturation percentage |
|---|---|---|---|
| A | 5070 | 5 | 0.098619% |
| B | 5070 | 96 | 1.893491% |
| C | 5070 | 90 | 1.775148% |
| D | 5070 | 298 | 5.877712% |
Noise dominated data is calculated using 1-second bins in cleaned event files. If a bin has >2000 counts, and if more than 50% of those come from <1% of pixels, then it is considered to be noise-dominated and hence unusable.
| Quadrant | # 1 sec bins | Bins with >0 counts | Bins with >2000 counts | High rate bins dominated by noise | Noise dominated (total time) | Noise dominated (detector-on time) | Marked lightcurve |
|---|---|---|---|---|---|---|---|
| A | 7162 | 5071 | 0 | 0 | 0.00% | 0.00% | 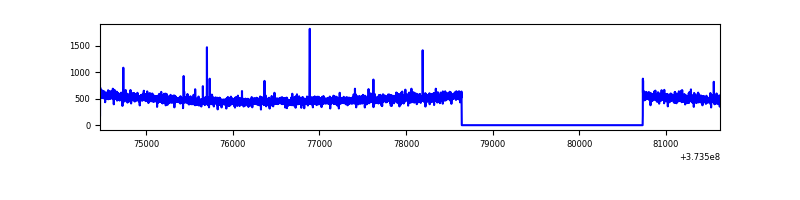 |
| B | 7162 | 5071 | 63 | 63 | 0.88% | 1.24% | 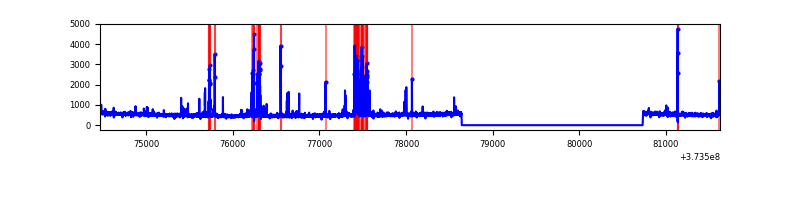 |
| C | 7162 | 5071 | 64 | 64 | 0.89% | 1.26% | 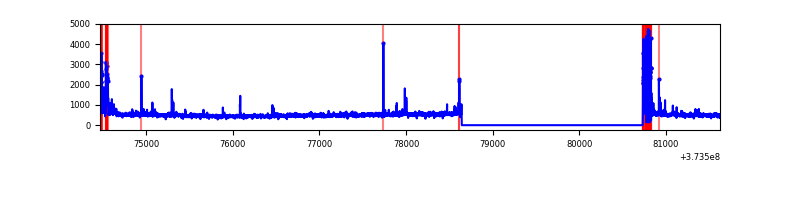 |
| D | 7162 | 5071 | 291 | 291 | 4.06% | 5.74% | 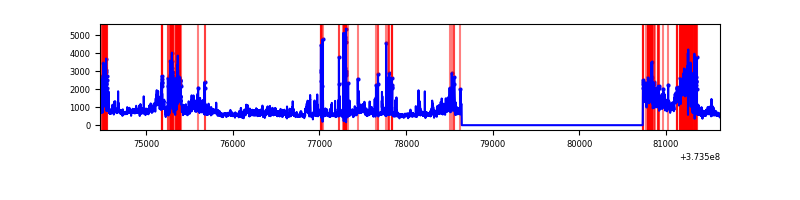 |
Top three noisy pixels from each quadrant. If the there are fewer than three noisy pixels in the level2.evt file, extra rows are filled as -1
| Pixel properties | Quadrant properties | ||||||
|---|---|---|---|---|---|---|---|
| Quadrant | DetID | PixID | Counts | Sigma | Mean | Median | Sigma |
| A | 13 | 254 | 9172 | 67.06 | 638 | 630 | 127.4 |
| A | 9 | 143 | 6668 | 47.4 | 638 | 630 | 127.4 |
| A | 3 | 137 | 5683 | 39.67 | 638 | 630 | 127.4 |
| B | 5 | 172 | 263943 | 2192.77 | 640 | 627 | 120.1 |
| B | 5 | 200 | 58502 | 481.95 | 640 | 627 | 120.1 |
| B | 12 | 111 | 13663 | 108.55 | 640 | 627 | 120.1 |
| C | 0 | 10 | 234191 | 1657.14 | 611 | 618 | 140.9 |
| C | 14 | 67 | 41206 | 287.96 | 611 | 618 | 140.9 |
| C | 9 | 54 | 32197 | 224.04 | 611 | 618 | 140.9 |
| D | 8 | 195 | 982371 | 6404.34 | 591 | 580 | 153.3 |
| D | 7 | 80 | 564238 | 3676.81 | 591 | 580 | 153.3 |
| D | 12 | 227 | 287284 | 1870.2 | 591 | 580 | 153.3 |
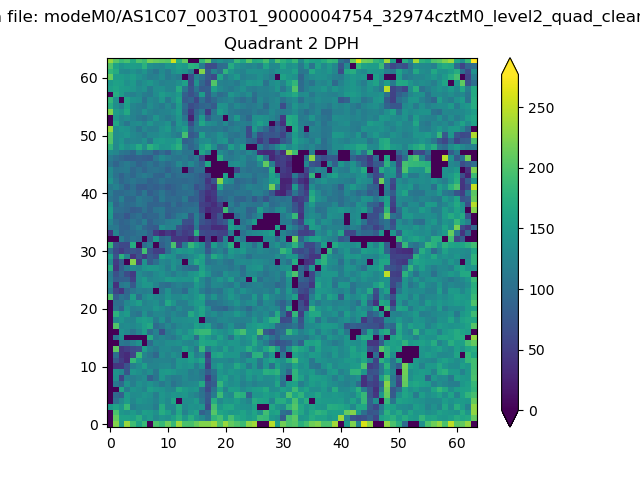
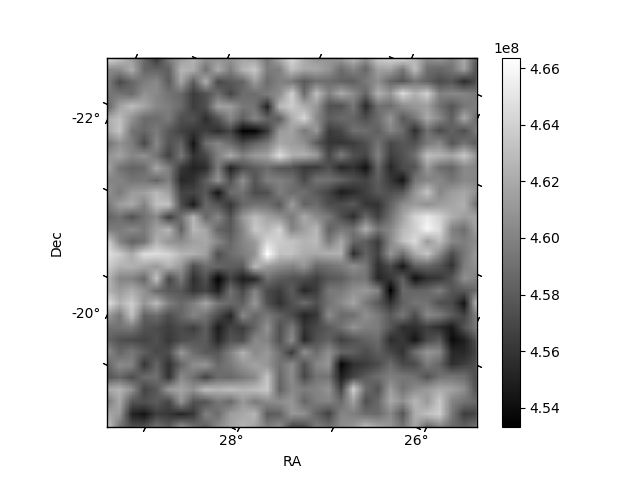
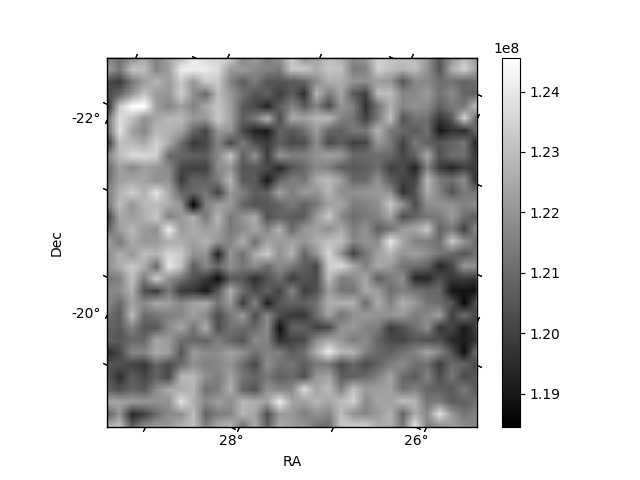
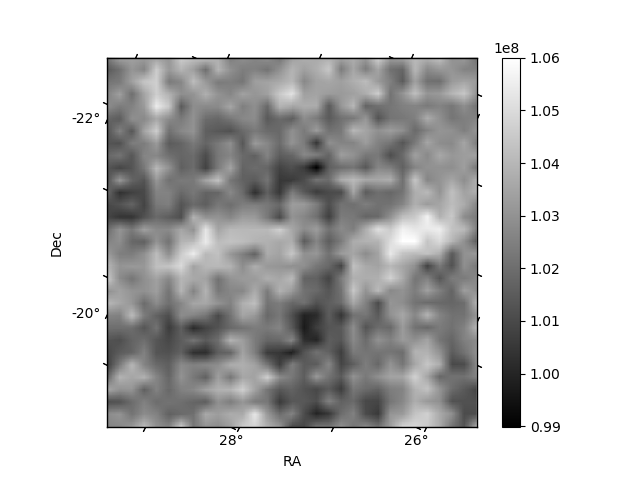
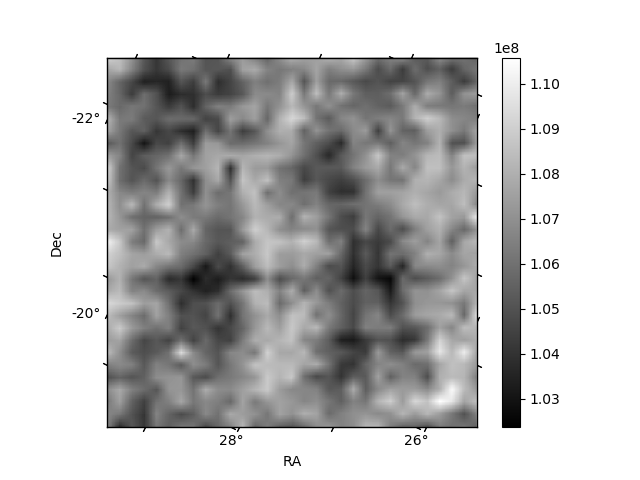
Histogram calculated using DETX and DETY for each event in the final _common_clean file
| Quadrant A | 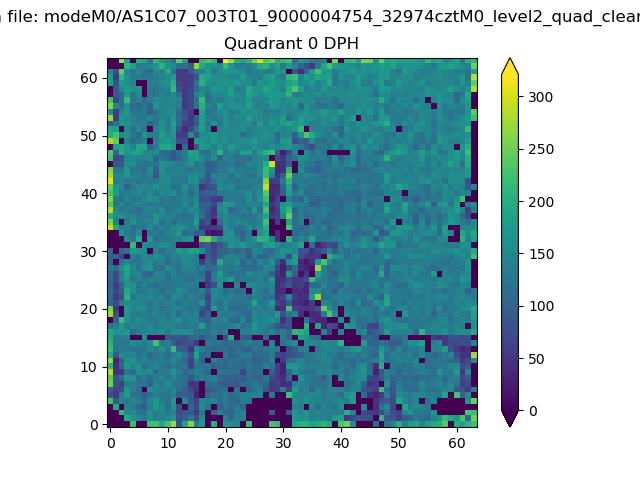 |
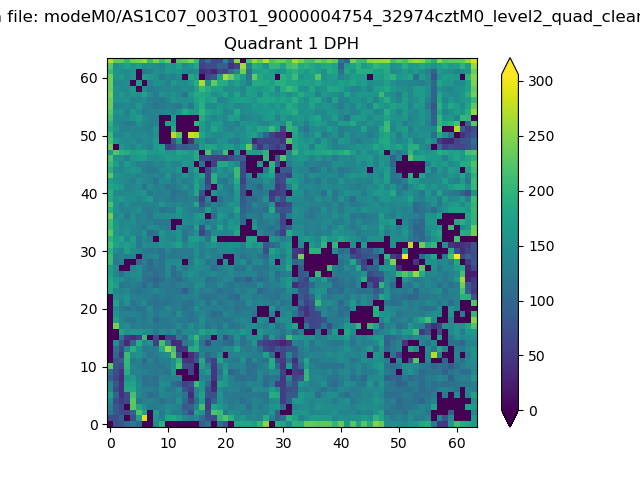 |
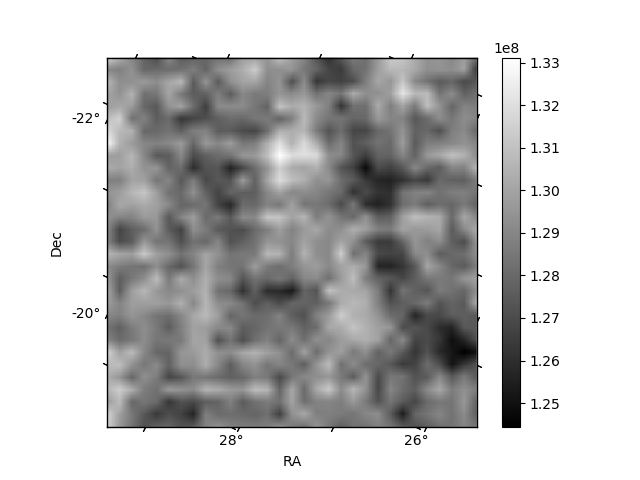
Quadrant B |
|---|---|---|---|
| Quadrant D | 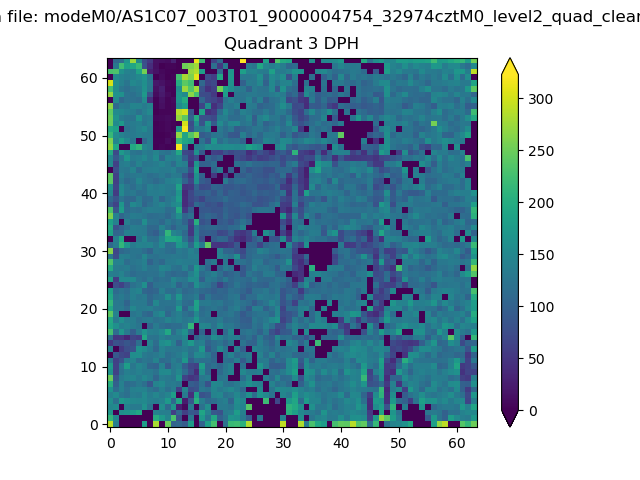 |
 |
Quadrant C |
| Plot type | Count rate plots | Images |
|---|---|---|
| Comparison with Poisson distribution Blue bars denote a histogram of data divided into 1 sec bins. Red curve is a Poisson curve with rate = median count rate of data. |
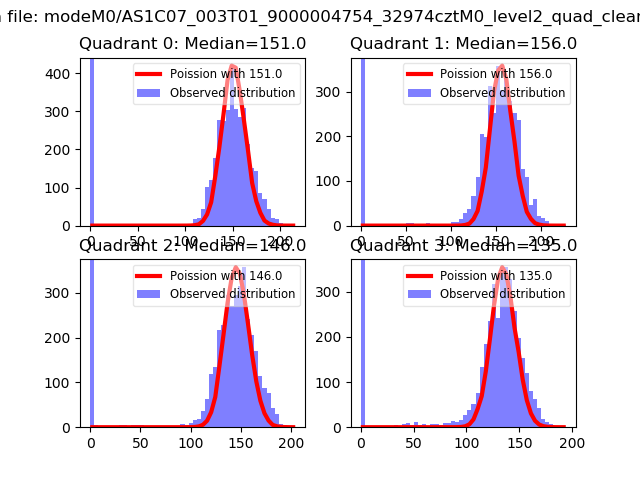 |
 |
| Quadrant-wise count rates Data is divided into 100 sec bins |
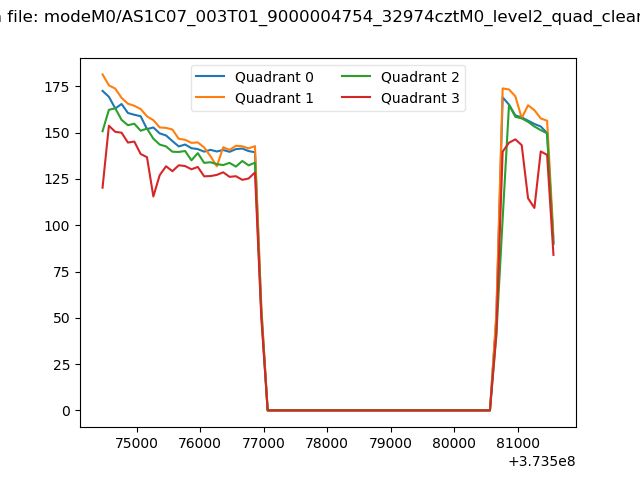 |
|
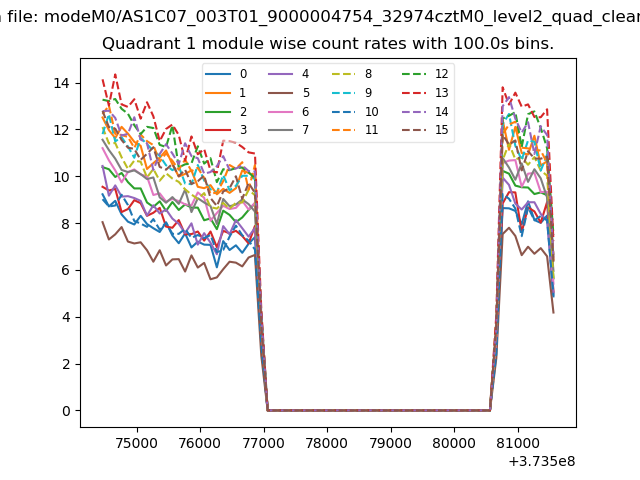
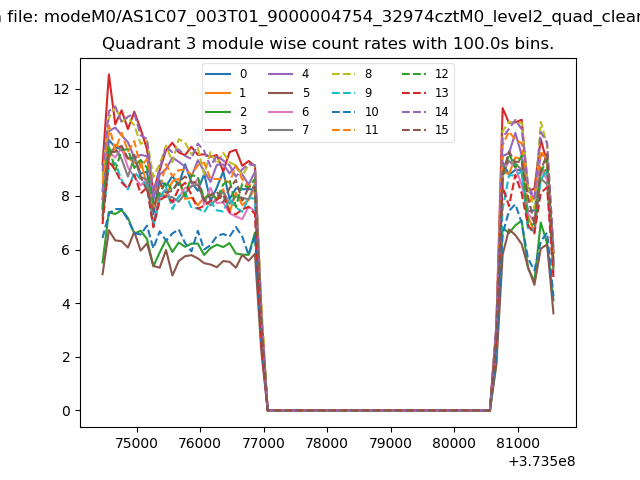
| Module-wise count rates for Quadrant A Data is divided into 100 sec bins |
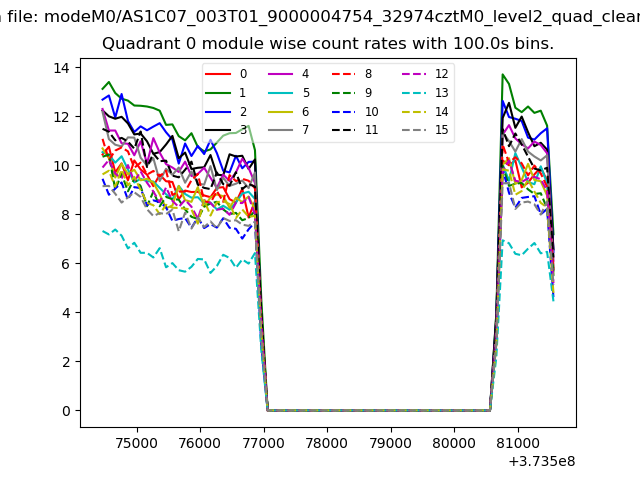 |
 |
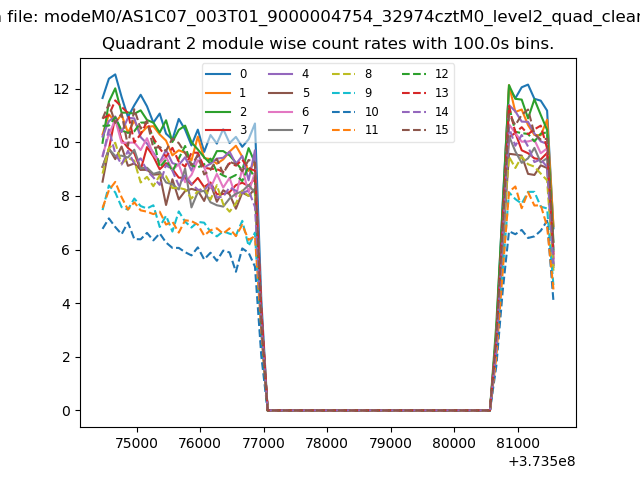
| Module-wise count rates for Quadrant B Data is divided into 100 sec bins |
 |
 |
| Module-wise count rates for Quadrant C Data is divided into 100 sec bins |
 |
 |
| Module-wise count rates for Quadrant D Data is divided into 100 sec bins |
 |
 |
| Parameter | Plot |
|---|---|
| CZT HV Monitor | 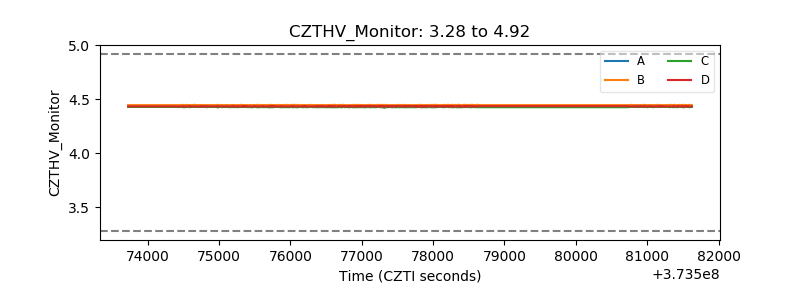 |
| D_VDD | 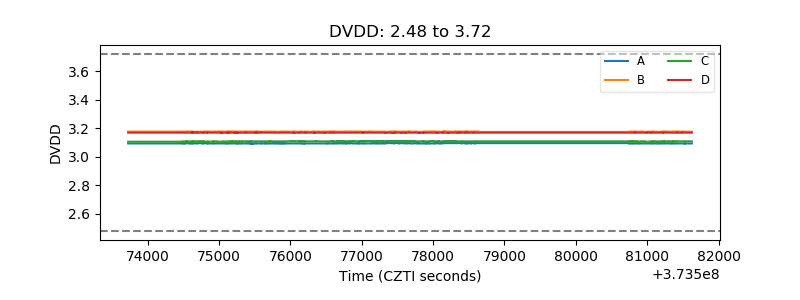 |
| Temperature 1 | 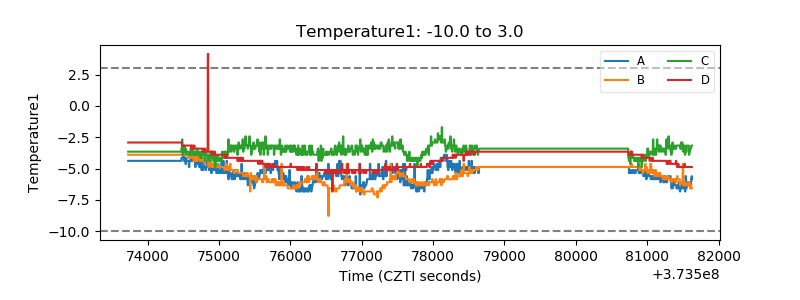 |
| Veto HV Monitor | 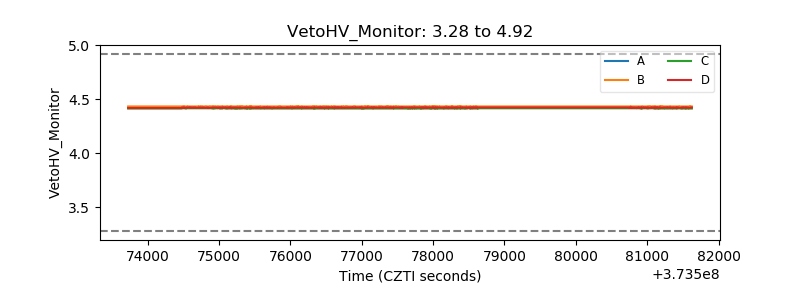 |
| Veto LLD | 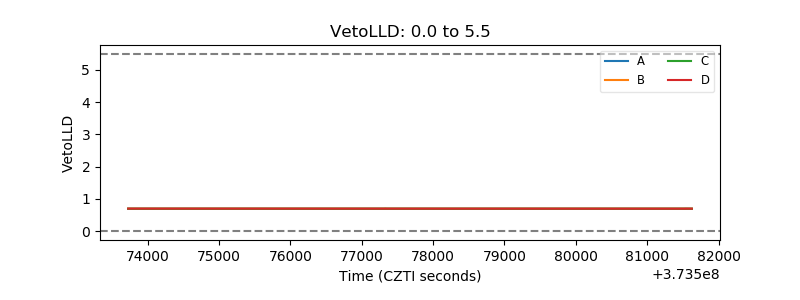 |
| Alpha Counter | 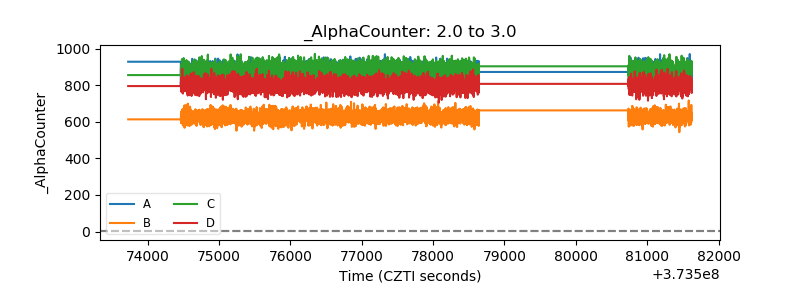 |
| _CPM_Rate | 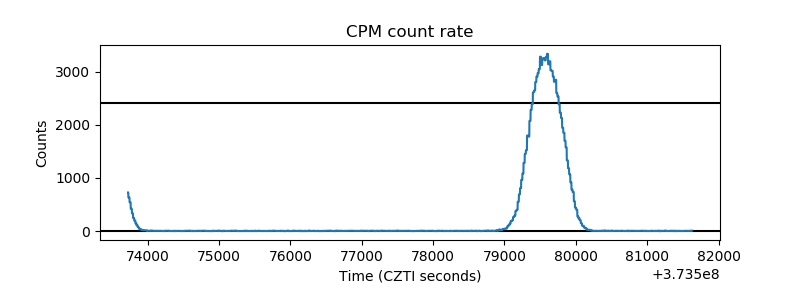 |
| CZT Counter | 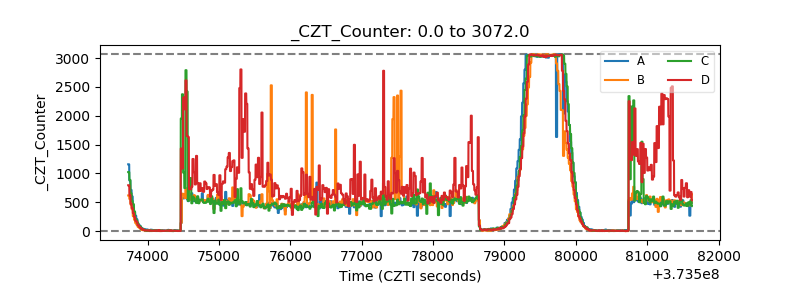 |
| +2.5 Volts monitor | 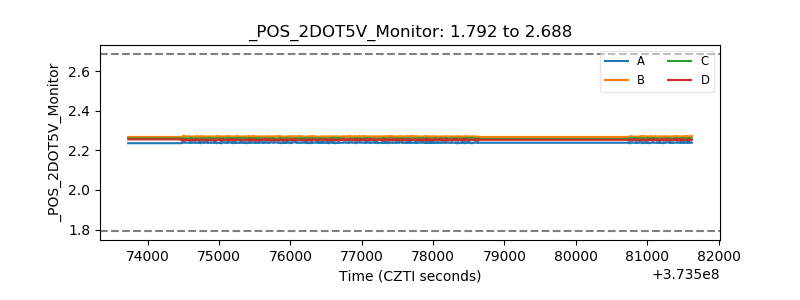 |
| +5 Volts monitor |  |
| _ROLL_ROT | 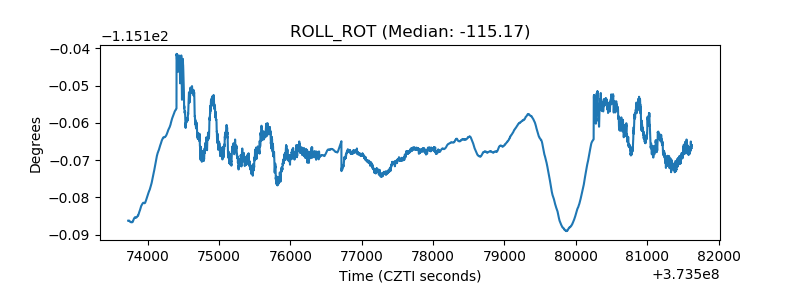 |
| _Roll_DEC | 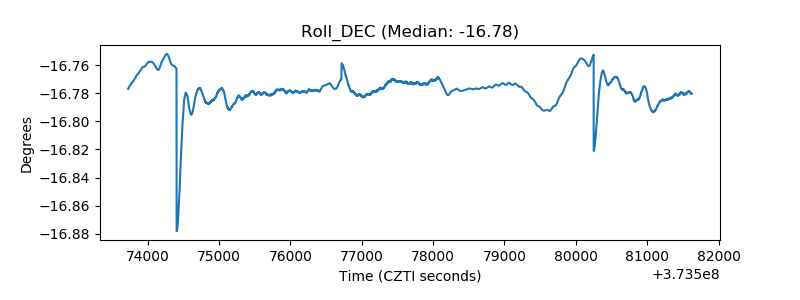 |
| _Roll_RA | 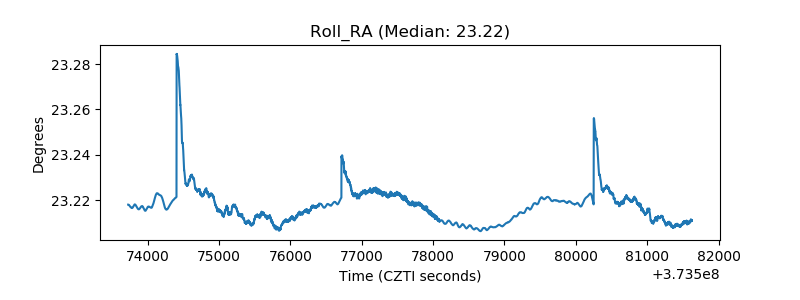 |
| Veto Counter | 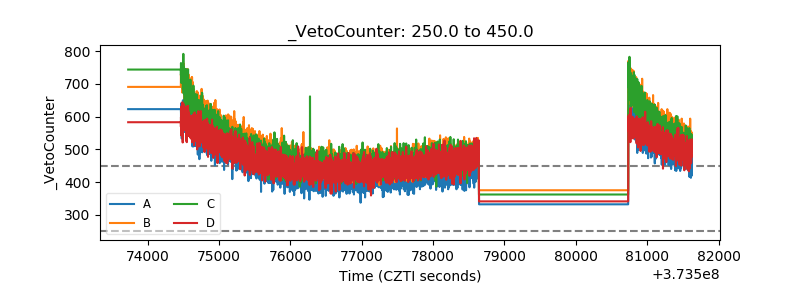 |