| Param | Original file | Final file |
|---|---|---|
| Filename | modeM0/AS1C07_003T01_9000004754_32975cztM0_level2.evt | modeM0/AS1C07_003T01_9000004754_32975cztM0_level2_quad_clean.evt |
| Size (bytes) | 447,888,960 | 67,726,080 |
| Size | 427.1 MB | 64.6 MB |
| Events in quadrant A | 2,392,487 | 440,639 |
| Events in quadrant B | 3,056,845 | 449,312 |
| Events in quadrant C | 2,699,453 | 421,419 |
| Events in quadrant D | 5,078,438 | 390,864 |
| Mode SS | |||
|---|---|---|---|
| Quadrant | BADHDUFLAG | Total packets | Discarded packets |
| A | 0 | 102 | 0 |
| B | 0 | 102 | 0 |
| C | 0 | 102 | 0 |
| D | 0 | 102 | 0 |
| Mode M9 | |||
|---|---|---|---|
| Quadrant | BADHDUFLAG | Total packets | Discarded packets |
| A | 0 | 32 | 0 |
| B | 0 | 32 | 0 |
| C | 0 | 32 | 0 |
| D | 0 | 33 | 0 |
| Mode M0 | |||
|---|---|---|---|
| Quadrant | BADHDUFLAG | Total packets | Discarded packets |
| A | 0 | 10069 | 3 |
| B | 0 | 12044 | 2 |
| C | 0 | 10984 | 2 |
| D | 0 | 18606 | 2 |
| Quadrant | Total seconds | Saturated seconds | Saturation percentage |
|---|---|---|---|
| A | 4966 | 9 | 0.181232% |
| B | 4966 | 167 | 3.362867% |
| C | 4966 | 93 | 1.872735% |
| D | 4966 | 409 | 8.236005% |
Noise dominated data is calculated using 1-second bins in cleaned event files. If a bin has >2000 counts, and if more than 50% of those come from <1% of pixels, then it is considered to be noise-dominated and hence unusable.
| Quadrant | # 1 sec bins | Bins with >0 counts | Bins with >2000 counts | High rate bins dominated by noise | Noise dominated (total time) | Noise dominated (detector-on time) | Marked lightcurve |
|---|---|---|---|---|---|---|---|
| A | 7118 | 4967 | 0 | 0 | 0.00% | 0.00% | 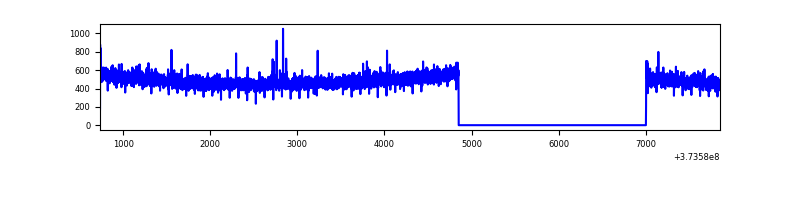 |
| B | 7118 | 4967 | 107 | 107 | 1.50% | 2.15% | 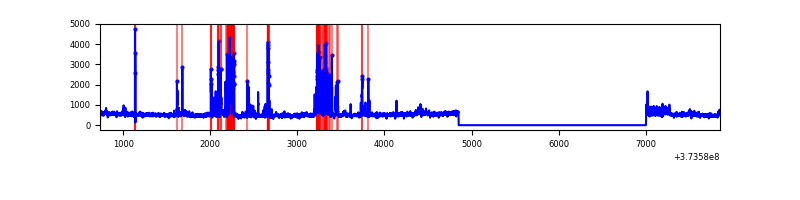 |
| C | 7118 | 4967 | 71 | 71 | 1.00% | 1.43% | 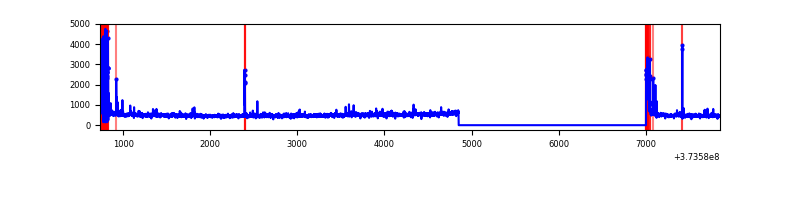 |
| D | 7118 | 4967 | 432 | 432 | 6.07% | 8.70% | 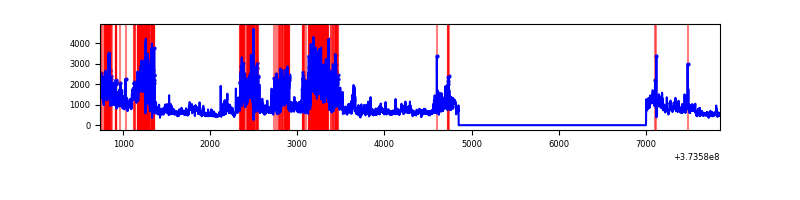 |
Top three noisy pixels from each quadrant. If the there are fewer than three noisy pixels in the level2.evt file, extra rows are filled as -1
| Pixel properties | Quadrant properties | ||||||
|---|---|---|---|---|---|---|---|
| Quadrant | DetID | PixID | Counts | Sigma | Mean | Median | Sigma |
| A | 13 | 254 | 8879 | 67.28 | 615 | 606 | 123.0 |
| A | 9 | 143 | 7320 | 54.6 | 615 | 606 | 123.0 |
| A | 3 | 137 | 5412 | 39.09 | 615 | 606 | 123.0 |
| B | 5 | 172 | 482565 | 4115.05 | 616 | 602 | 117.1 |
| B | 0 | 197 | 84205 | 713.81 | 616 | 602 | 117.1 |
| B | 5 | 200 | 53082 | 448.08 | 616 | 602 | 117.1 |
| C | 0 | 10 | 252044 | 1832.25 | 596 | 603 | 137.2 |
| C | 14 | 67 | 35128 | 251.58 | 596 | 603 | 137.2 |
| C | 9 | 54 | 24048 | 170.84 | 596 | 603 | 137.2 |
| D | 7 | 80 | 1099860 | 7296.64 | 574 | 563 | 150.7 |
| D | 8 | 195 | 942096 | 6249.47 | 574 | 563 | 150.7 |
| D | 12 | 227 | 316948 | 2100.02 | 574 | 563 | 150.7 |
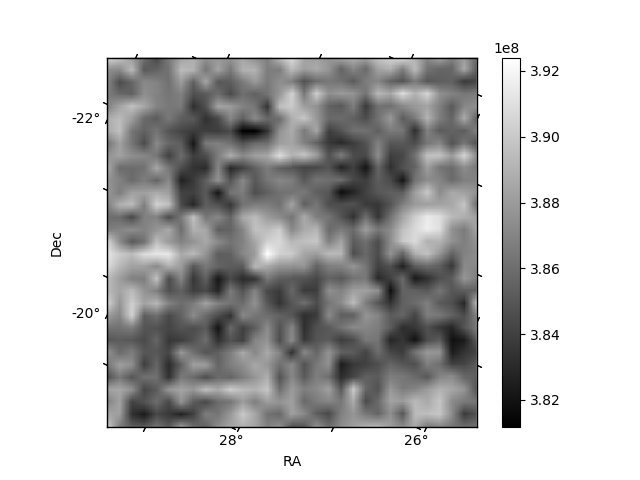
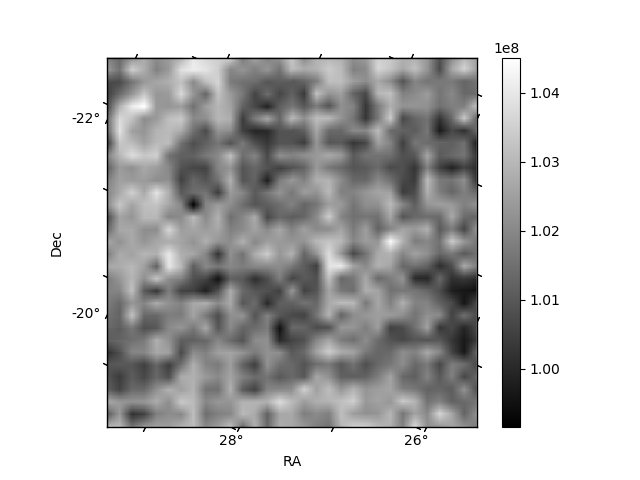
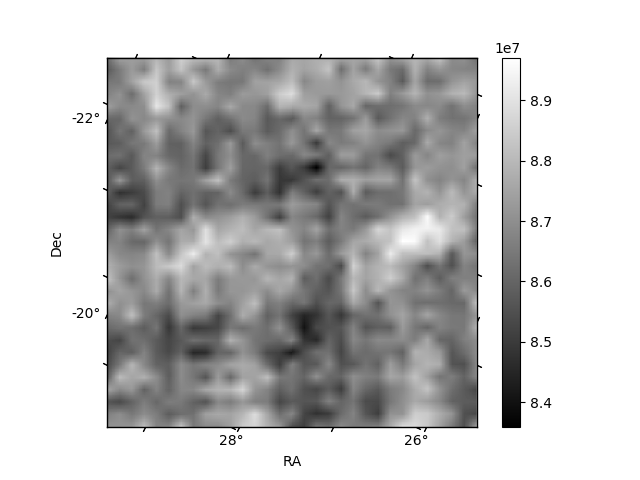
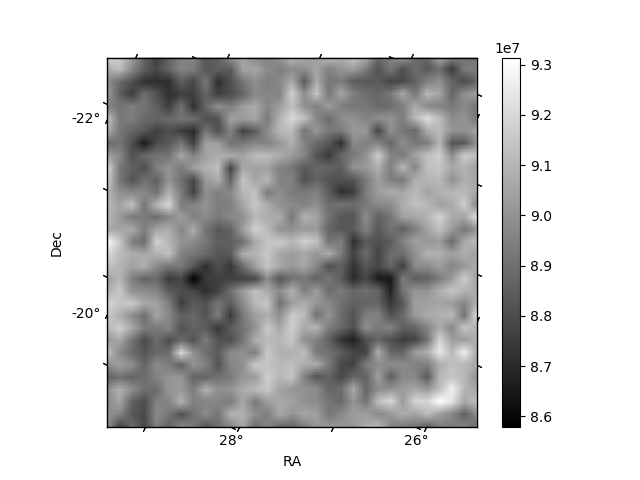
Histogram calculated using DETX and DETY for each event in the final _common_clean file
| Quadrant A | 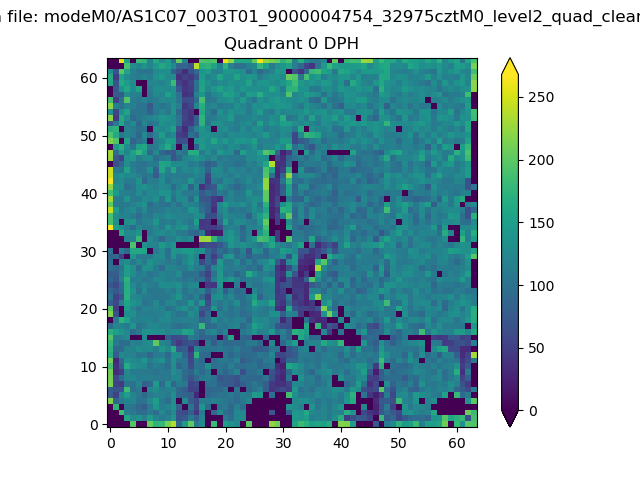 |
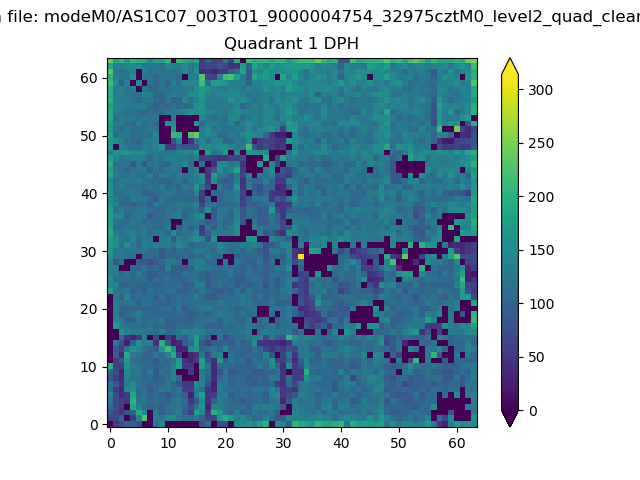 |
Quadrant B |
|---|---|---|---|
| Quadrant D | 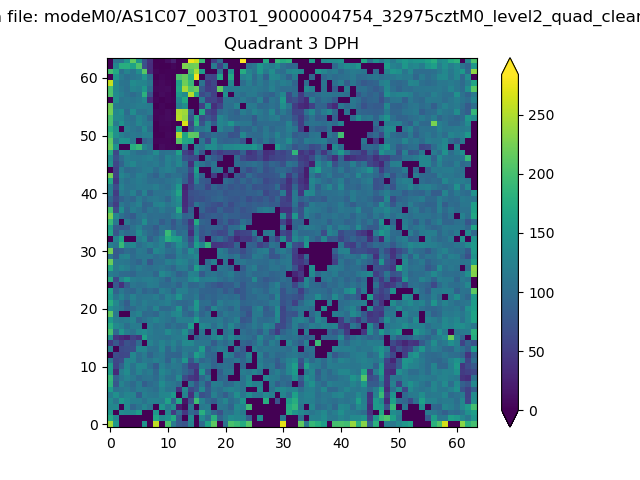 |
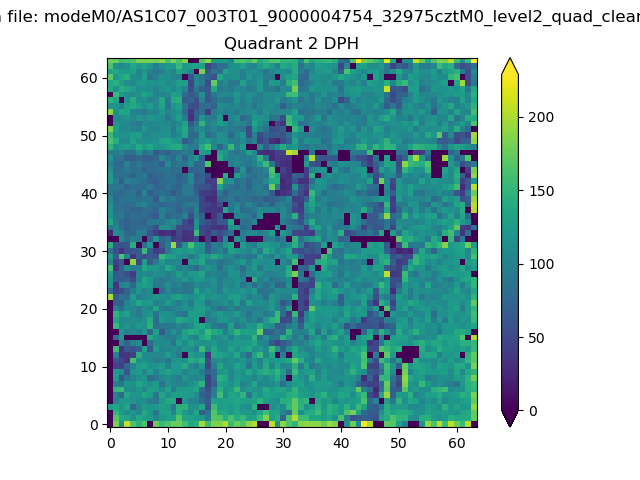 |
Quadrant C |
| Plot type | Count rate plots | Images |
|---|---|---|
| Comparison with Poisson distribution Blue bars denote a histogram of data divided into 1 sec bins. Red curve is a Poisson curve with rate = median count rate of data. |
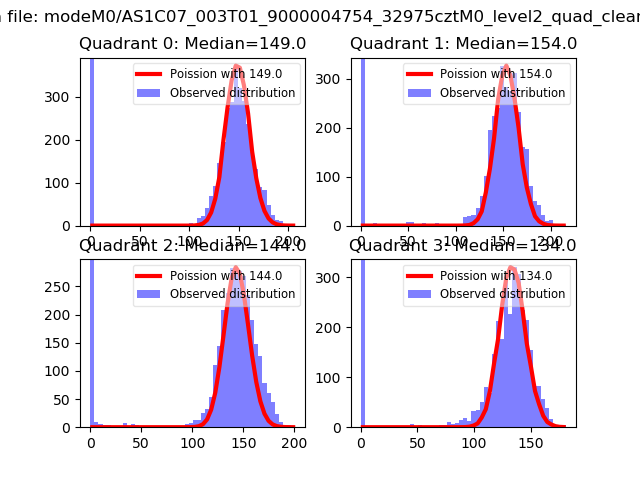 |
 |
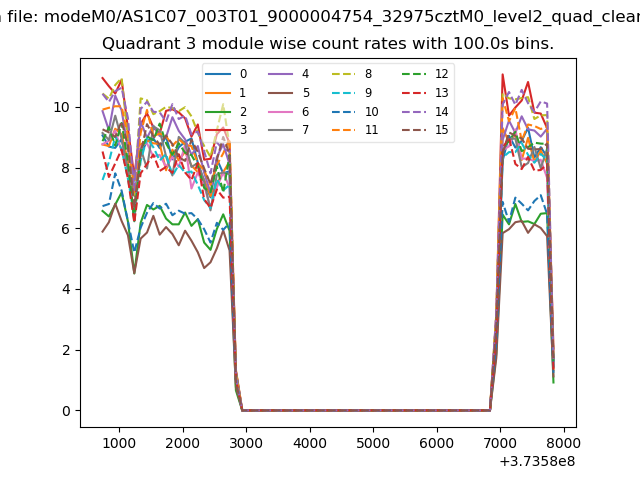
| Quadrant-wise count rates Data is divided into 100 sec bins |
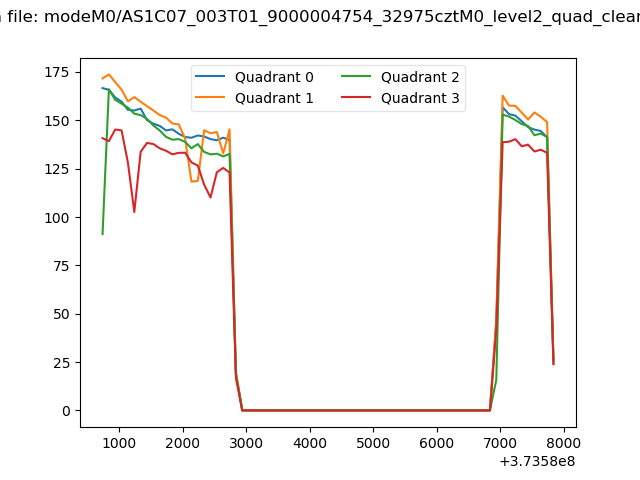 |
|
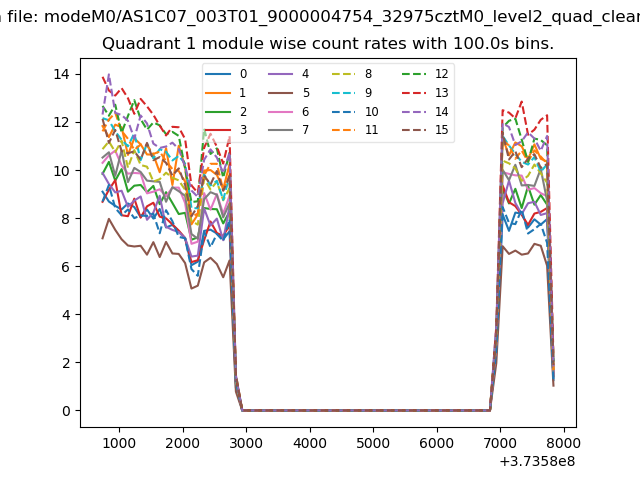
| Module-wise count rates for Quadrant A Data is divided into 100 sec bins |
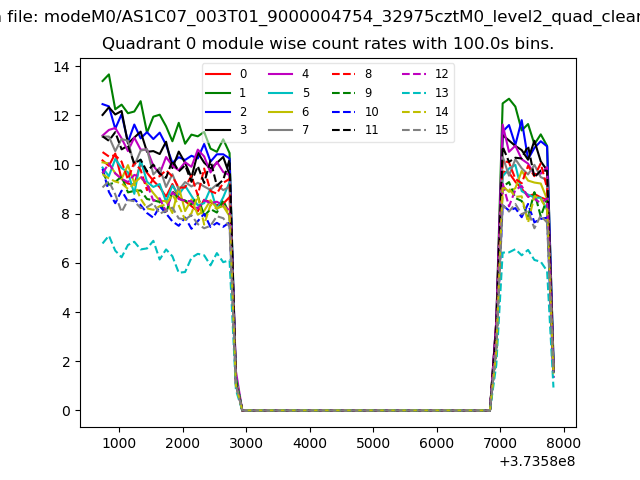 |
 |
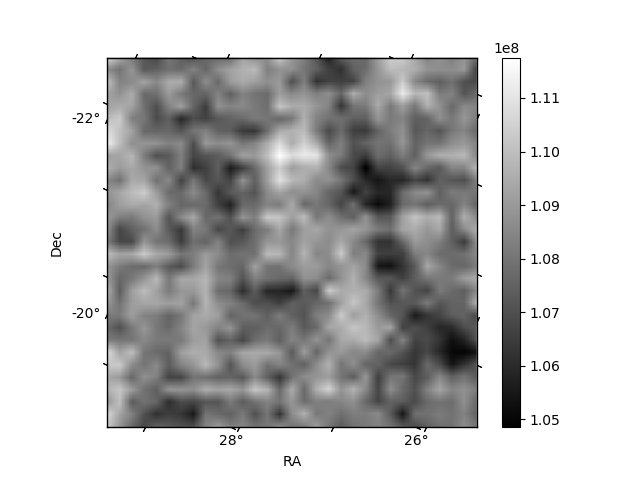
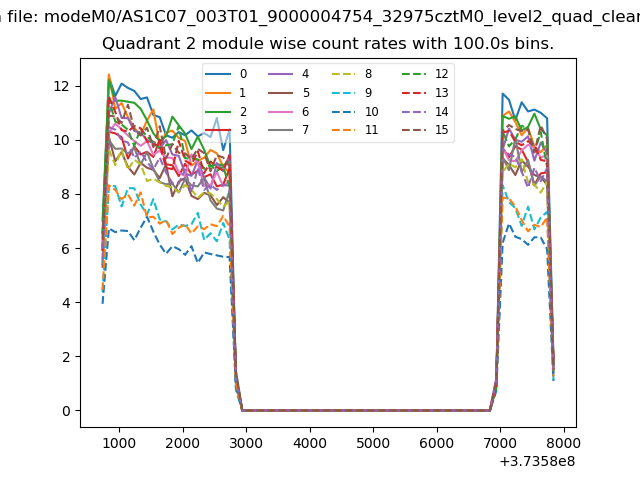
| Module-wise count rates for Quadrant B Data is divided into 100 sec bins |
 |
 |
| Module-wise count rates for Quadrant C Data is divided into 100 sec bins |
 |
 |
| Module-wise count rates for Quadrant D Data is divided into 100 sec bins |
 |
 |
| Parameter | Plot |
|---|---|
| CZT HV Monitor | 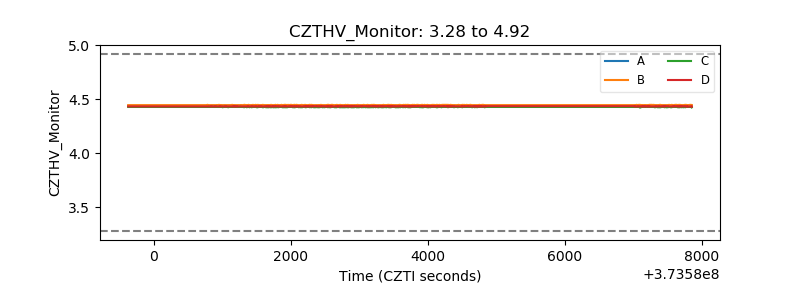 |
| D_VDD | 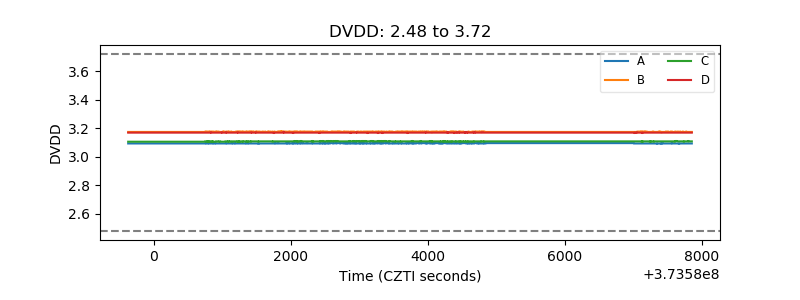 |
| Temperature 1 | 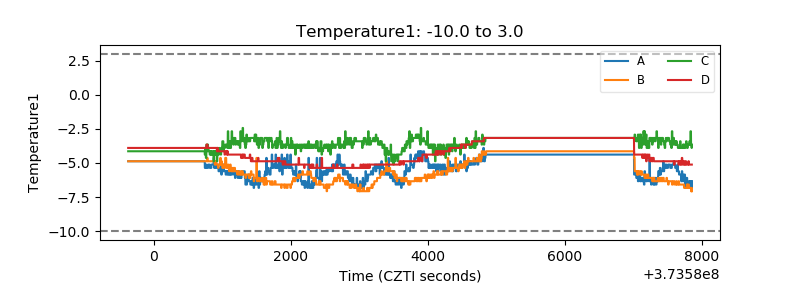 |
| Veto HV Monitor | 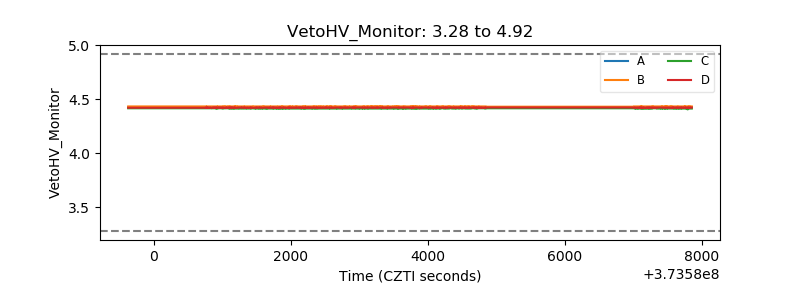 |
| Veto LLD | 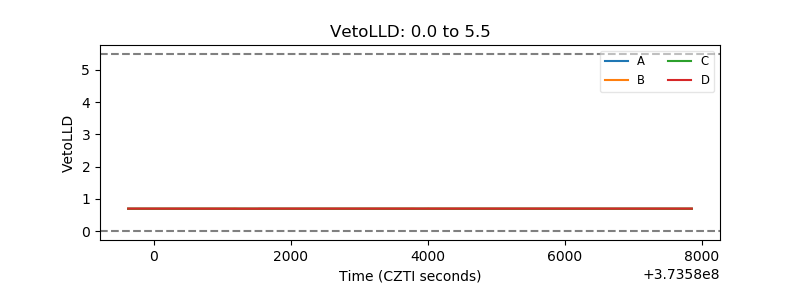 |
| Alpha Counter | 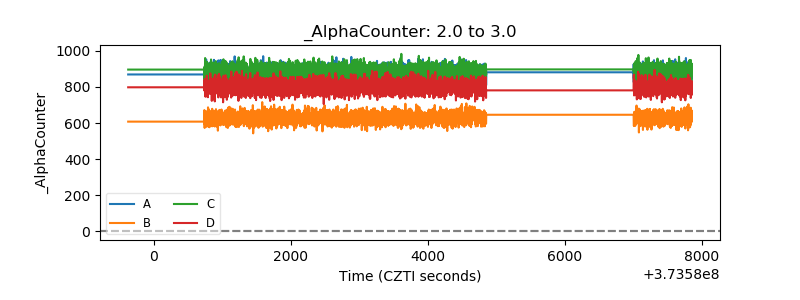 |
| _CPM_Rate | 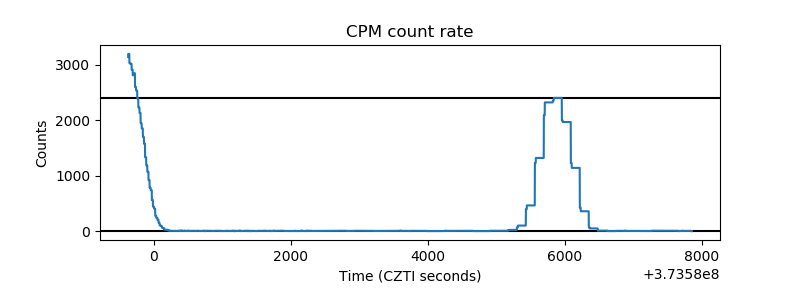 |
| CZT Counter | 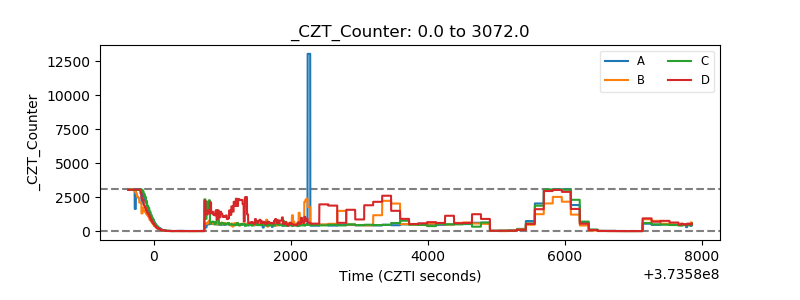 |
| +2.5 Volts monitor |  |
| +5 Volts monitor |  |
| _ROLL_ROT | 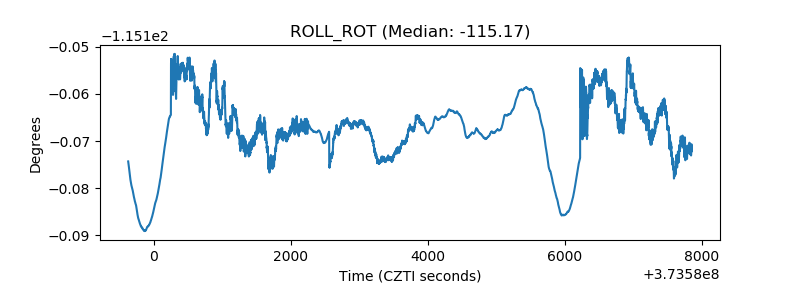 |
| _Roll_DEC | 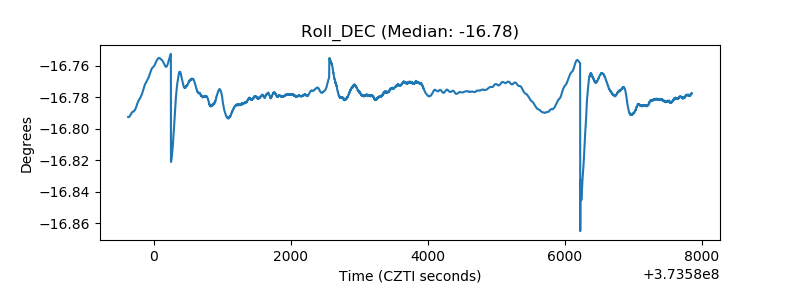 |
| _Roll_RA | 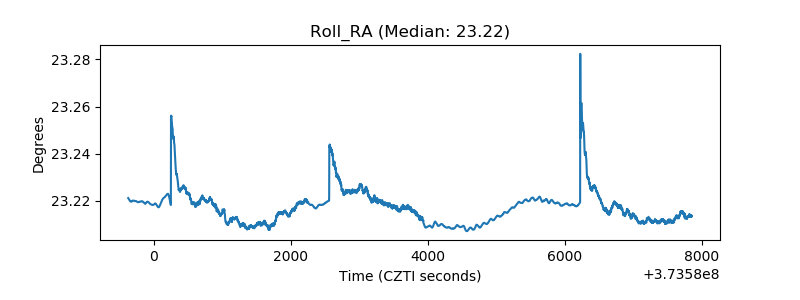 |
| Veto Counter | 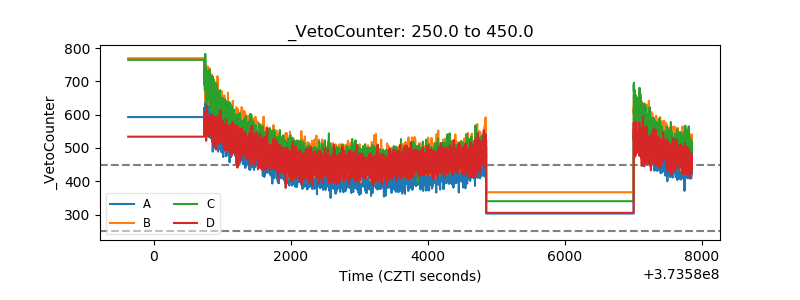 |