| Param | Original file | Final file |
|---|---|---|
| Filename | modeM0/AS1C07_003T01_9000004754_32976cztM0_level2.evt | modeM0/AS1C07_003T01_9000004754_32976cztM0_level2_quad_clean.evt |
| Size (bytes) | 401,906,880 | 63,460,800 |
| Size | 383.3 MB | 60.5 MB |
| Events in quadrant A | 2,398,617 | 401,189 |
| Events in quadrant B | 3,090,315 | 408,954 |
| Events in quadrant C | 2,668,068 | 385,130 |
| Events in quadrant D | 3,668,704 | 369,407 |
| Mode SS | |||
|---|---|---|---|
| Quadrant | BADHDUFLAG | Total packets | Discarded packets |
| A | 0 | 104 | 0 |
| B | 0 | 104 | 0 |
| C | 0 | 104 | 0 |
| D | 0 | 104 | 0 |
| Mode M9 | |||
|---|---|---|---|
| Quadrant | BADHDUFLAG | Total packets | Discarded packets |
| A | 0 | 37 | 0 |
| B | 0 | 37 | 0 |
| C | 0 | 37 | 0 |
| D | 0 | 38 | 0 |
| Mode M0 | |||
|---|---|---|---|
| Quadrant | BADHDUFLAG | Total packets | Discarded packets |
| A | 0 | 10324 | 3 |
| B | 0 | 12250 | 2 |
| C | 0 | 11038 | 2 |
| D | 0 | 14337 | 2 |
| Quadrant | Total seconds | Saturated seconds | Saturation percentage |
|---|---|---|---|
| A | 5091 | 6 | 0.117855% |
| B | 5091 | 176 | 3.457081% |
| C | 5091 | 107 | 2.101748% |
| D | 5091 | 51 | 1.001768% |
Noise dominated data is calculated using 1-second bins in cleaned event files. If a bin has >2000 counts, and if more than 50% of those come from <1% of pixels, then it is considered to be noise-dominated and hence unusable.
| Quadrant | # 1 sec bins | Bins with >0 counts | Bins with >2000 counts | High rate bins dominated by noise | Noise dominated (total time) | Noise dominated (detector-on time) | Marked lightcurve |
|---|---|---|---|---|---|---|---|
| A | 7213 | 5092 | 1 | 1 | 0.01% | 0.02% | 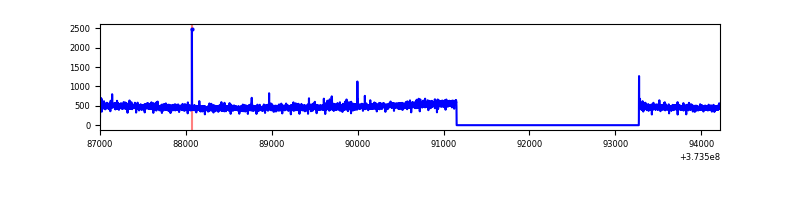 |
| B | 7213 | 5092 | 126 | 126 | 1.75% | 2.47% | 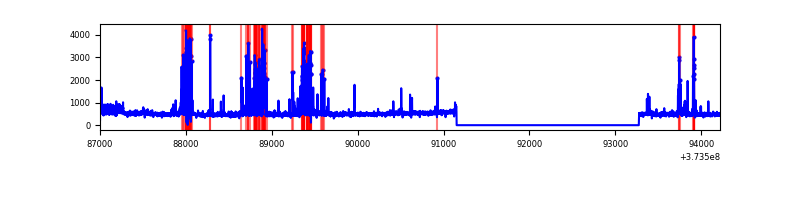 |
| C | 7213 | 5092 | 43 | 43 | 0.60% | 0.84% | 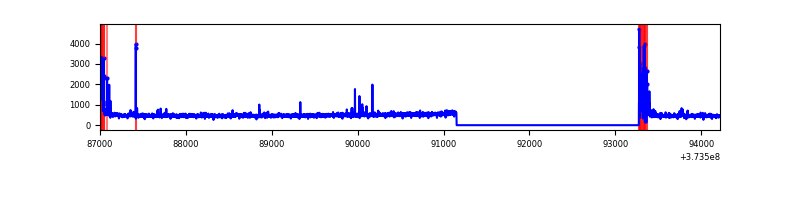 |
| D | 7213 | 5092 | 50 | 50 | 0.69% | 0.98% | 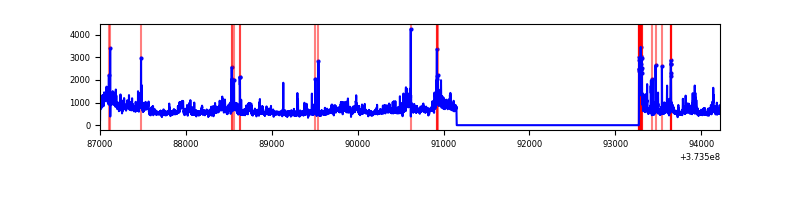 |
Top three noisy pixels from each quadrant. If the there are fewer than three noisy pixels in the level2.evt file, extra rows are filled as -1
| Pixel properties | Quadrant properties | ||||||
|---|---|---|---|---|---|---|---|
| Quadrant | DetID | PixID | Counts | Sigma | Mean | Median | Sigma |
| A | 13 | 254 | 8726 | 66.02 | 616 | 605 | 123.0 |
| A | 9 | 143 | 8103 | 60.95 | 616 | 605 | 123.0 |
| A | 3 | 137 | 5470 | 39.55 | 616 | 605 | 123.0 |
| B | 5 | 172 | 559466 | 4737.38 | 615 | 601 | 118.0 |
| B | 0 | 197 | 73223 | 615.6 | 615 | 601 | 118.0 |
| B | 0 | 230 | 20653 | 169.98 | 615 | 601 | 118.0 |
| C | 0 | 10 | 245225 | 1762.98 | 598 | 605 | 138.8 |
| C | 14 | 67 | 40359 | 286.51 | 598 | 605 | 138.8 |
| C | 1 | 241 | 24572 | 172.73 | 598 | 605 | 138.8 |
| D | 8 | 195 | 650114 | 4193.46 | 591 | 580 | 154.9 |
| D | 12 | 227 | 401692 | 2589.62 | 591 | 580 | 154.9 |
| D | 13 | 153 | 82780 | 530.69 | 591 | 580 | 154.9 |
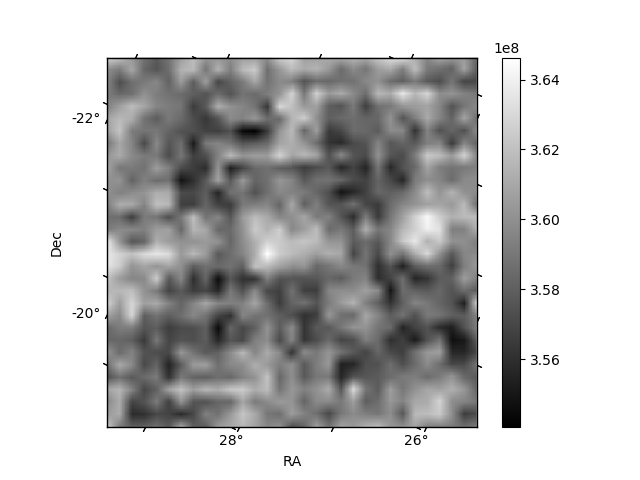
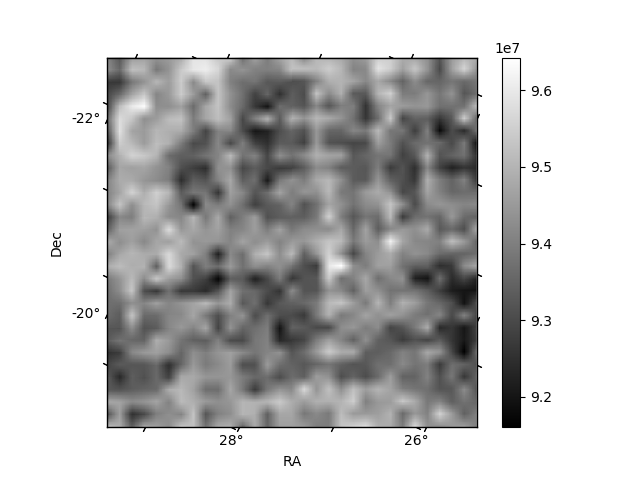
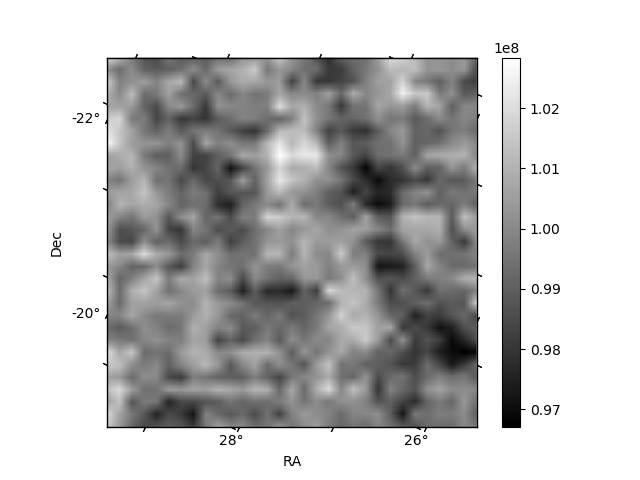
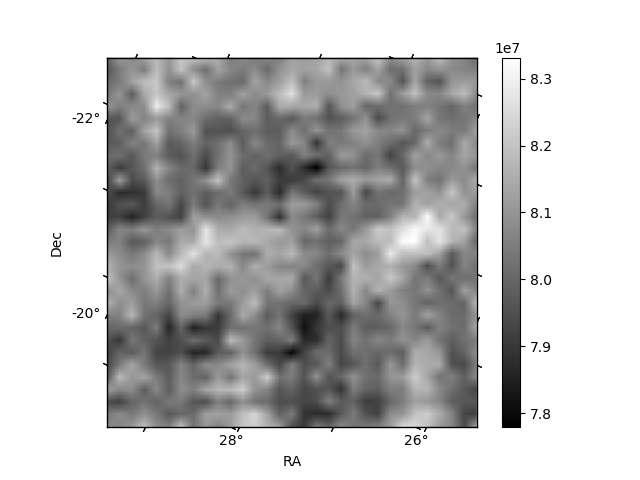
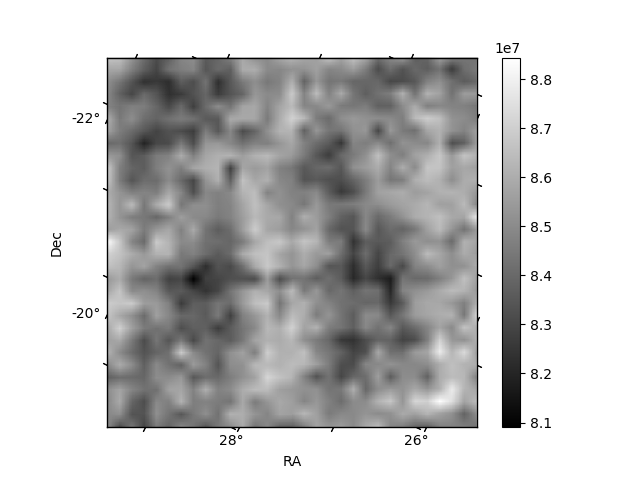
Histogram calculated using DETX and DETY for each event in the final _common_clean file
| Quadrant A | 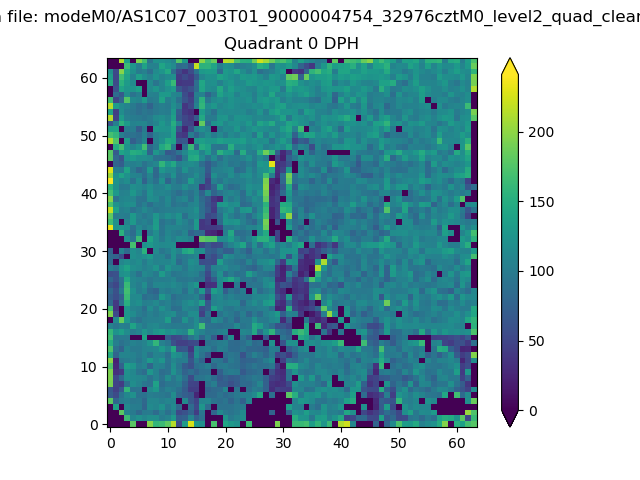 |
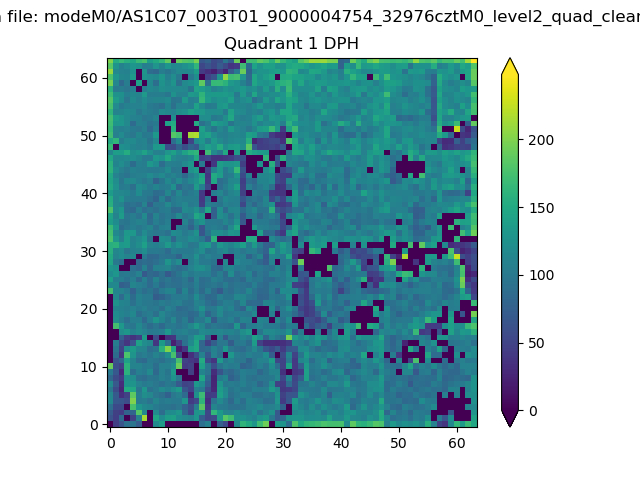 |
Quadrant B |
|---|---|---|---|
| Quadrant D | 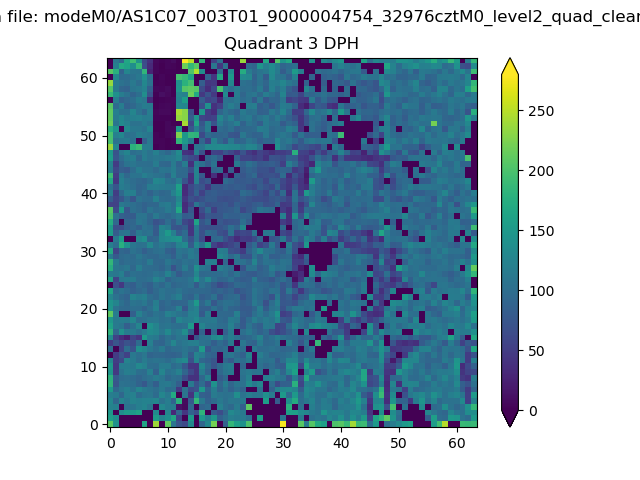 |
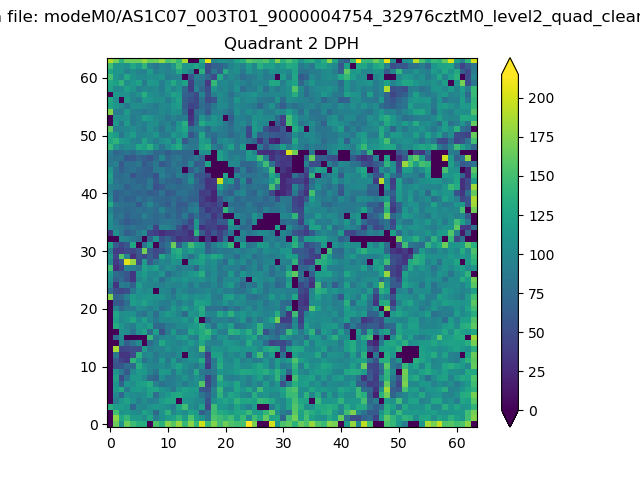 |
Quadrant C |
| Plot type | Count rate plots | Images |
|---|---|---|
| Comparison with Poisson distribution Blue bars denote a histogram of data divided into 1 sec bins. Red curve is a Poisson curve with rate = median count rate of data. |
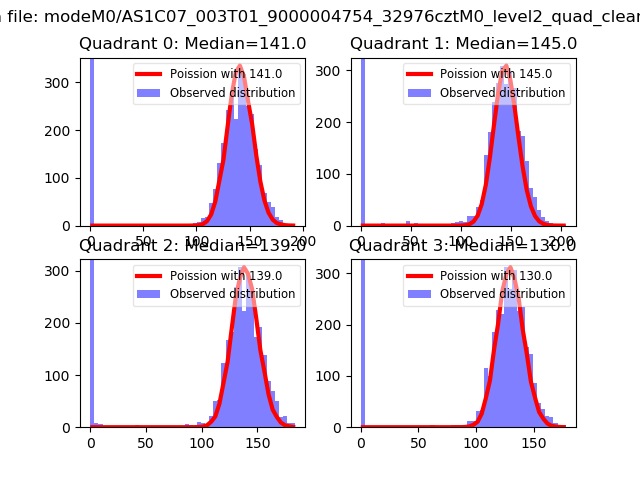 |
 |
| Quadrant-wise count rates Data is divided into 100 sec bins |
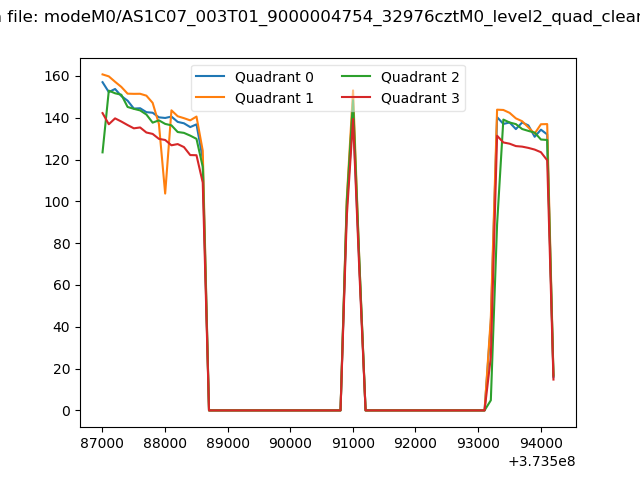 |
|
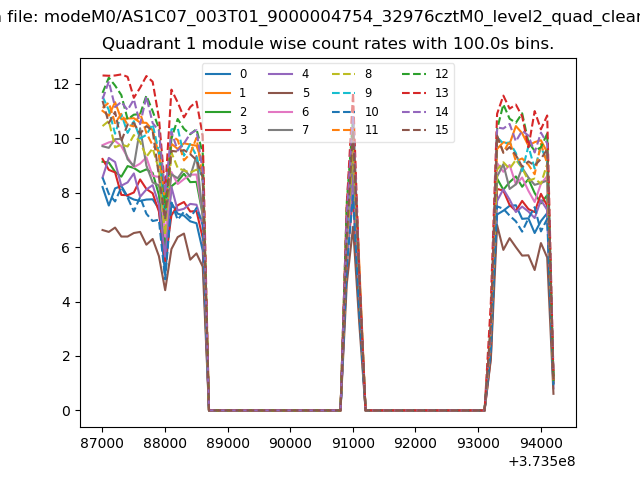
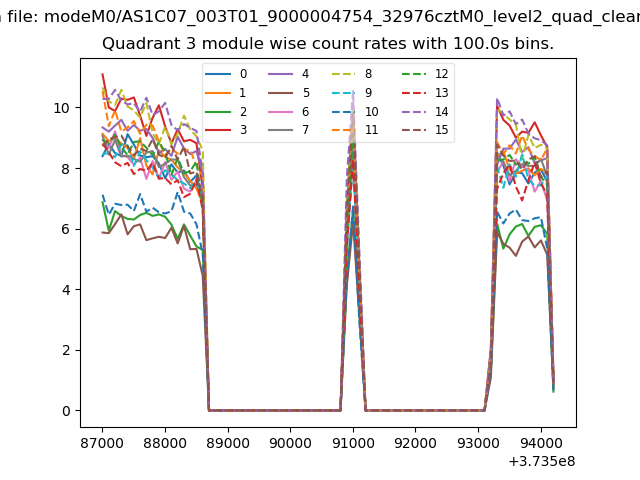
| Module-wise count rates for Quadrant A Data is divided into 100 sec bins |
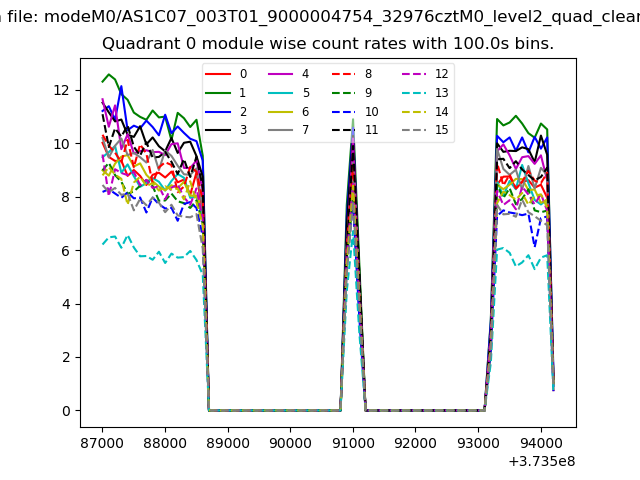 |
 |
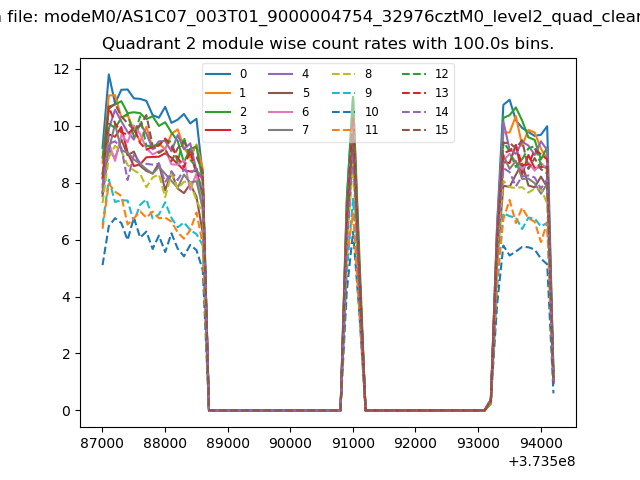
| Module-wise count rates for Quadrant B Data is divided into 100 sec bins |
 |
 |
| Module-wise count rates for Quadrant C Data is divided into 100 sec bins |
 |
 |
| Module-wise count rates for Quadrant D Data is divided into 100 sec bins |
 |
 |
| Parameter | Plot |
|---|---|
| CZT HV Monitor | 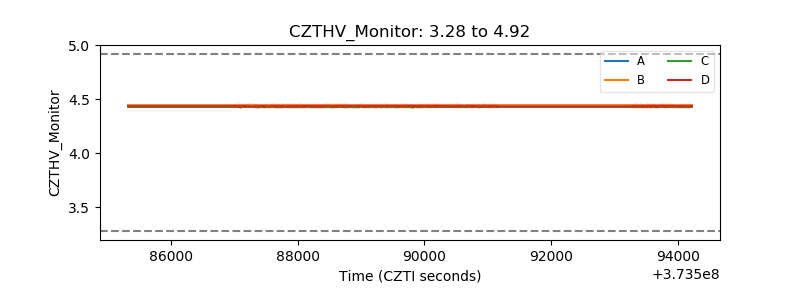 |
| D_VDD |  |
| Temperature 1 | 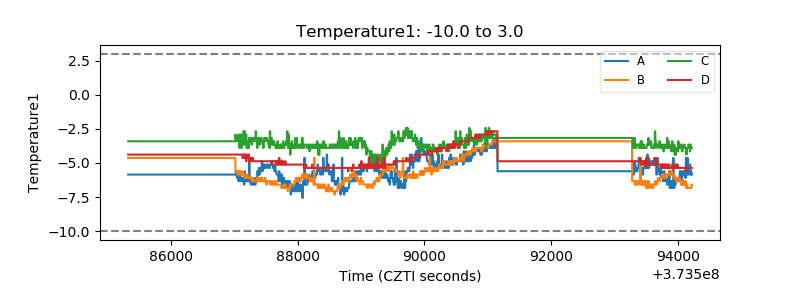 |
| Veto HV Monitor | 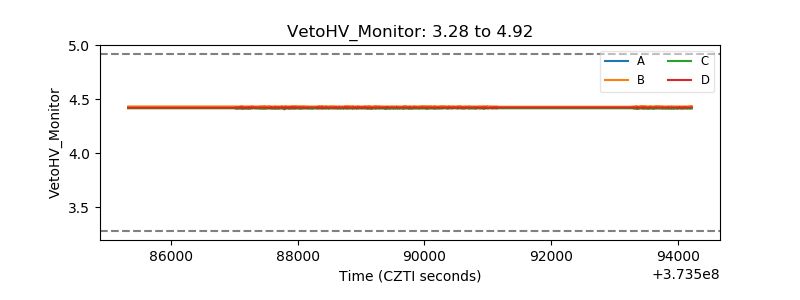 |
| Veto LLD | 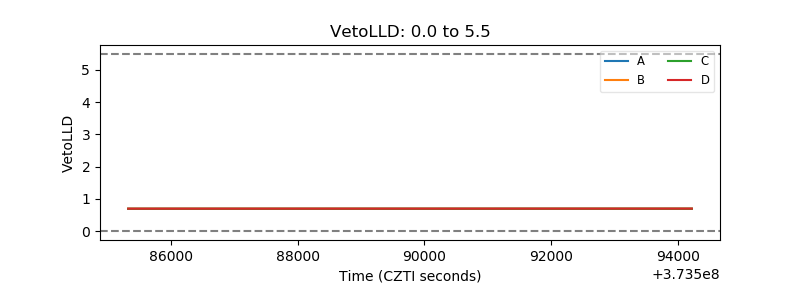 |
| Alpha Counter | 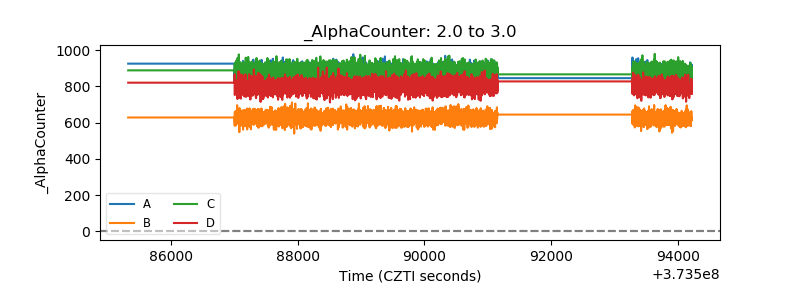 |
| _CPM_Rate | 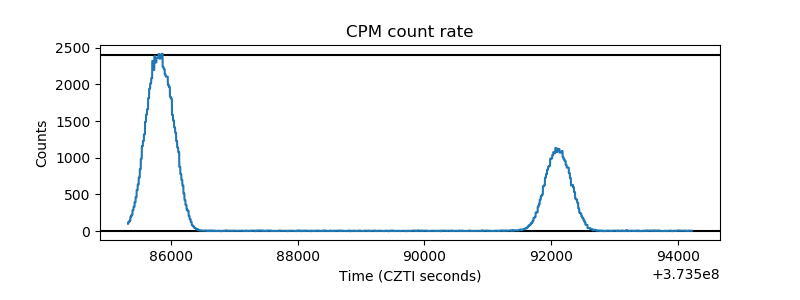 |
| CZT Counter | 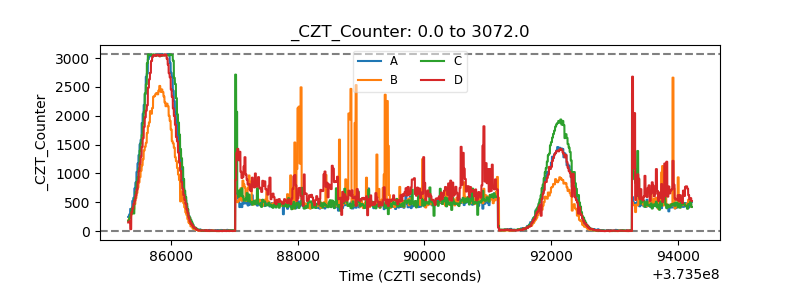 |
| +2.5 Volts monitor | 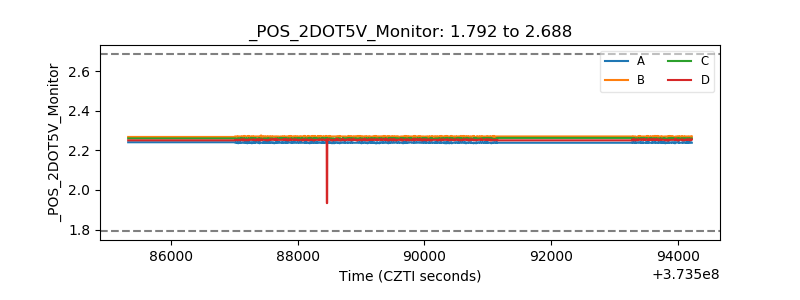 |
| +5 Volts monitor |  |
| _ROLL_ROT | 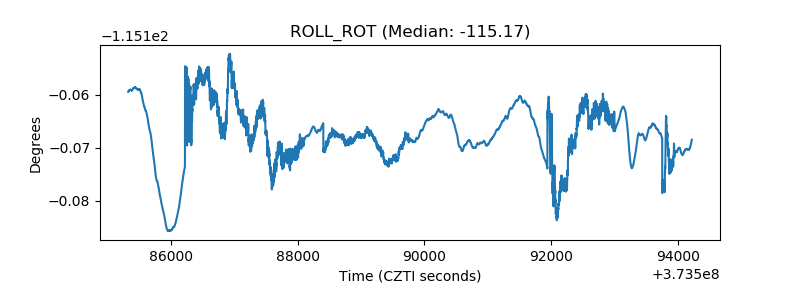 |
| _Roll_DEC | 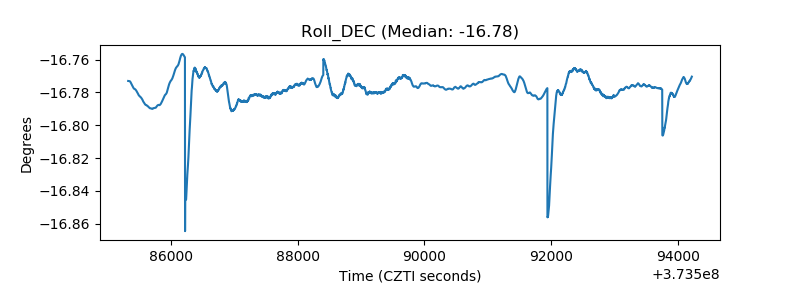 |
| _Roll_RA | 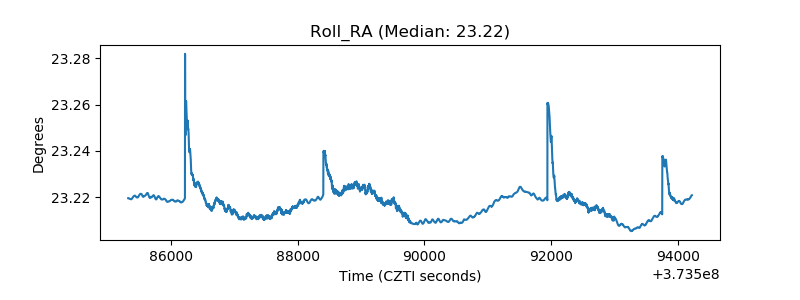 |
| Veto Counter | 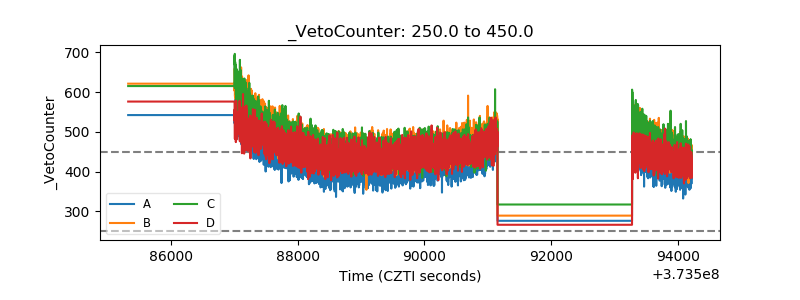 |