| Param | Original file | Final file |
|---|---|---|
| Filename | modeM0/AS1C07_003T01_9000004754_32977cztM0_level2.evt | modeM0/AS1C07_003T01_9000004754_32977cztM0_level2_quad_clean.evt |
| Size (bytes) | 405,403,200 | 60,914,880 |
| Size | 386.6 MB | 58.1 MB |
| Events in quadrant A | 2,378,820 | 383,618 |
| Events in quadrant B | 3,164,990 | 385,181 |
| Events in quadrant C | 2,768,684 | 361,996 |
| Events in quadrant D | 3,617,162 | 354,910 |
| Mode SS | |||
|---|---|---|---|
| Quadrant | BADHDUFLAG | Total packets | Discarded packets |
| A | 0 | 104 | 0 |
| B | 0 | 104 | 0 |
| C | 0 | 104 | 0 |
| D | 0 | 104 | 0 |
| Mode M9 | |||
|---|---|---|---|
| Quadrant | BADHDUFLAG | Total packets | Discarded packets |
| A | 0 | 30 | 0 |
| B | 0 | 30 | 0 |
| C | 0 | 30 | 0 |
| D | 0 | 31 | 0 |
| Mode M0 | |||
|---|---|---|---|
| Quadrant | BADHDUFLAG | Total packets | Discarded packets |
| A | 0 | 10362 | 3 |
| B | 0 | 12663 | 2 |
| C | 0 | 11424 | 2 |
| D | 0 | 14175 | 2 |
| Quadrant | Total seconds | Saturated seconds | Saturation percentage |
|---|---|---|---|
| A | 5117 | 9 | 0.175884% |
| B | 5117 | 211 | 4.123510% |
| C | 5117 | 189 | 3.693570% |
| D | 5117 | 133 | 2.599179% |
Noise dominated data is calculated using 1-second bins in cleaned event files. If a bin has >2000 counts, and if more than 50% of those come from <1% of pixels, then it is considered to be noise-dominated and hence unusable.
| Quadrant | # 1 sec bins | Bins with >0 counts | Bins with >2000 counts | High rate bins dominated by noise | Noise dominated (total time) | Noise dominated (detector-on time) | Marked lightcurve |
|---|---|---|---|---|---|---|---|
| A | 7089 | 5118 | 0 | 0 | 0.00% | 0.00% | 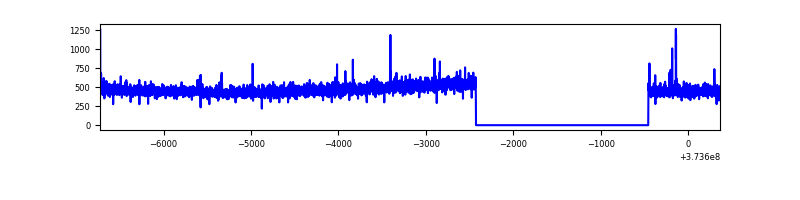 |
| B | 7089 | 5118 | 121 | 121 | 1.71% | 2.36% | 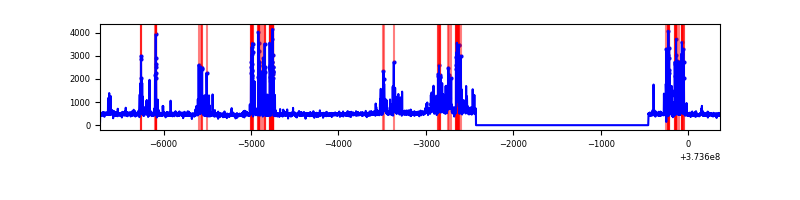 |
| C | 7089 | 5118 | 100 | 100 | 1.41% | 1.95% | 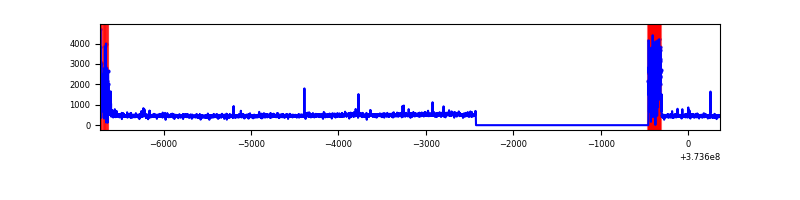 |
| D | 7089 | 5118 | 114 | 114 | 1.61% | 2.23% | 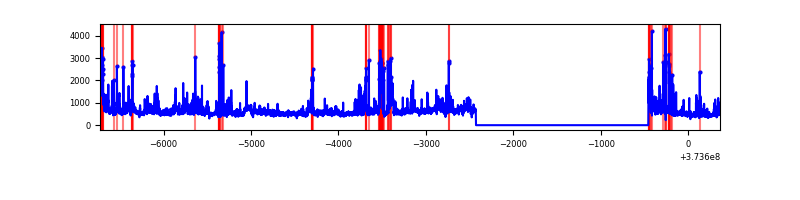 |
Top three noisy pixels from each quadrant. If the there are fewer than three noisy pixels in the level2.evt file, extra rows are filled as -1
| Pixel properties | Quadrant properties | ||||||
|---|---|---|---|---|---|---|---|
| Quadrant | DetID | PixID | Counts | Sigma | Mean | Median | Sigma |
| A | 9 | 143 | 9125 | 69.32 | 608 | 596 | 123.0 |
| A | 12 | 227 | 9016 | 68.43 | 608 | 596 | 123.0 |
| A | 13 | 254 | 8623 | 65.24 | 608 | 596 | 123.0 |
| B | 5 | 172 | 710726 | 6127.24 | 604 | 589 | 115.9 |
| B | 0 | 197 | 45577 | 388.17 | 604 | 589 | 115.9 |
| B | 0 | 199 | 15265 | 126.63 | 604 | 589 | 115.9 |
| C | 0 | 10 | 428347 | 3160.78 | 583 | 589 | 135.3 |
| C | 14 | 67 | 21856 | 157.15 | 583 | 589 | 135.3 |
| C | 1 | 241 | 18054 | 129.05 | 583 | 589 | 135.3 |
| D | 8 | 195 | 363286 | 2356.69 | 583 | 572 | 153.9 |
| D | 12 | 227 | 272779 | 1768.63 | 583 | 572 | 153.9 |
| D | 13 | 153 | 258877 | 1678.3 | 583 | 572 | 153.9 |
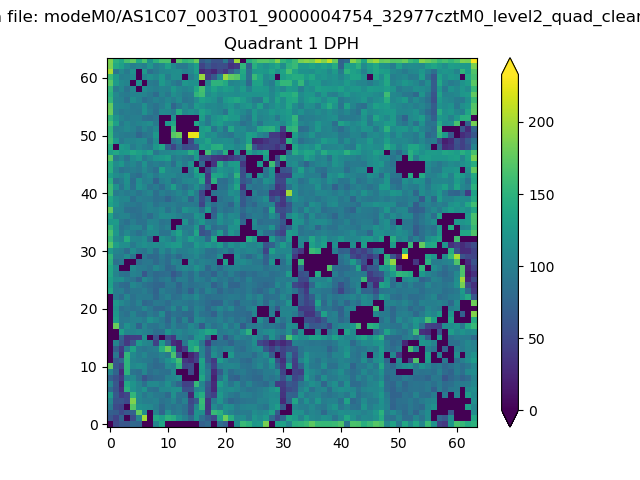
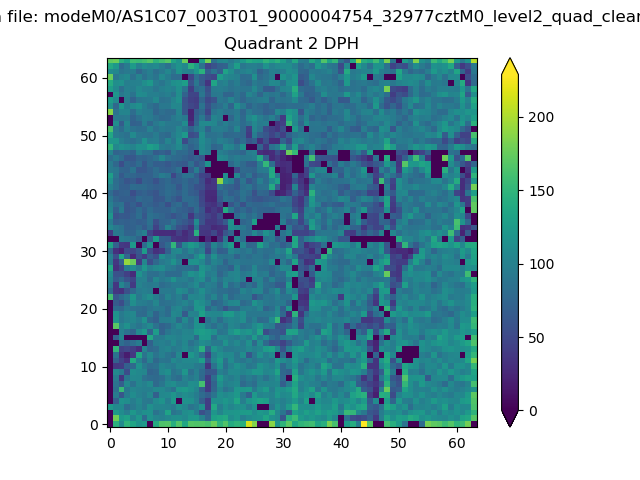
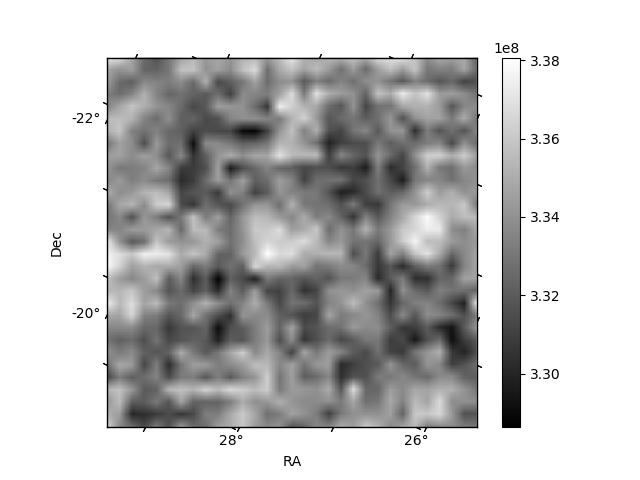
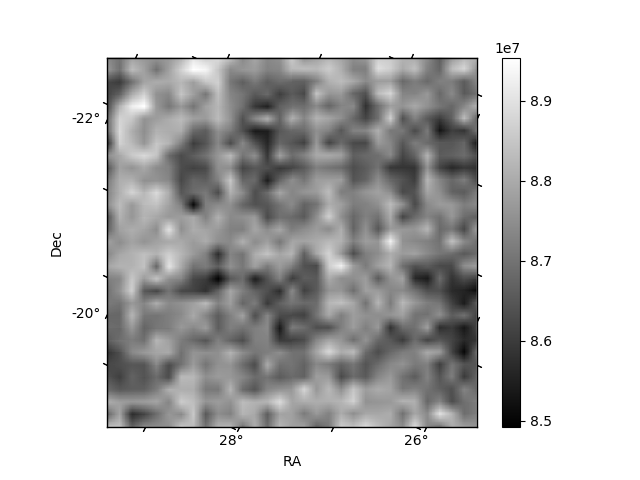
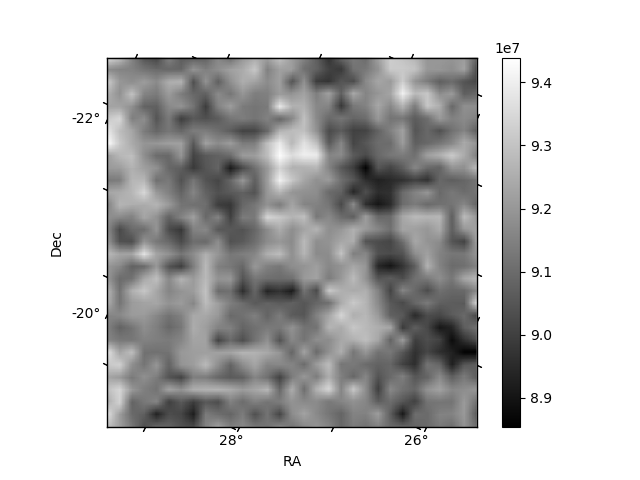
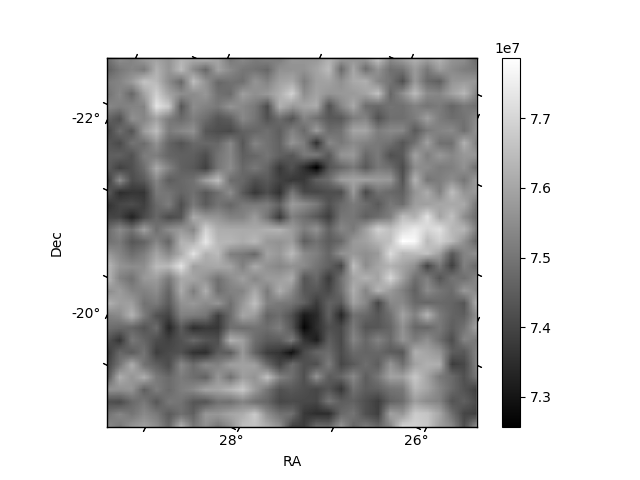
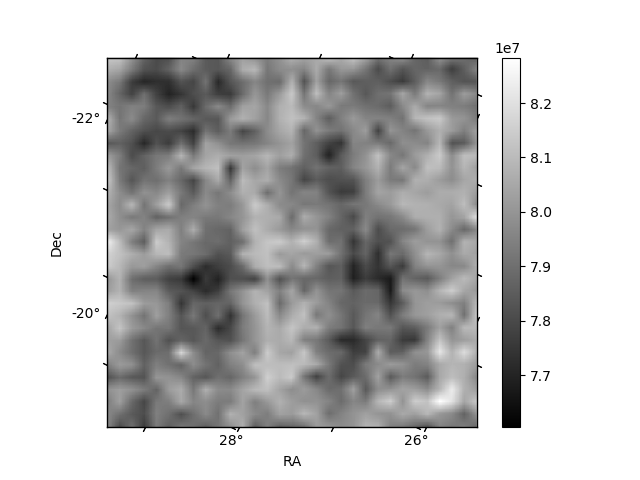
Histogram calculated using DETX and DETY for each event in the final _common_clean file
| Quadrant A |  |
 |
Quadrant B |
|---|---|---|---|
| Quadrant D | 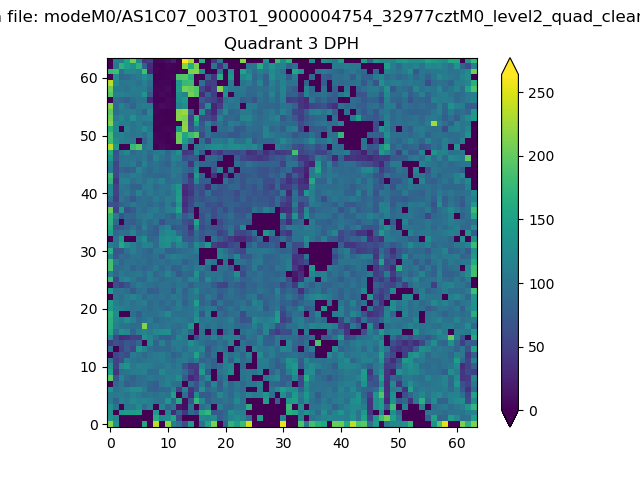 |
 |
Quadrant C |
| Plot type | Count rate plots | Images |
|---|---|---|
| Comparison with Poisson distribution Blue bars denote a histogram of data divided into 1 sec bins. Red curve is a Poisson curve with rate = median count rate of data. |
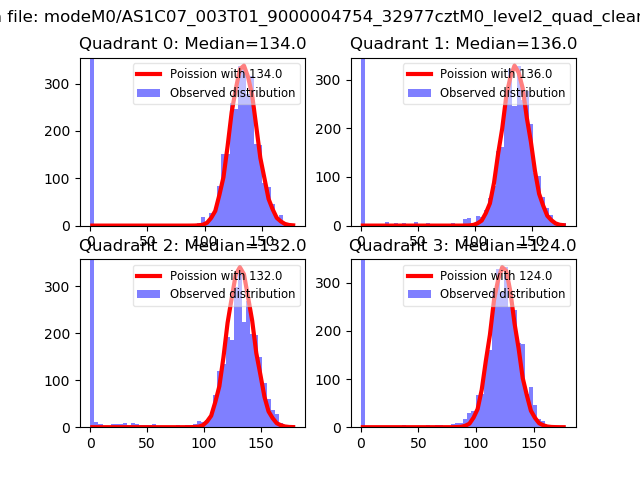 |
 |
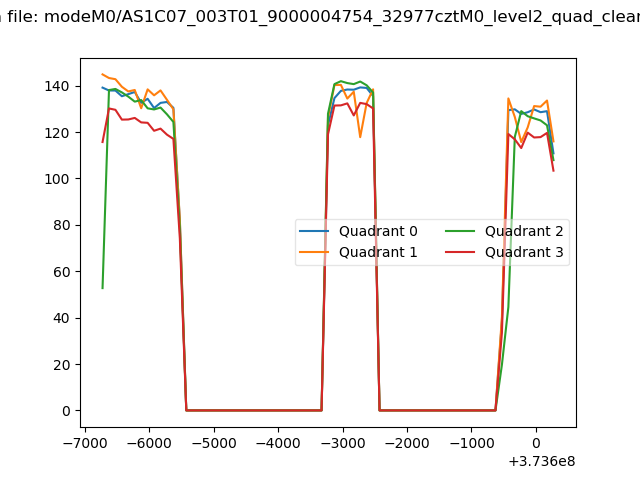
| Quadrant-wise count rates Data is divided into 100 sec bins |
 |
|
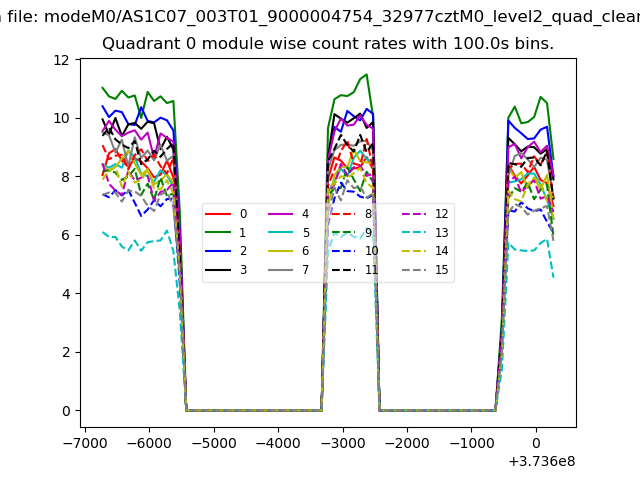
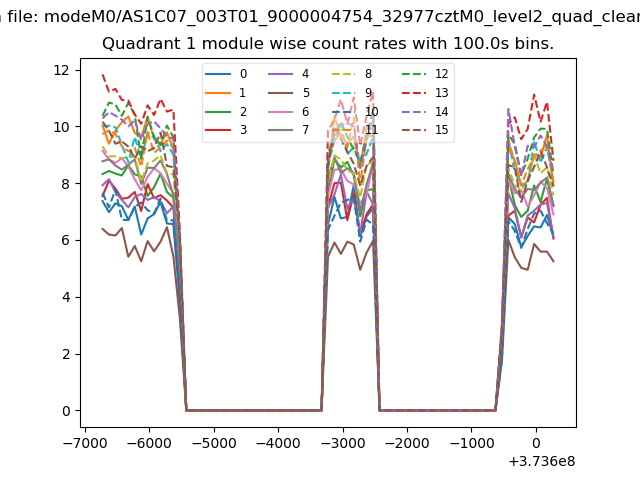
| Module-wise count rates for Quadrant A Data is divided into 100 sec bins |
 |
 |
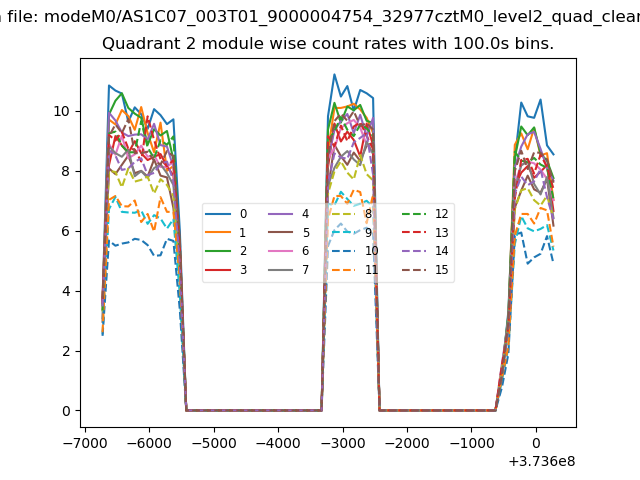
| Module-wise count rates for Quadrant B Data is divided into 100 sec bins |
 |
 |
| Module-wise count rates for Quadrant C Data is divided into 100 sec bins |
 |
 |
| Module-wise count rates for Quadrant D Data is divided into 100 sec bins |
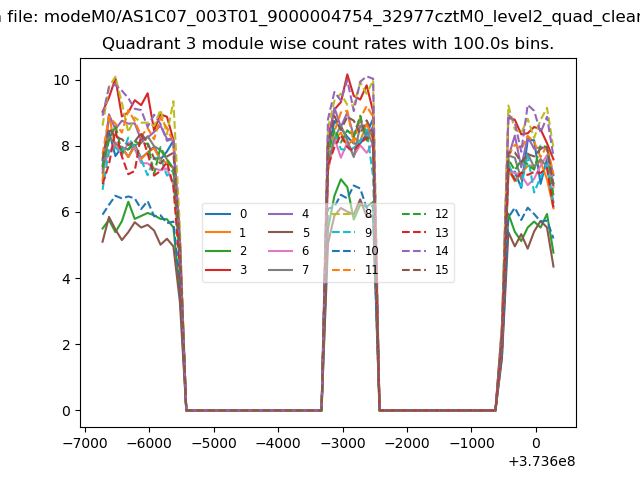 |
 |
| Parameter | Plot |
|---|---|
| CZT HV Monitor | 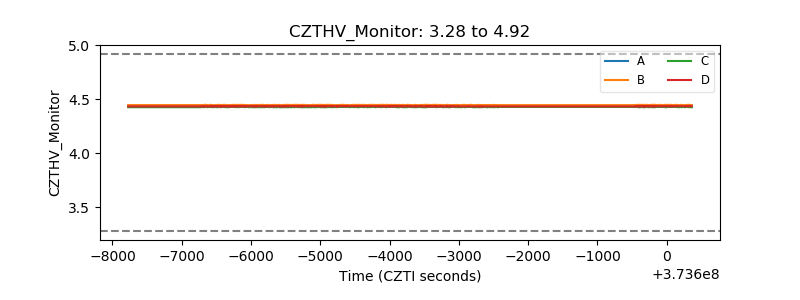 |
| D_VDD | 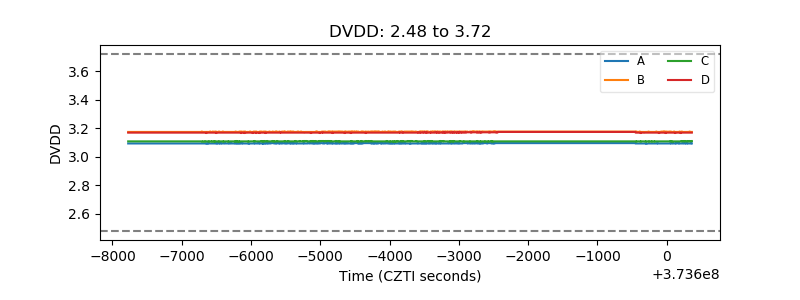 |
| Temperature 1 | 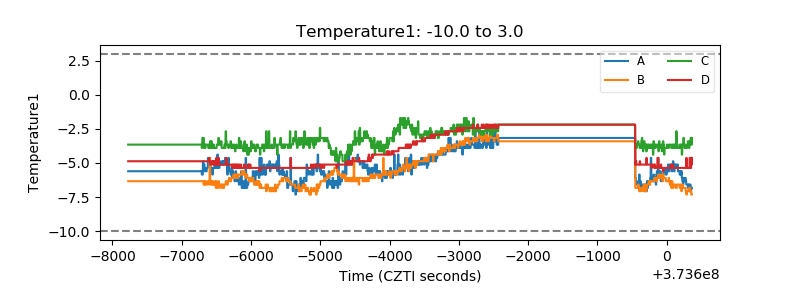 |
| Veto HV Monitor | 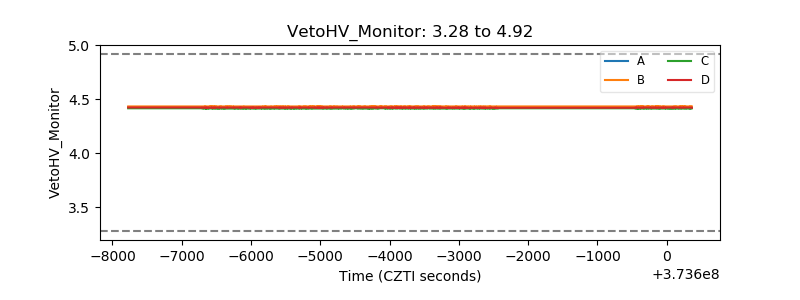 |
| Veto LLD | 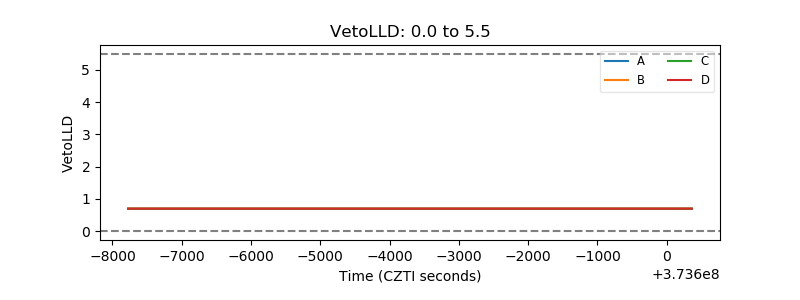 |
| Alpha Counter | 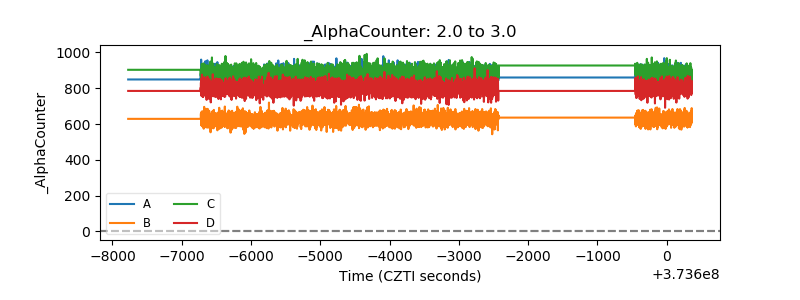 |
| _CPM_Rate | 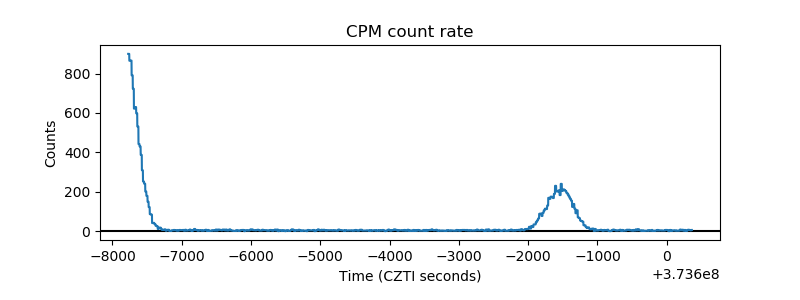 |
| CZT Counter | 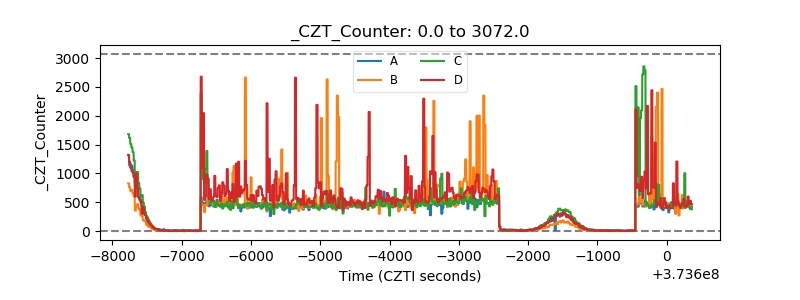 |
| +2.5 Volts monitor |  |
| +5 Volts monitor |  |
| _ROLL_ROT | 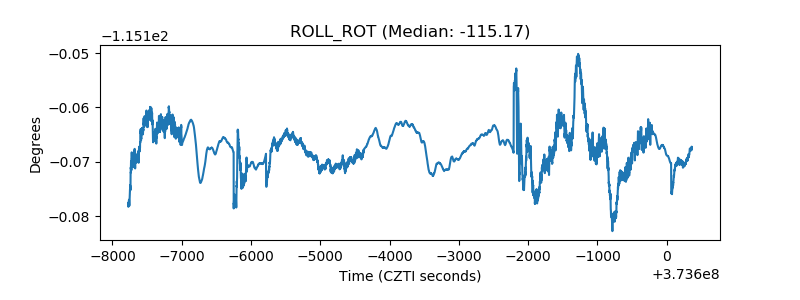 |
| _Roll_DEC | 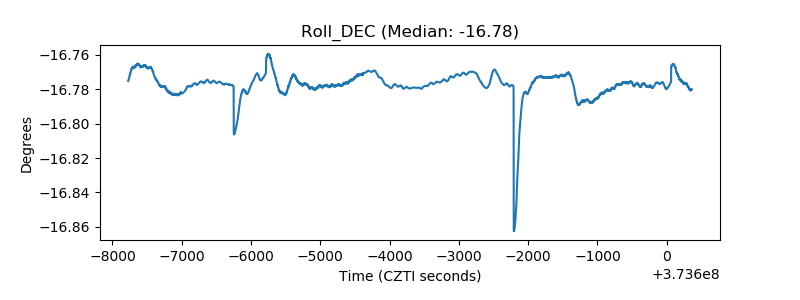 |
| _Roll_RA | 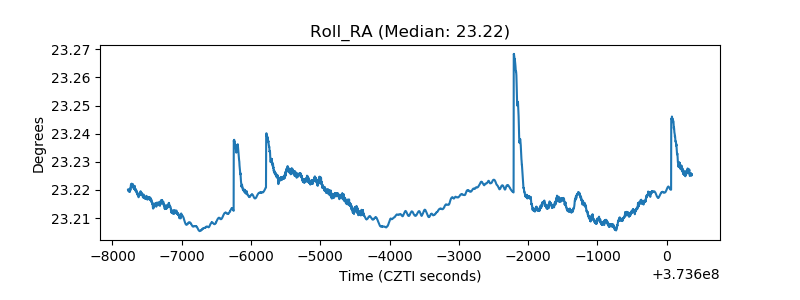 |
| Veto Counter | 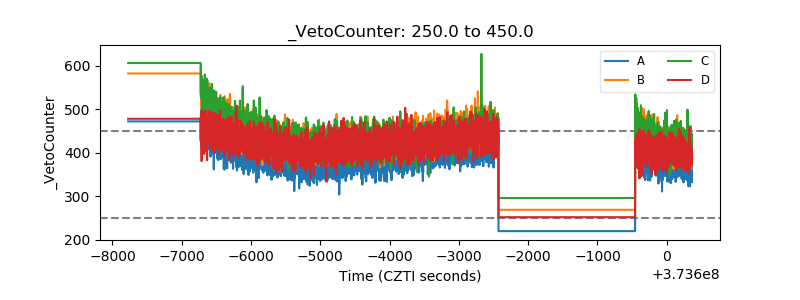 |