| Param | Original file | Final file |
|---|---|---|
| Filename | modeM0/AS1C07_003T01_9000004754_32978cztM0_level2.evt | modeM0/AS1C07_003T01_9000004754_32978cztM0_level2_quad_clean.evt |
| Size (bytes) | 413,864,640 | 59,160,960 |
| Size | 394.7 MB | 56.4 MB |
| Events in quadrant A | 2,498,295 | 364,756 |
| Events in quadrant B | 3,519,085 | 355,810 |
| Events in quadrant C | 2,889,649 | 349,848 |
| Events in quadrant D | 3,257,263 | 340,286 |
| Mode SS | |||
|---|---|---|---|
| Quadrant | BADHDUFLAG | Total packets | Discarded packets |
| A | 0 | 110 | 0 |
| B | 0 | 110 | 0 |
| C | 0 | 110 | 0 |
| D | 0 | 110 | 0 |
| Mode M9 | |||
|---|---|---|---|
| Quadrant | BADHDUFLAG | Total packets | Discarded packets |
| A | 0 | 31 | 0 |
| B | 0 | 31 | 0 |
| C | 0 | 31 | 0 |
| D | 0 | 32 | 0 |
| Mode M0 | |||
|---|---|---|---|
| Quadrant | BADHDUFLAG | Total packets | Discarded packets |
| A | 0 | 10968 | 3 |
| B | 0 | 13919 | 2 |
| C | 0 | 12029 | 2 |
| D | 0 | 13177 | 2 |
| Quadrant | Total seconds | Saturated seconds | Saturation percentage |
|---|---|---|---|
| A | 5436 | 3 | 0.055188% |
| B | 5436 | 316 | 5.813098% |
| C | 5436 | 141 | 2.593819% |
| D | 5436 | 60 | 1.103753% |
Noise dominated data is calculated using 1-second bins in cleaned event files. If a bin has >2000 counts, and if more than 50% of those come from <1% of pixels, then it is considered to be noise-dominated and hence unusable.
| Quadrant | # 1 sec bins | Bins with >0 counts | Bins with >2000 counts | High rate bins dominated by noise | Noise dominated (total time) | Noise dominated (detector-on time) | Marked lightcurve |
|---|---|---|---|---|---|---|---|
| A | 7080 | 5437 | 0 | 0 | 0.00% | 0.00% | 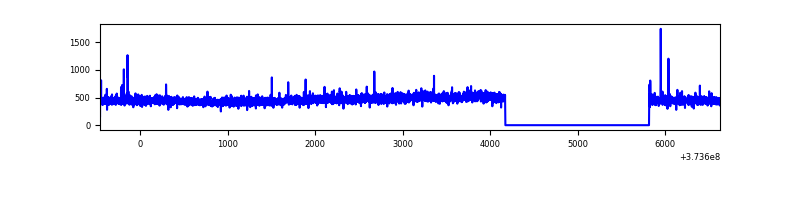 |
| B | 7080 | 5437 | 206 | 206 | 2.91% | 3.79% | 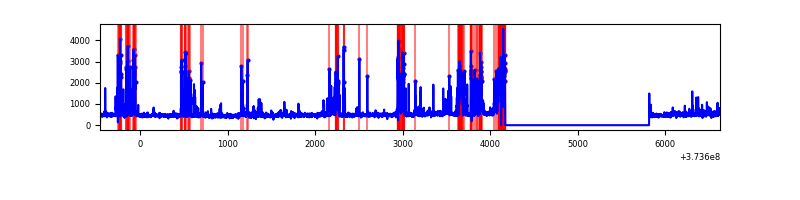 |
| C | 7080 | 5437 | 105 | 105 | 1.48% | 1.93% | 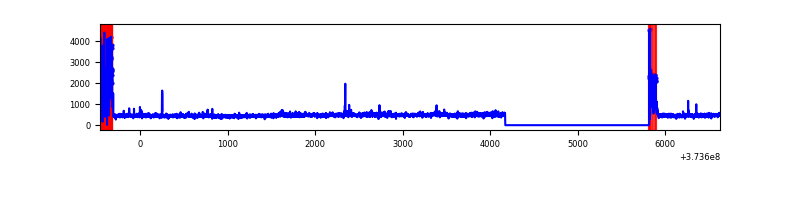 |
| D | 7080 | 5437 | 50 | 50 | 0.71% | 0.92% | 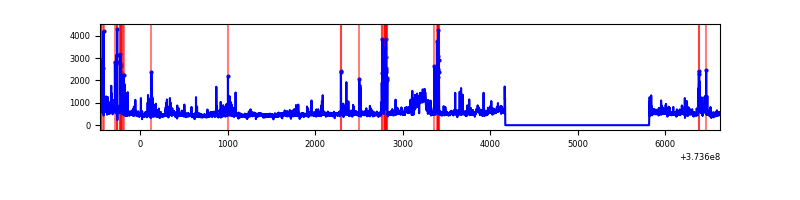 |
Top three noisy pixels from each quadrant. If the there are fewer than three noisy pixels in the level2.evt file, extra rows are filled as -1
| Pixel properties | Quadrant properties | ||||||
|---|---|---|---|---|---|---|---|
| Quadrant | DetID | PixID | Counts | Sigma | Mean | Median | Sigma |
| A | 9 | 143 | 19226 | 144.63 | 638 | 627 | 128.6 |
| A | 13 | 254 | 8636 | 62.28 | 638 | 627 | 128.6 |
| A | 12 | 227 | 7803 | 55.8 | 638 | 627 | 128.6 |
| B | 5 | 172 | 942306 | 7767.18 | 625 | 610 | 121.2 |
| B | 5 | 31 | 52291 | 426.27 | 625 | 610 | 121.2 |
| B | 0 | 197 | 17982 | 143.29 | 625 | 610 | 121.2 |
| C | 0 | 10 | 401454 | 2799.29 | 615 | 619 | 143.2 |
| C | 14 | 67 | 51820 | 357.57 | 615 | 619 | 143.2 |
| C | 1 | 241 | 17858 | 120.39 | 615 | 619 | 143.2 |
| D | 8 | 195 | 267145 | 1628.96 | 615 | 600 | 163.6 |
| D | 14 | 52 | 186893 | 1138.51 | 615 | 600 | 163.6 |
| D | 2 | 250 | 119010 | 723.65 | 615 | 600 | 163.6 |
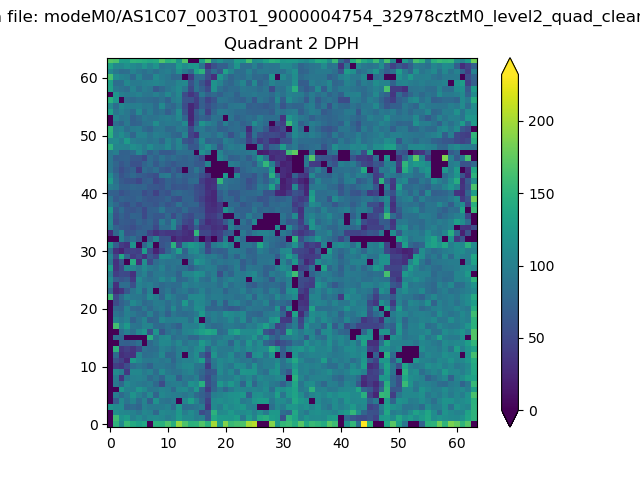
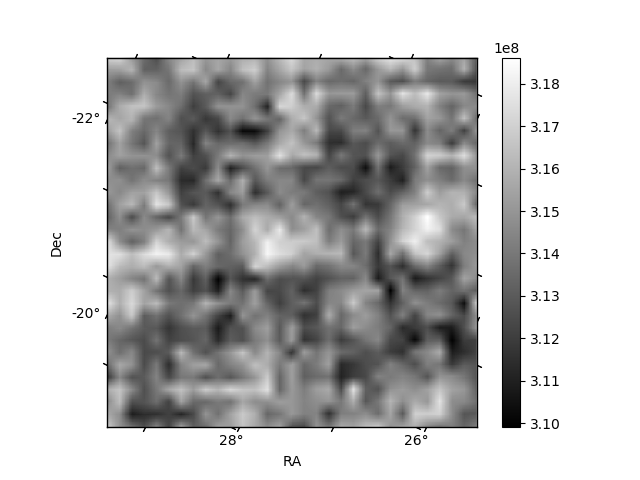
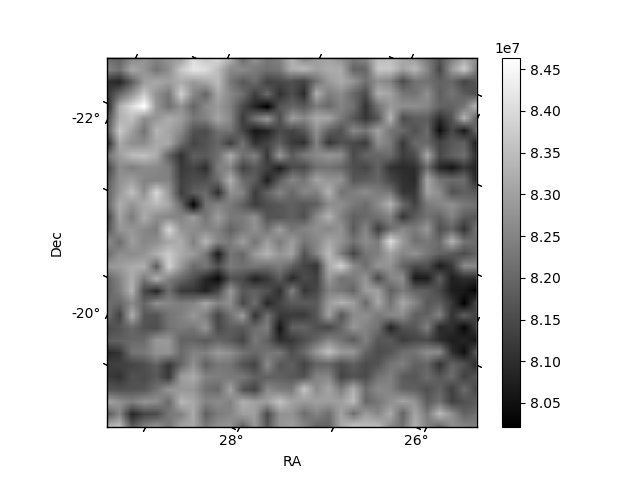
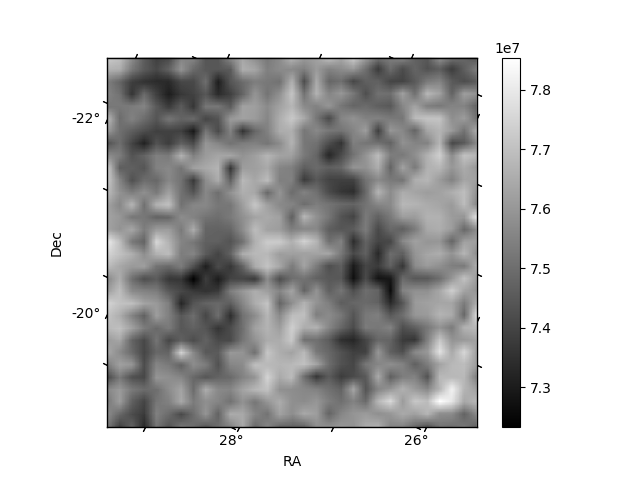
Histogram calculated using DETX and DETY for each event in the final _common_clean file
| Quadrant A | 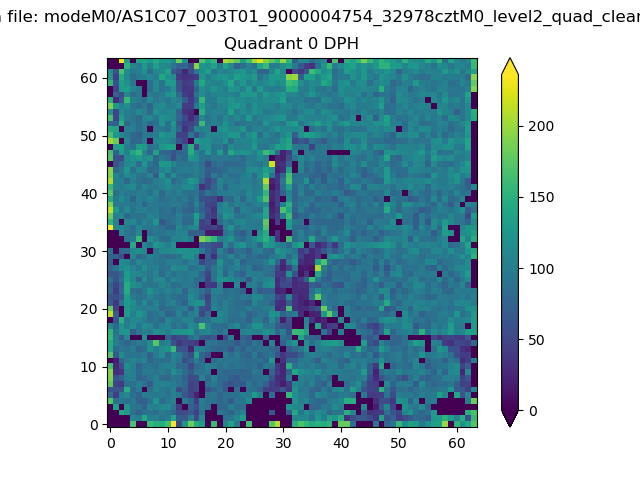 |
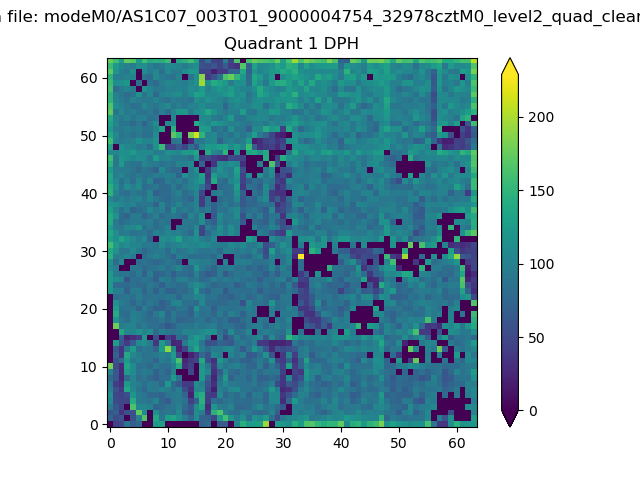 |
Quadrant B |
|---|---|---|---|
| Quadrant D | 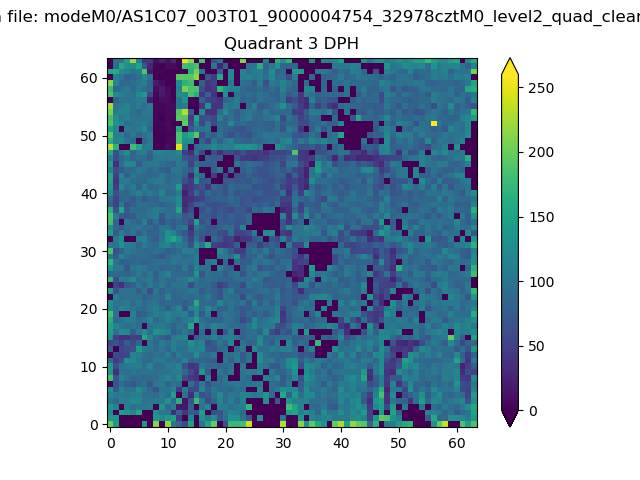 |
 |
Quadrant C |
| Plot type | Count rate plots | Images |
|---|---|---|
| Comparison with Poisson distribution Blue bars denote a histogram of data divided into 1 sec bins. Red curve is a Poisson curve with rate = median count rate of data. |
 |
 |
| Quadrant-wise count rates Data is divided into 100 sec bins |
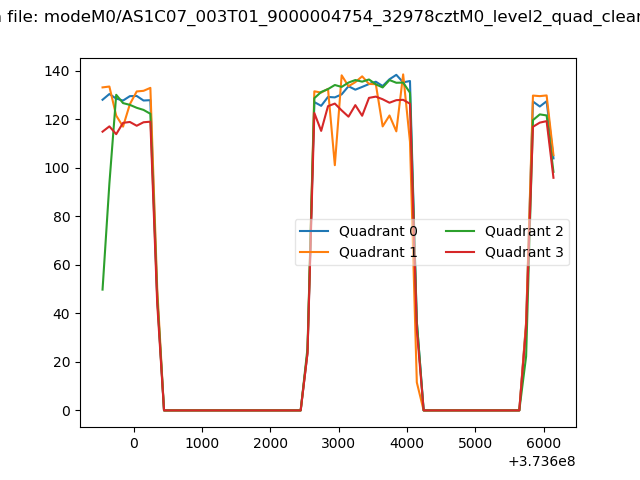 |
|
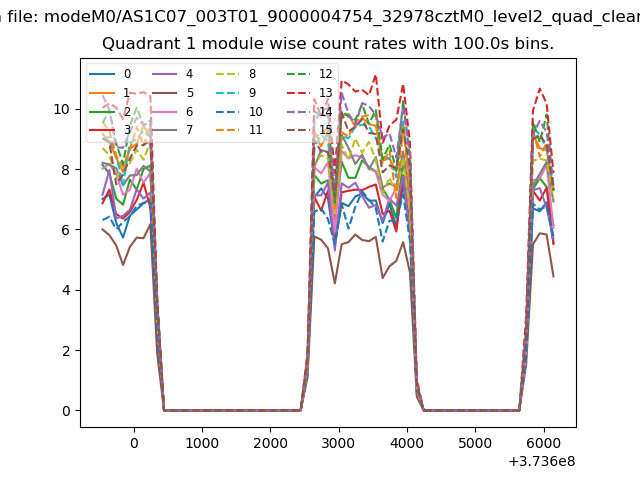
| Module-wise count rates for Quadrant A Data is divided into 100 sec bins |
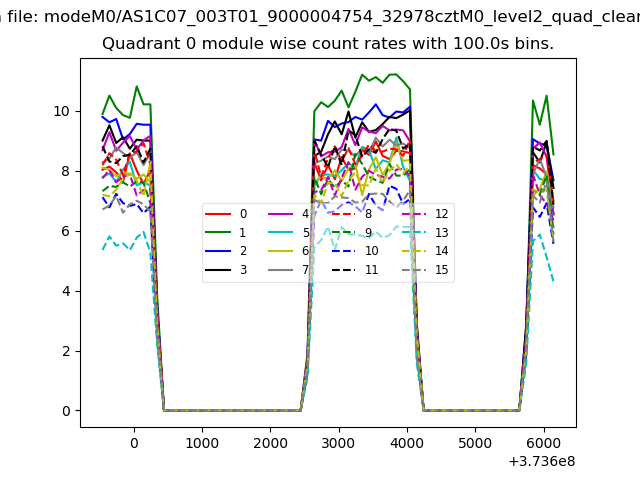 |
 |
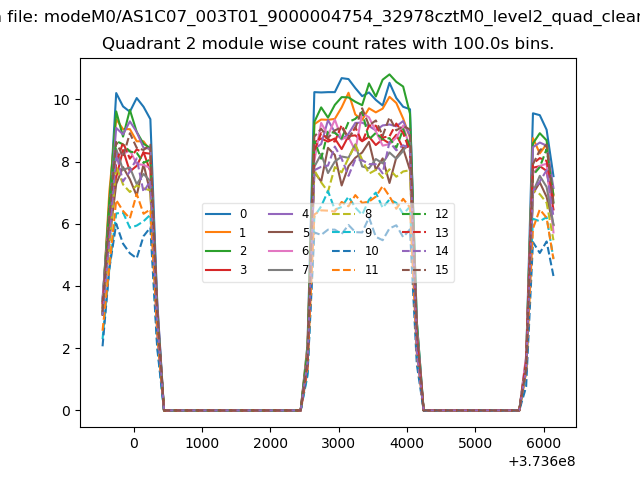
| Module-wise count rates for Quadrant B Data is divided into 100 sec bins |
 |
 |
| Module-wise count rates for Quadrant C Data is divided into 100 sec bins |
 |
 |
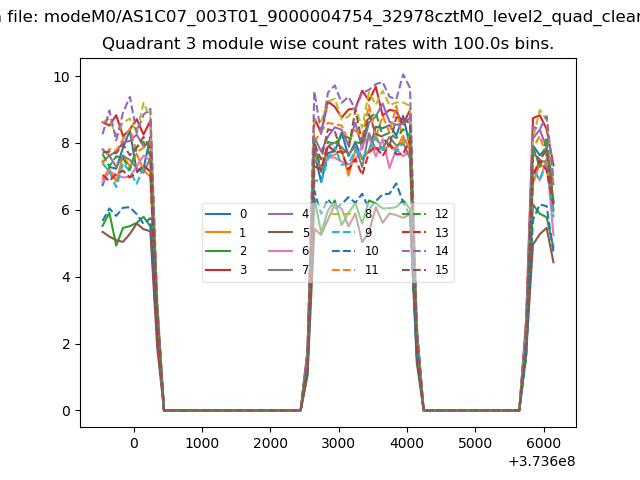
| Module-wise count rates for Quadrant D Data is divided into 100 sec bins |
 |
 |
| Parameter | Plot |
|---|---|
| CZT HV Monitor | 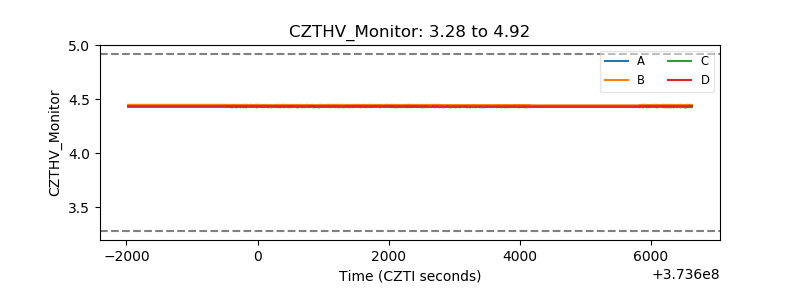 |
| D_VDD | 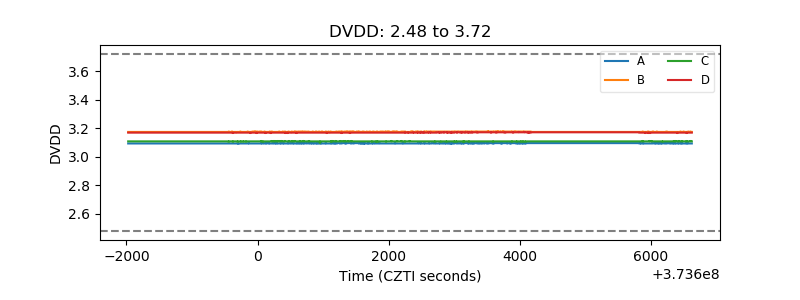 |
| Temperature 1 | 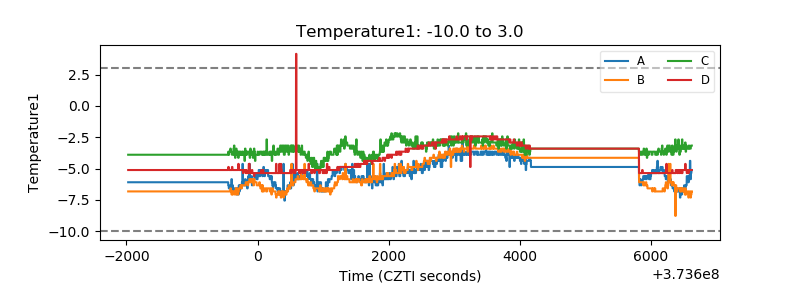 |
| Veto HV Monitor | 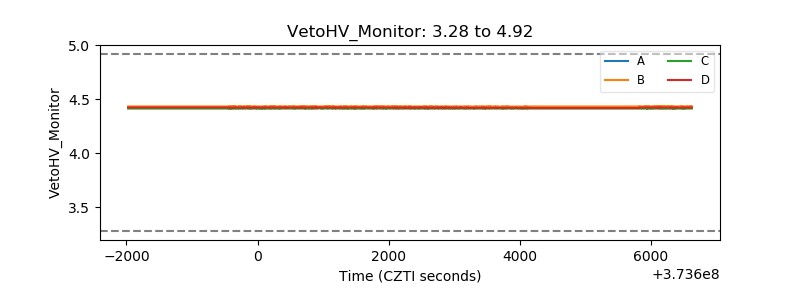 |
| Veto LLD | 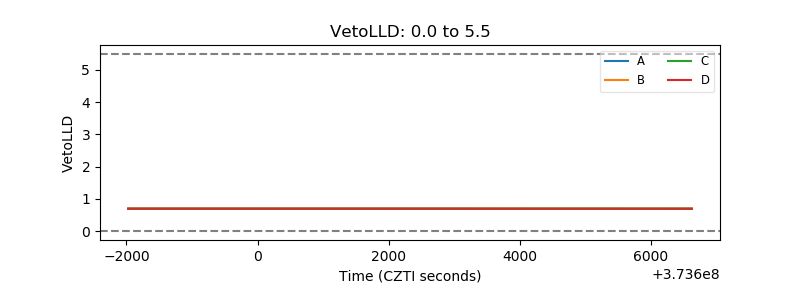 |
| Alpha Counter |  |
| _CPM_Rate |  |
| CZT Counter | 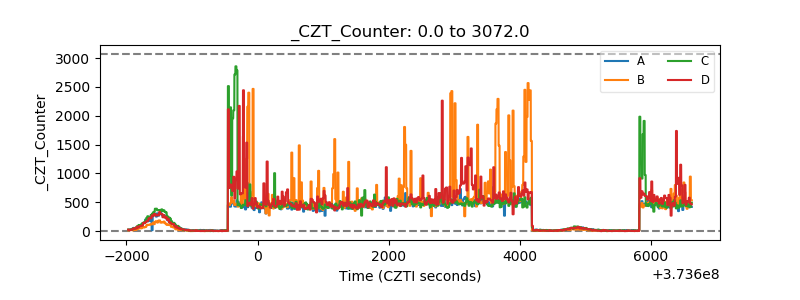 |
| +2.5 Volts monitor |  |
| +5 Volts monitor |  |
| _ROLL_ROT | 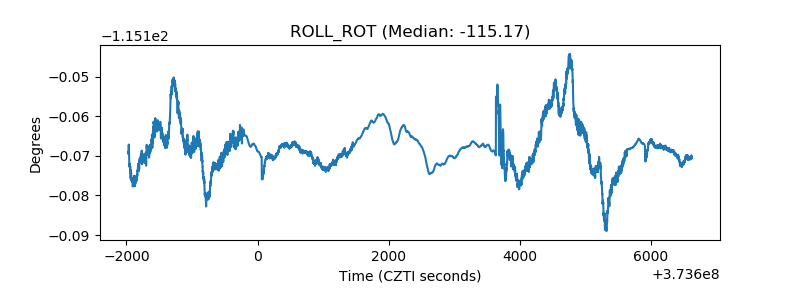 |
| _Roll_DEC | 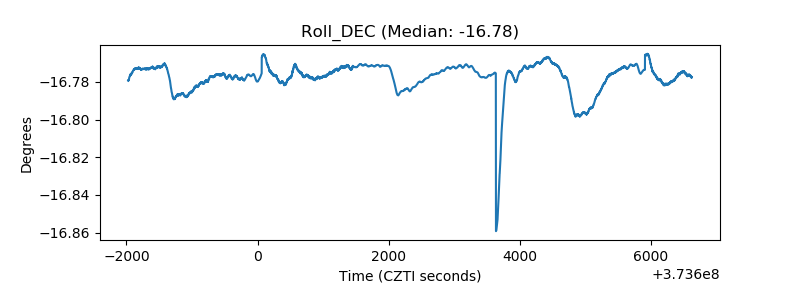 |
| _Roll_RA | 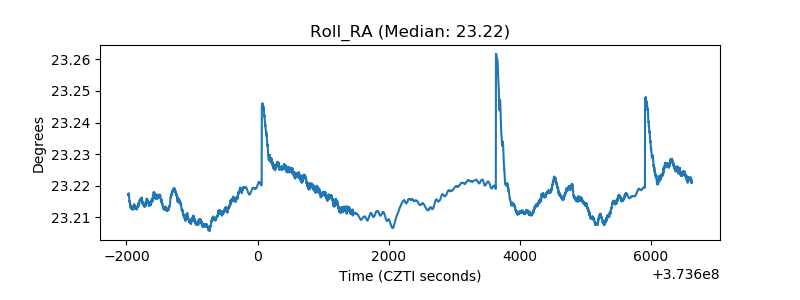 |
| Veto Counter | 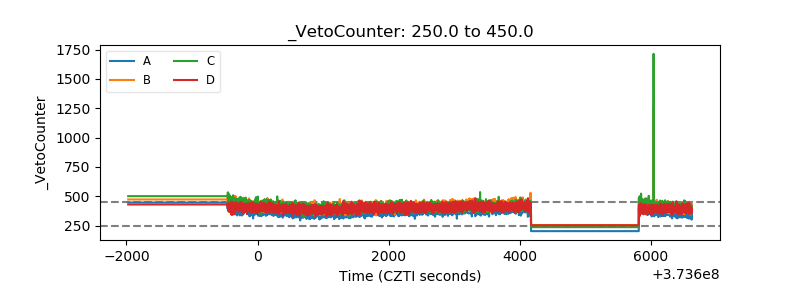 |