| Param | Original file | Final file |
|---|---|---|
| Filename | modeM0/AS1C07_003T01_9000004754_32980cztM0_level2.evt | modeM0/AS1C07_003T01_9000004754_32980cztM0_level2_quad_clean.evt |
| Size (bytes) | 486,616,320 | 73,975,680 |
| Size | 464.1 MB | 70.5 MB |
| Events in quadrant A | 3,087,643 | 445,717 |
| Events in quadrant B | 3,771,886 | 453,025 |
| Events in quadrant C | 3,446,384 | 444,728 |
| Events in quadrant D | 3,973,276 | 426,420 |
| Mode SS | |||
|---|---|---|---|
| Quadrant | BADHDUFLAG | Total packets | Discarded packets |
| A | 0 | 140 | 0 |
| B | 0 | 140 | 0 |
| C | 0 | 140 | 2 |
| D | 0 | 140 | 0 |
| Mode M9 | |||
|---|---|---|---|
| Quadrant | BADHDUFLAG | Total packets | Discarded packets |
| A | 0 | 27 | 0 |
| B | 0 | 27 | 0 |
| C | 0 | 27 | 0 |
| D | 0 | 27 | 0 |
| Mode M0 | |||
|---|---|---|---|
| Quadrant | BADHDUFLAG | Total packets | Discarded packets |
| A | 0 | 13623 | 50 |
| B | 0 | 15547 | 87 |
| C | 0 | 14530 | 84 |
| D | 0 | 16020 | 58 |
| Quadrant | Total seconds | Saturated seconds | Saturation percentage |
|---|---|---|---|
| A | 6747 | 13 | 0.192678% |
| B | 6737 | 210 | 3.117114% |
| C | 6735 | 89 | 1.321455% |
| D | 6749 | 64 | 0.948289% |
Noise dominated data is calculated using 1-second bins in cleaned event files. If a bin has >2000 counts, and if more than 50% of those come from <1% of pixels, then it is considered to be noise-dominated and hence unusable.
| Quadrant | # 1 sec bins | Bins with >0 counts | Bins with >2000 counts | High rate bins dominated by noise | Noise dominated (total time) | Noise dominated (detector-on time) | Marked lightcurve |
|---|---|---|---|---|---|---|---|
| A | 9456 | 6773 | 1 | 1 | 0.01% | 0.01% | 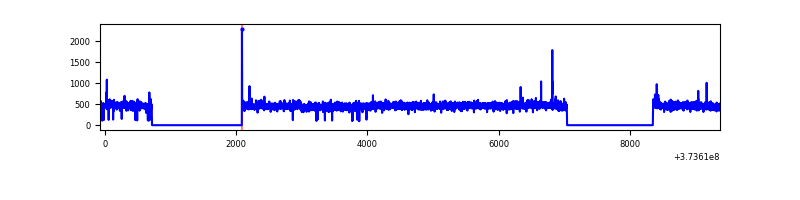 |
| B | 9456 | 6772 | 127 | 127 | 1.34% | 1.88% | 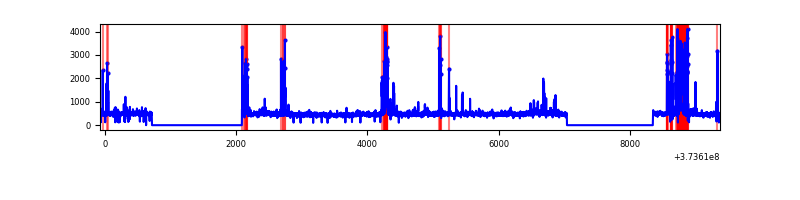 |
| C | 9456 | 6773 | 62 | 62 | 0.66% | 0.92% | 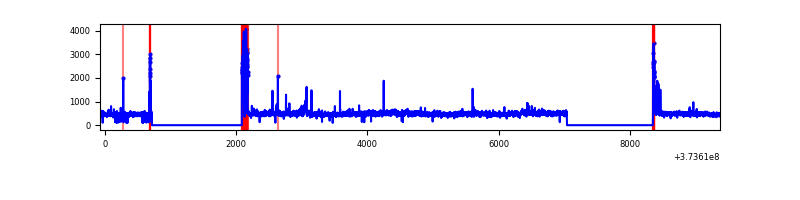 |
| D | 9455 | 6772 | 48 | 48 | 0.51% | 0.71% |  |
Top three noisy pixels from each quadrant. If the there are fewer than three noisy pixels in the level2.evt file, extra rows are filled as -1
| Pixel properties | Quadrant properties | ||||||
|---|---|---|---|---|---|---|---|
| Quadrant | DetID | PixID | Counts | Sigma | Mean | Median | Sigma |
| A | 9 | 143 | 13637 | 80.72 | 787 | 769 | 159.4 |
| A | 12 | 227 | 13414 | 79.32 | 787 | 769 | 159.4 |
| A | 13 | 6 | 12409 | 73.01 | 787 | 769 | 159.4 |
| B | 5 | 172 | 511186 | 3393.55 | 779 | 757 | 150.4 |
| B | 0 | 197 | 77085 | 507.46 | 779 | 757 | 150.4 |
| B | 5 | 200 | 36712 | 239.04 | 779 | 757 | 150.4 |
| C | 0 | 10 | 254088 | 1431.03 | 762 | 767 | 177.0 |
| C | 14 | 67 | 122242 | 686.22 | 762 | 767 | 177.0 |
| C | 8 | 79 | 26932 | 147.81 | 762 | 767 | 177.0 |
| D | 8 | 195 | 600519 | 3008.86 | 756 | 740 | 199.3 |
| D | 2 | 250 | 179004 | 894.28 | 756 | 740 | 199.3 |
| D | 12 | 33 | 60849 | 301.54 | 756 | 740 | 199.3 |
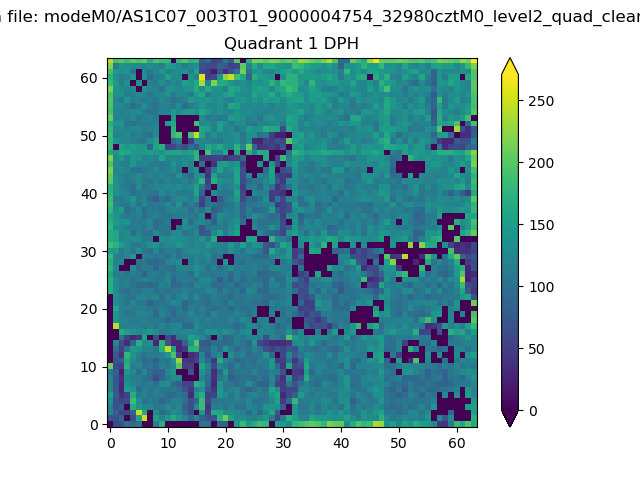
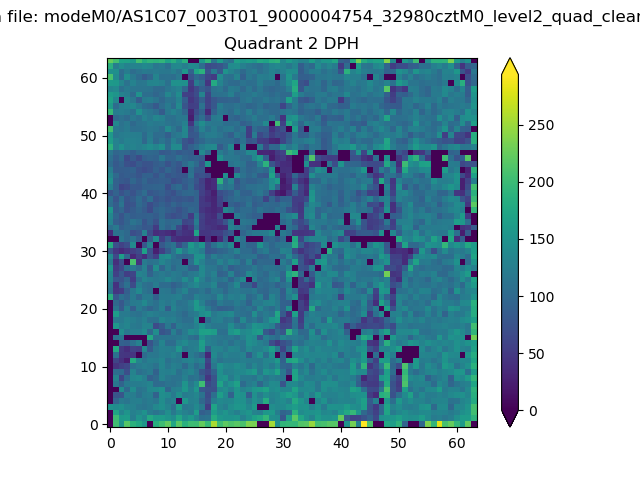
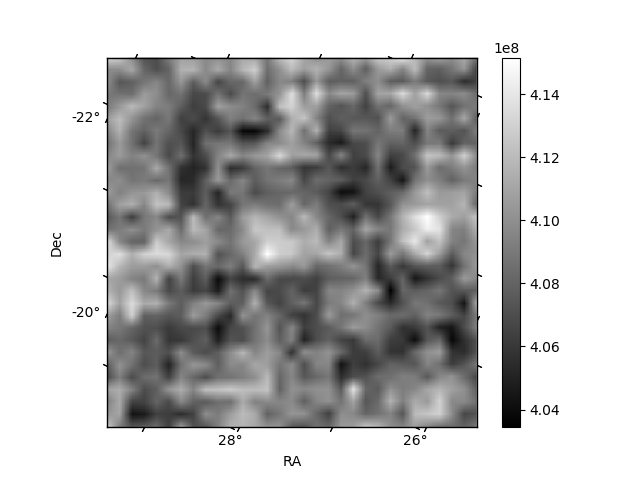
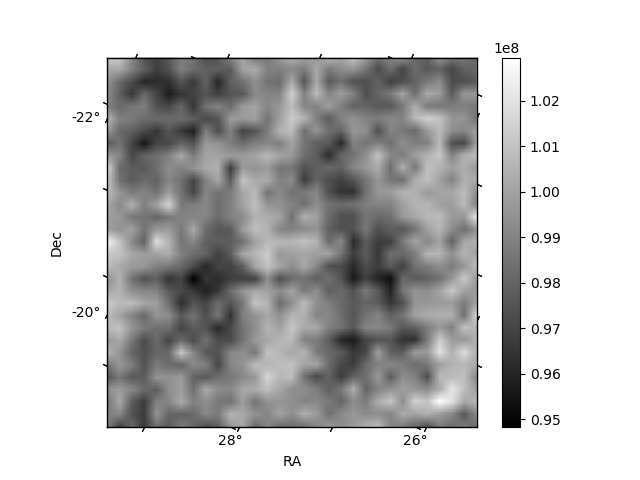
Histogram calculated using DETX and DETY for each event in the final _common_clean file
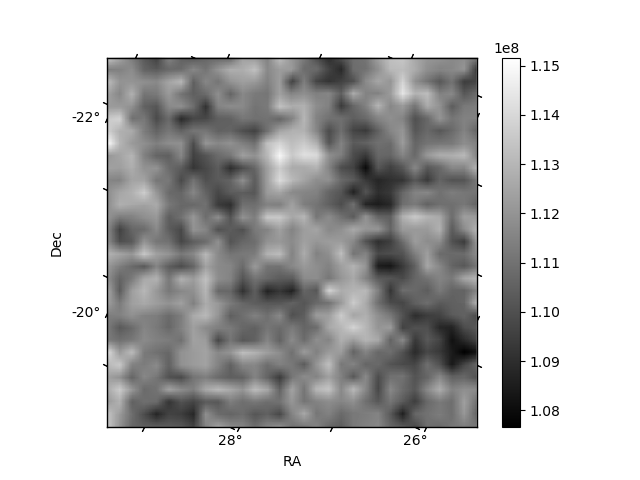
| Quadrant A | 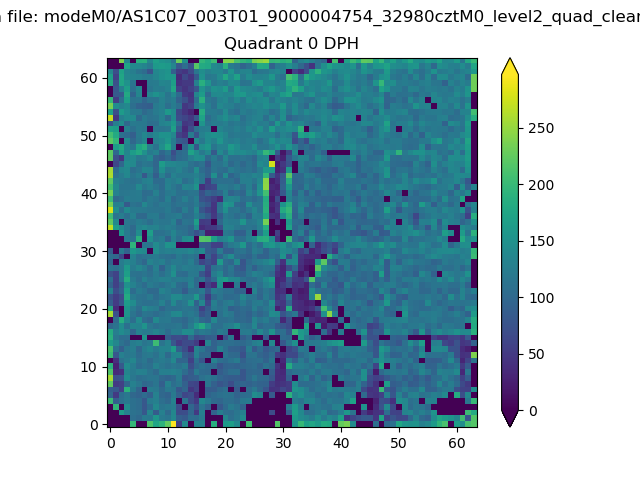 |
 |
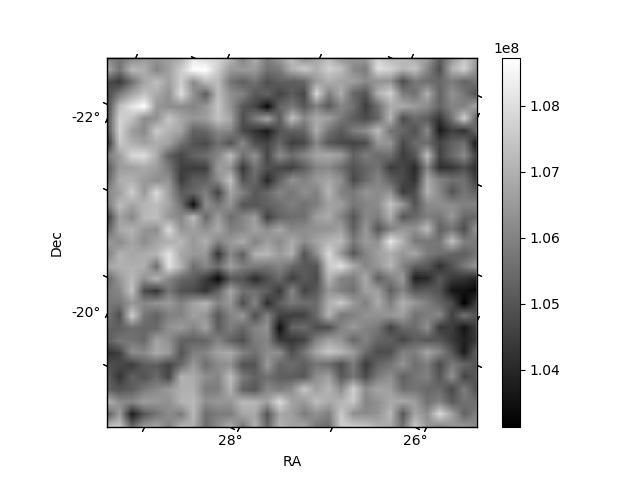
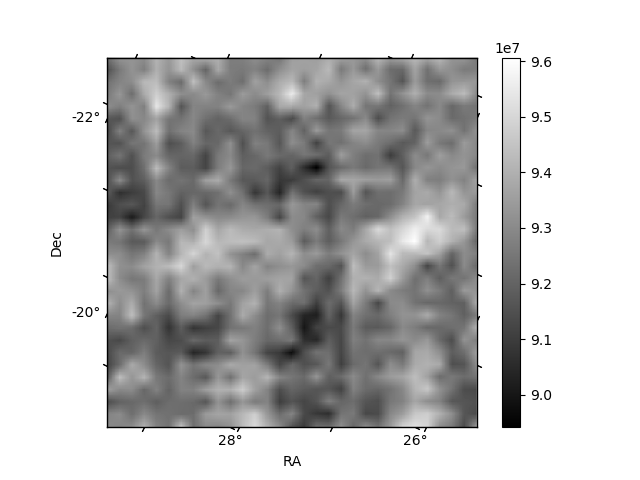
Quadrant B |
|---|---|---|---|
| Quadrant D | 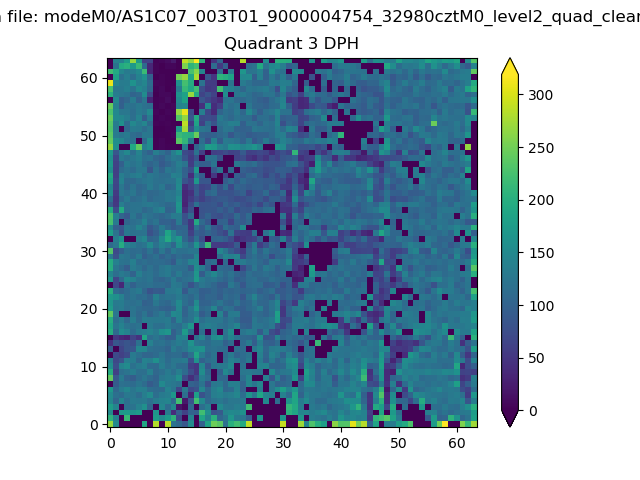 |
 |
Quadrant C |
| Plot type | Count rate plots | Images |
|---|---|---|
| Comparison with Poisson distribution Blue bars denote a histogram of data divided into 1 sec bins. Red curve is a Poisson curve with rate = median count rate of data. |
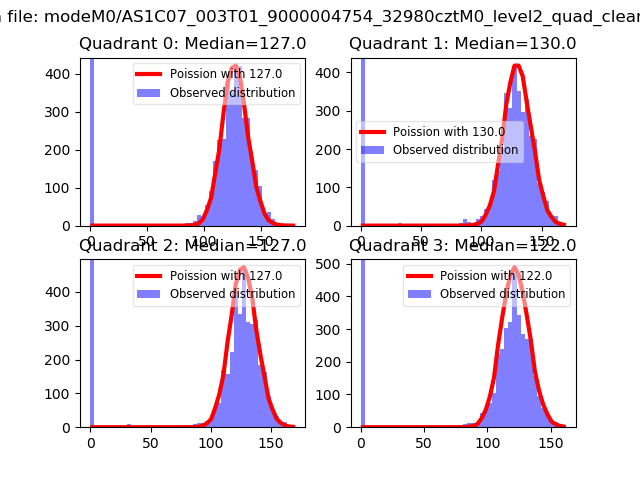 |
 |
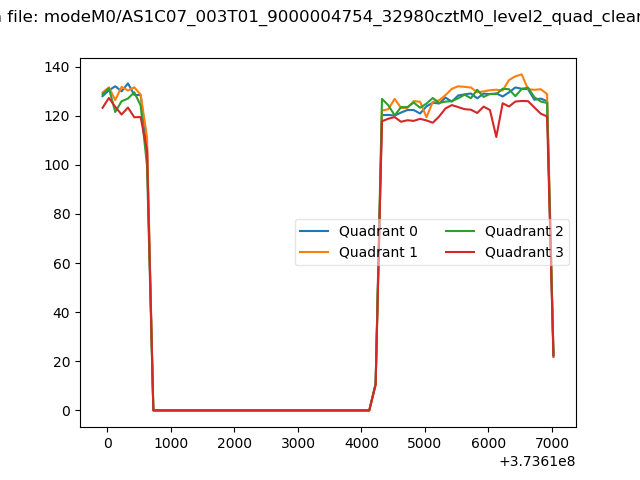
| Quadrant-wise count rates Data is divided into 100 sec bins |
 |
|
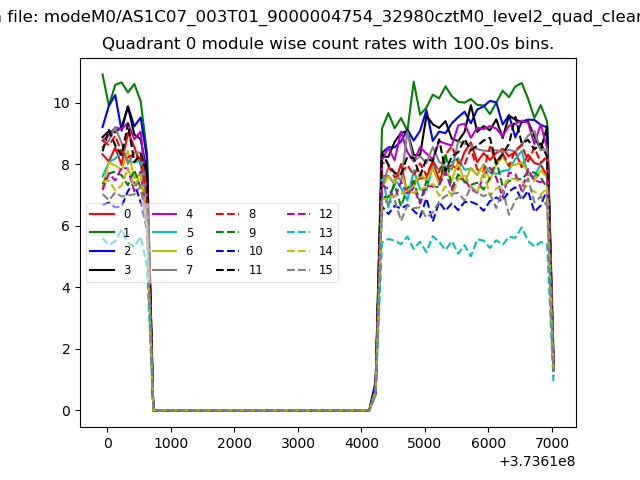
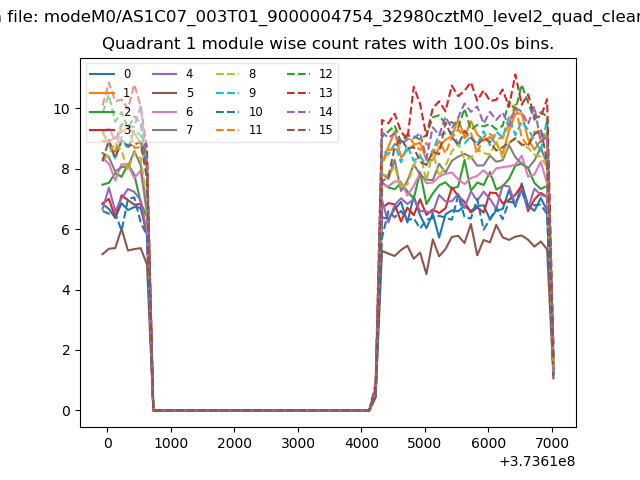
| Module-wise count rates for Quadrant A Data is divided into 100 sec bins |
 |
 |
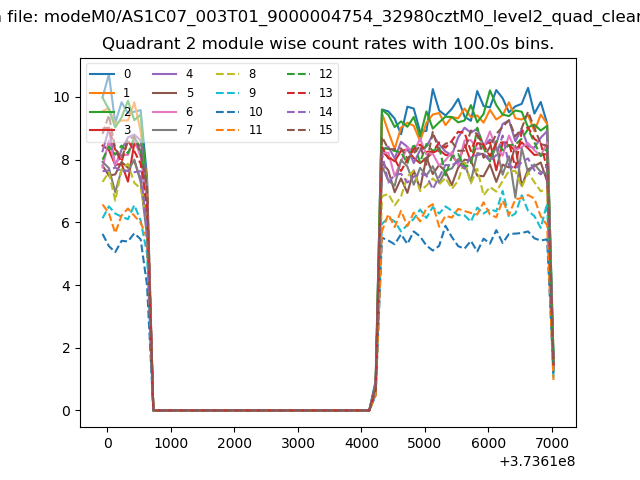
| Module-wise count rates for Quadrant B Data is divided into 100 sec bins |
 |
 |
| Module-wise count rates for Quadrant C Data is divided into 100 sec bins |
 |
 |
| Module-wise count rates for Quadrant D Data is divided into 100 sec bins |
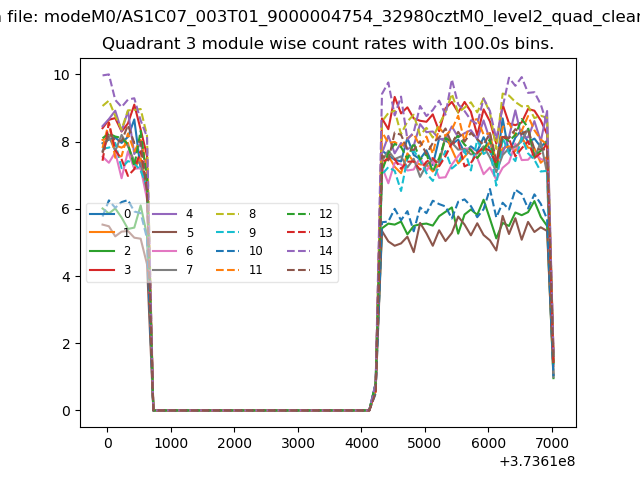 |
 |
| Parameter | Plot |
|---|---|
| CZT HV Monitor | 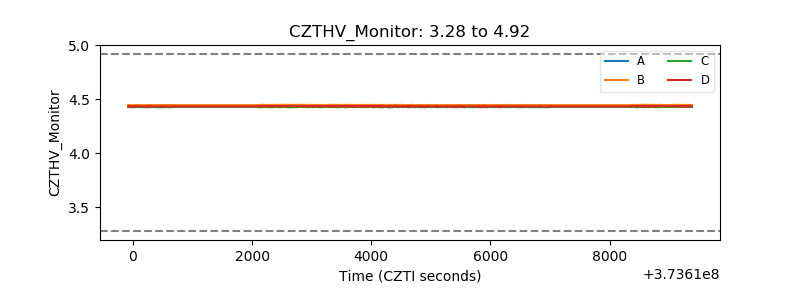 |
| D_VDD | 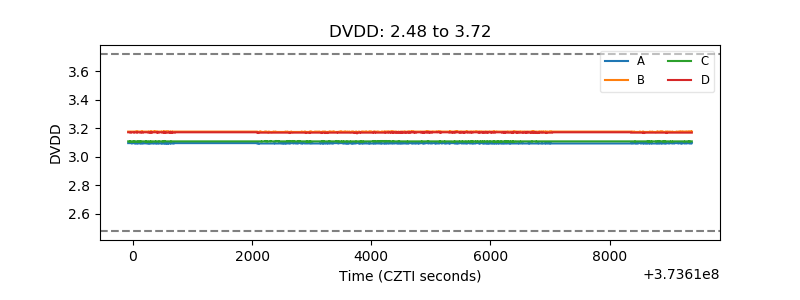 |
| Temperature 1 | 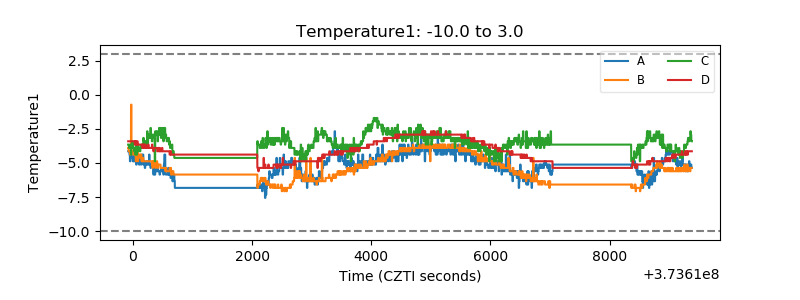 |
| Veto HV Monitor | 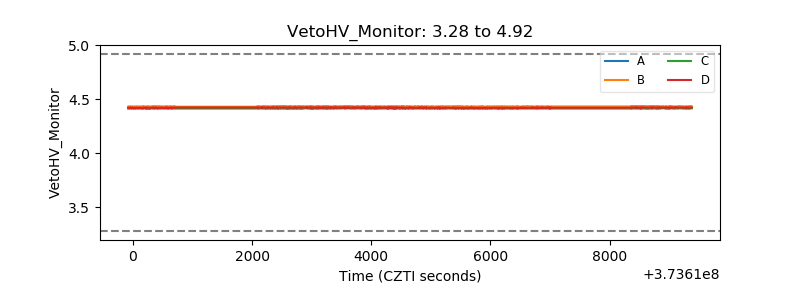 |
| Veto LLD | 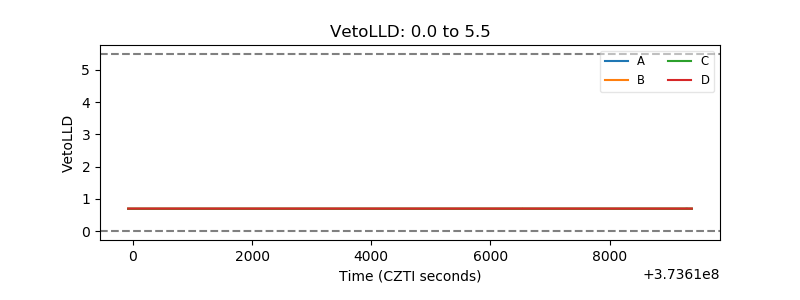 |
| Alpha Counter | 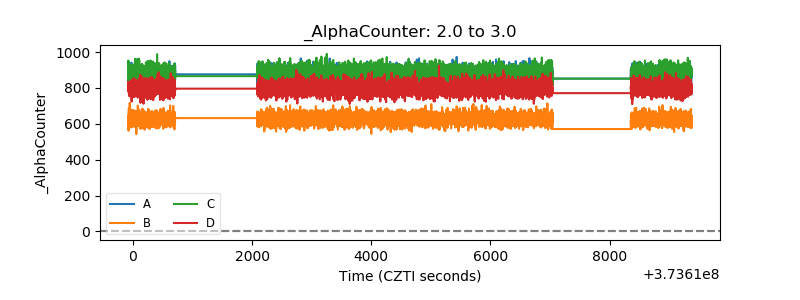 |
| _CPM_Rate | 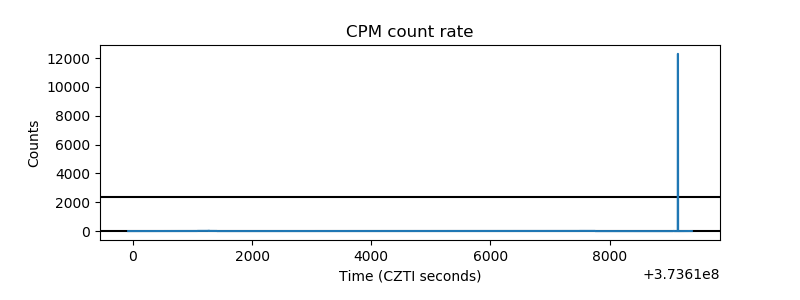 |
| CZT Counter | 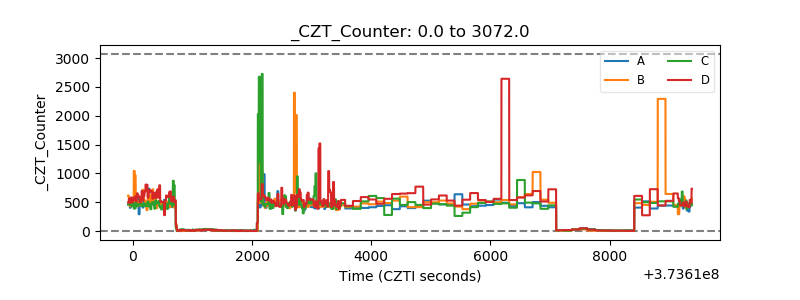 |
| +2.5 Volts monitor |  |
| +5 Volts monitor |  |
| _ROLL_ROT | 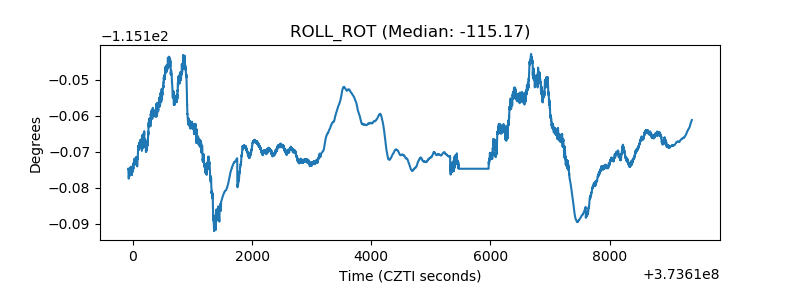 |
| _Roll_DEC | 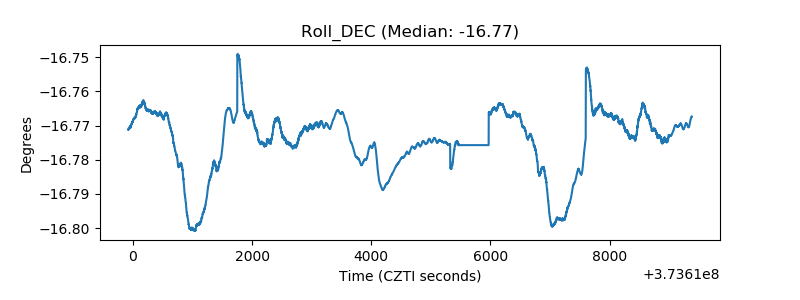 |
| _Roll_RA | 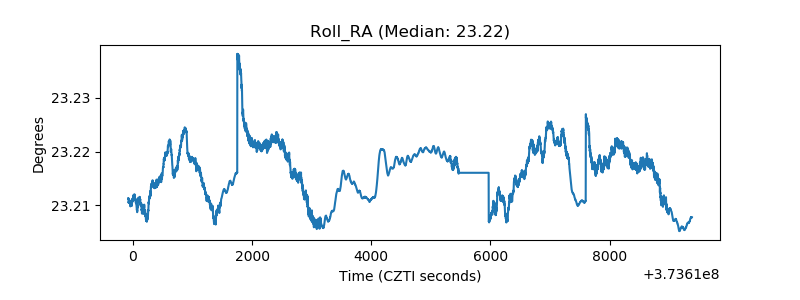 |
| Veto Counter | 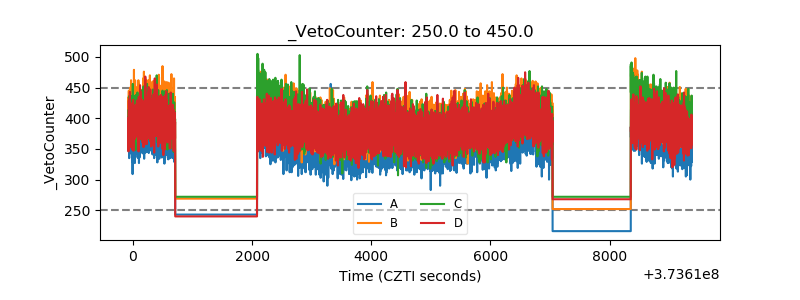 |