| Param | Original file | Final file |
|---|---|---|
| Filename | modeM0/AS1C07_003T01_9000004754_32982cztM0_level2.evt | modeM0/AS1C07_003T01_9000004754_32982cztM0_level2_quad_clean.evt |
| Size (bytes) | 684,679,680 | 129,778,560 |
| Size | 653.0 MB | 123.8 MB |
| Events in quadrant A | 4,409,608 | 820,560 |
| Events in quadrant B | 5,164,477 | 831,706 |
| Events in quadrant C | 4,625,137 | 819,720 |
| Events in quadrant D | 5,874,484 | 781,497 |
| Mode SS | |||
|---|---|---|---|
| Quadrant | BADHDUFLAG | Total packets | Discarded packets |
| A | 0 | 200 | 0 |
| B | 0 | 200 | 0 |
| C | 0 | 200 | 0 |
| D | 0 | 200 | 0 |
| Mode M9 | |||
|---|---|---|---|
| Quadrant | BADHDUFLAG | Total packets | Discarded packets |
| A | 0 | 22 | 0 |
| B | 0 | 21 | 0 |
| C | 0 | 21 | 0 |
| D | 0 | 22 | 0 |
| Mode M0 | |||
|---|---|---|---|
| Quadrant | BADHDUFLAG | Total packets | Discarded packets |
| A | 0 | 19614 | 2 |
| B | 0 | 21611 | 2 |
| C | 0 | 20239 | 2 |
| D | 0 | 23652 | 2 |
| Quadrant | Total seconds | Saturated seconds | Saturation percentage |
|---|---|---|---|
| A | 9765 | 10 | 0.102407% |
| B | 9765 | 189 | 1.935484% |
| C | 9765 | 85 | 0.870456% |
| D | 9765 | 62 | 0.634921% |
Noise dominated data is calculated using 1-second bins in cleaned event files. If a bin has >2000 counts, and if more than 50% of those come from <1% of pixels, then it is considered to be noise-dominated and hence unusable.
| Quadrant | # 1 sec bins | Bins with >0 counts | Bins with >2000 counts | High rate bins dominated by noise | Noise dominated (total time) | Noise dominated (detector-on time) | Marked lightcurve |
|---|---|---|---|---|---|---|---|
| A | 11108 | 9765 | 0 | 0 | 0.00% | 0.00% | 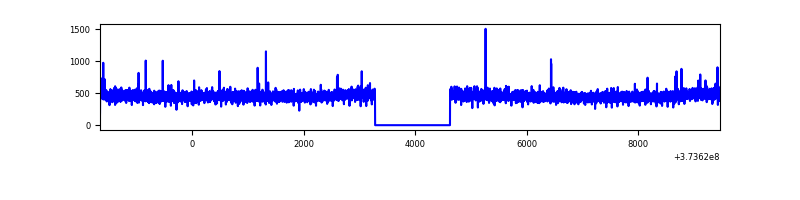 |
| B | 11108 | 9765 | 125 | 125 | 1.13% | 1.28% | 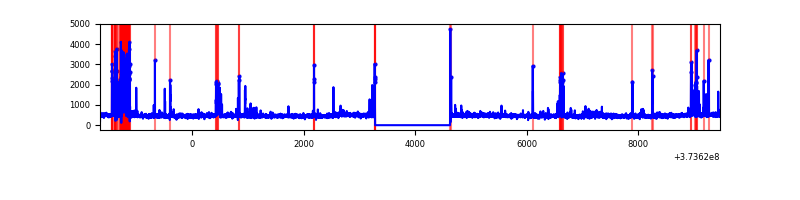 |
| C | 11108 | 9765 | 55 | 55 | 0.50% | 0.56% | 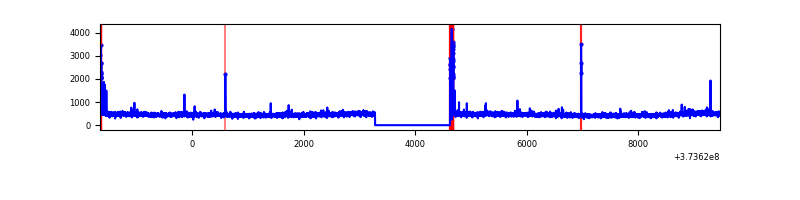 |
| D | 11108 | 9765 | 41 | 41 | 0.37% | 0.42% | 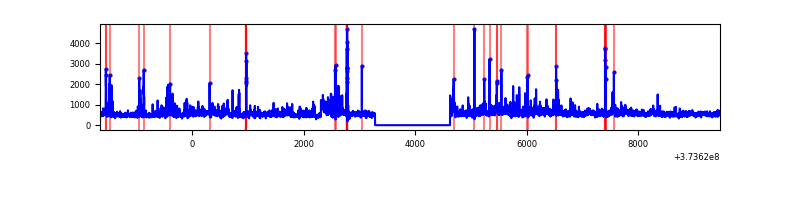 |
Top three noisy pixels from each quadrant. If the there are fewer than three noisy pixels in the level2.evt file, extra rows are filled as -1
| Pixel properties | Quadrant properties | ||||||
|---|---|---|---|---|---|---|---|
| Quadrant | DetID | PixID | Counts | Sigma | Mean | Median | Sigma |
| A | 9 | 143 | 24710 | 102.76 | 1131 | 1106 | 229.7 |
| A | 13 | 254 | 16901 | 68.76 | 1131 | 1106 | 229.7 |
| A | 3 | 137 | 10958 | 42.89 | 1131 | 1106 | 229.7 |
| B | 5 | 172 | 522151 | 2396.34 | 1126 | 1099 | 217.4 |
| B | 10 | 244 | 69594 | 315.01 | 1126 | 1099 | 217.4 |
| B | 0 | 197 | 60603 | 273.66 | 1126 | 1099 | 217.4 |
| C | 0 | 10 | 218127 | 849.79 | 1096 | 1101 | 255.4 |
| C | 14 | 67 | 50671 | 194.1 | 1096 | 1101 | 255.4 |
| C | 9 | 54 | 26657 | 100.07 | 1096 | 1101 | 255.4 |
| D | 8 | 195 | 790258 | 2775.94 | 1083 | 1058 | 284.3 |
| D | 2 | 250 | 325621 | 1141.62 | 1083 | 1058 | 284.3 |
| D | 12 | 227 | 147190 | 514.01 | 1083 | 1058 | 284.3 |
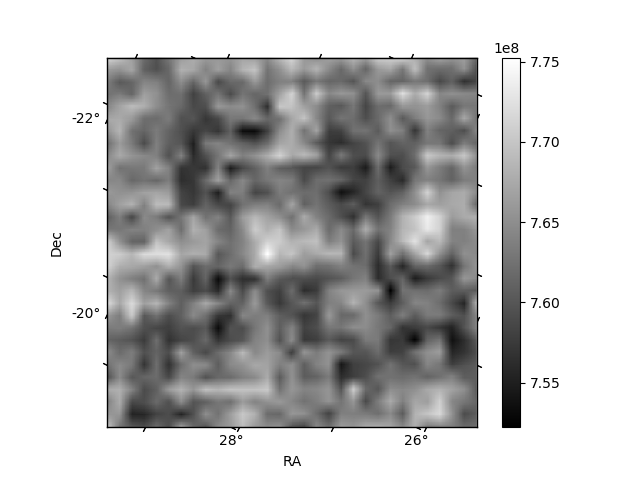
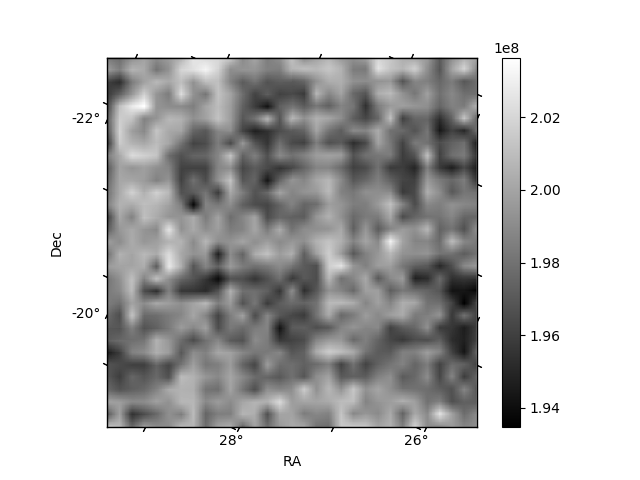
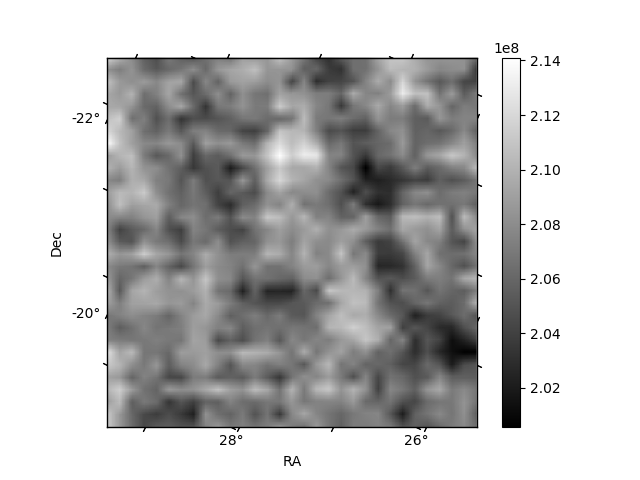
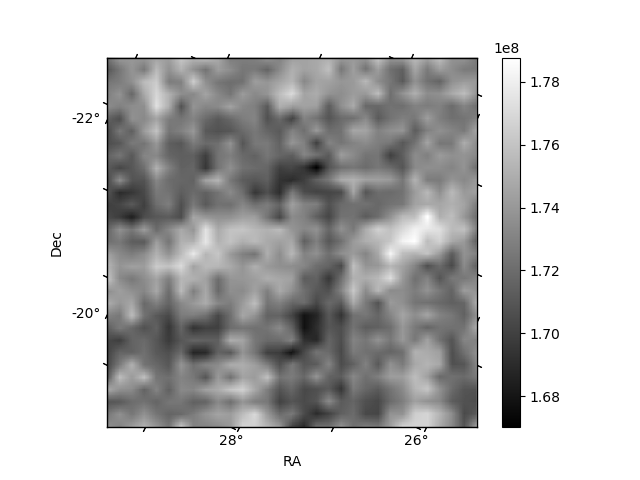
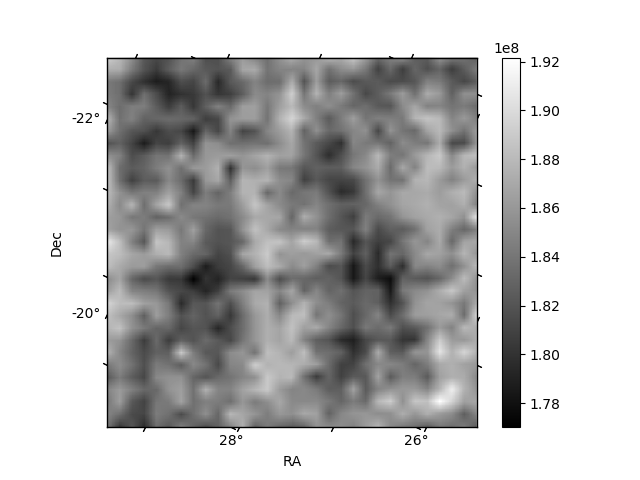
Histogram calculated using DETX and DETY for each event in the final _common_clean file
| Quadrant A | 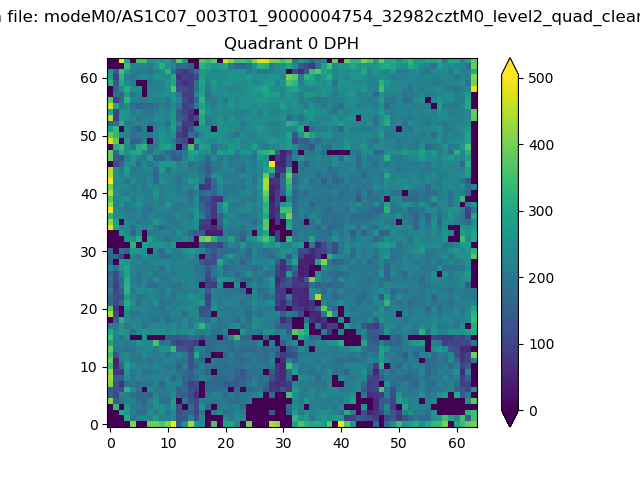 |
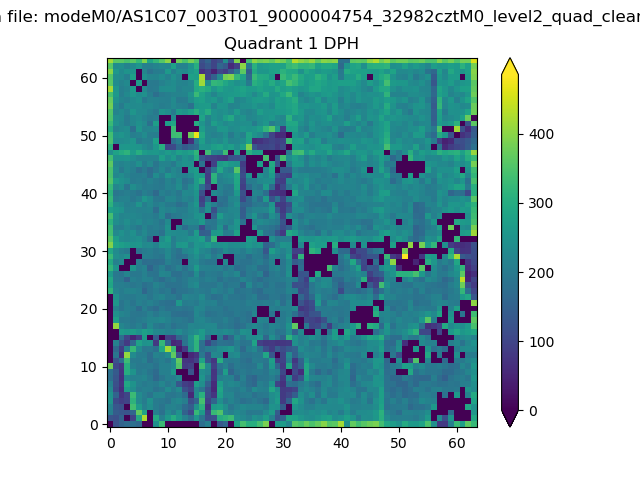 |
Quadrant B |
|---|---|---|---|
| Quadrant D | 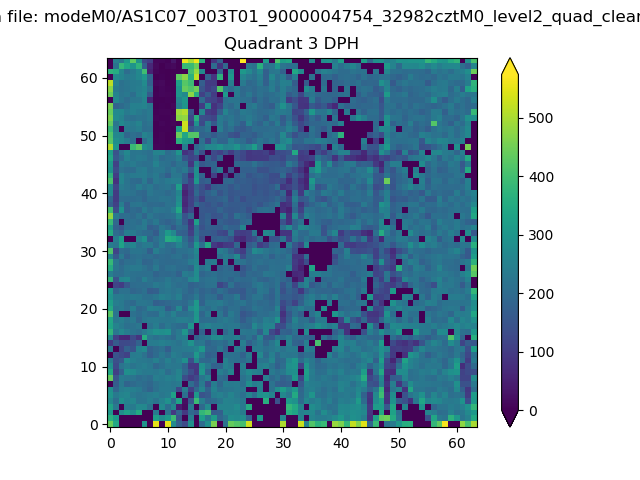 |
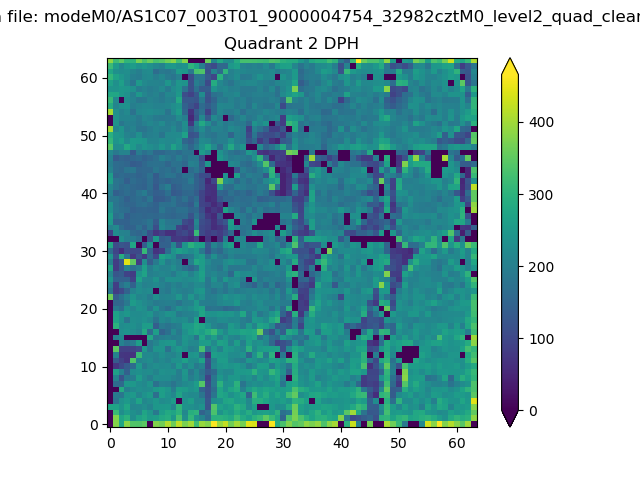 |
Quadrant C |
| Plot type | Count rate plots | Images |
|---|---|---|
| Comparison with Poisson distribution Blue bars denote a histogram of data divided into 1 sec bins. Red curve is a Poisson curve with rate = median count rate of data. |
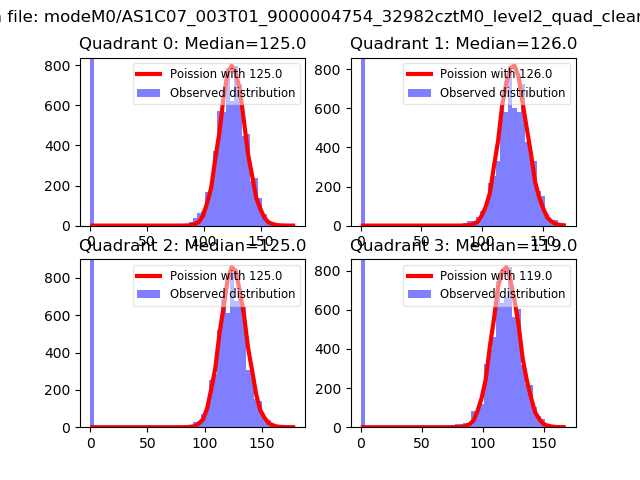 |
 |
| Quadrant-wise count rates Data is divided into 100 sec bins |
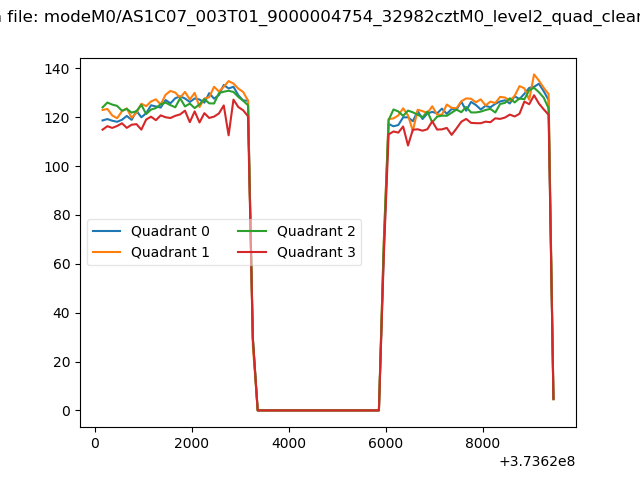 |
|
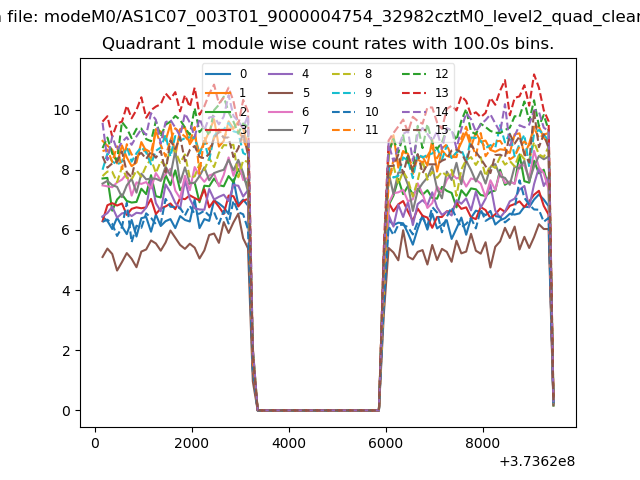
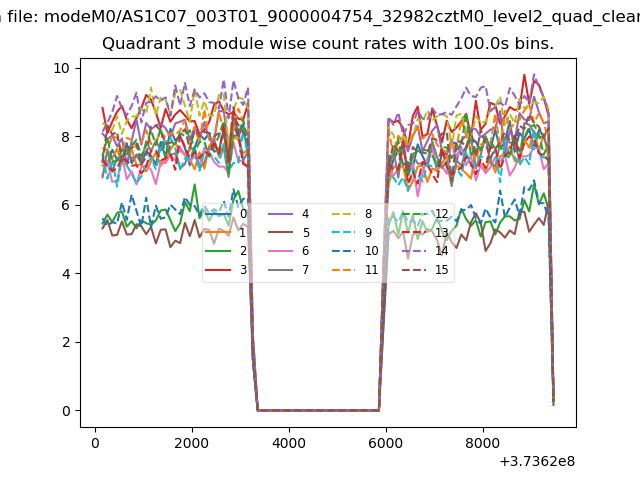
| Module-wise count rates for Quadrant A Data is divided into 100 sec bins |
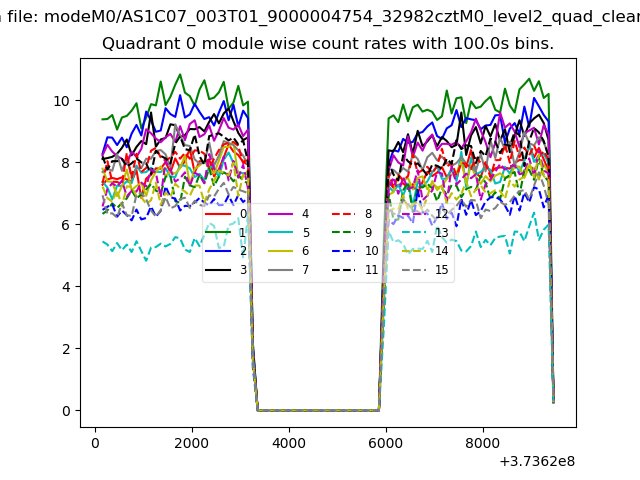 |
 |
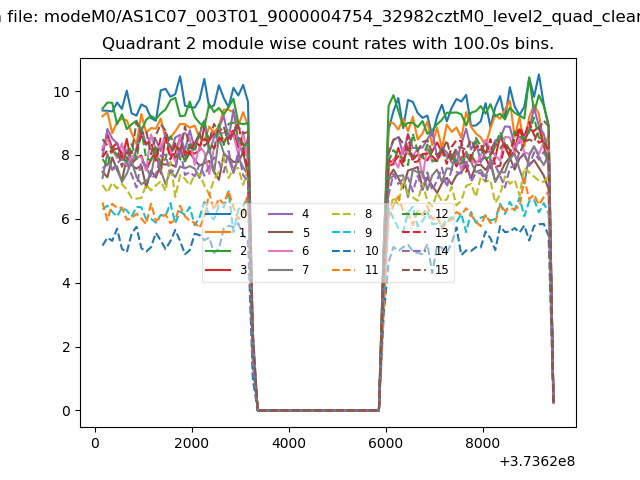
| Module-wise count rates for Quadrant B Data is divided into 100 sec bins |
 |
 |
| Module-wise count rates for Quadrant C Data is divided into 100 sec bins |
 |
 |
| Module-wise count rates for Quadrant D Data is divided into 100 sec bins |
 |
 |
| Parameter | Plot |
|---|---|
| CZT HV Monitor | 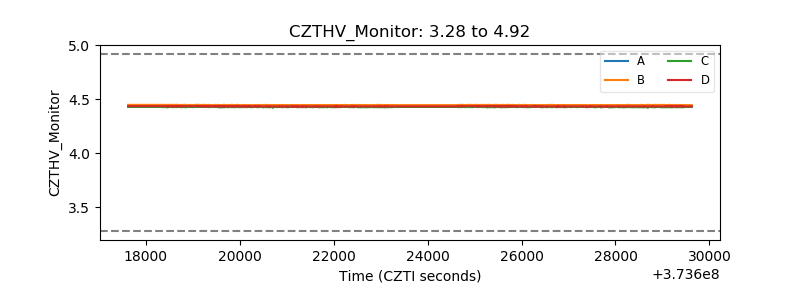 |
| D_VDD | 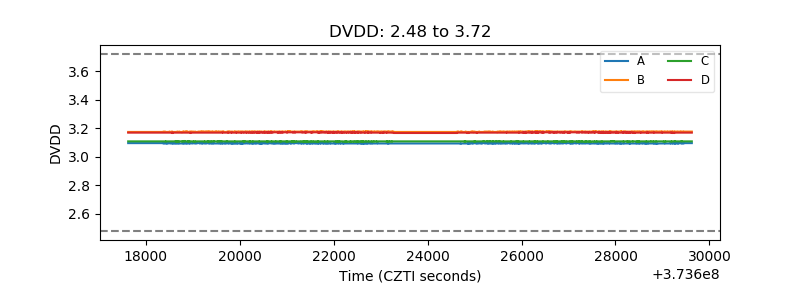 |
| Temperature 1 | 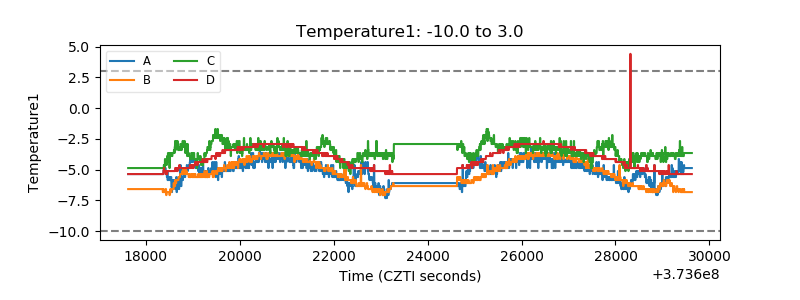 |
| Veto HV Monitor | 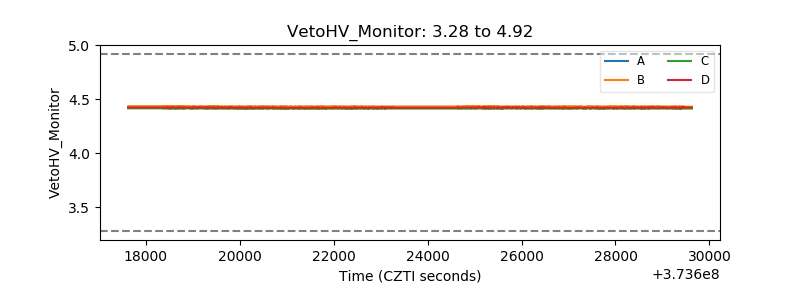 |
| Veto LLD | 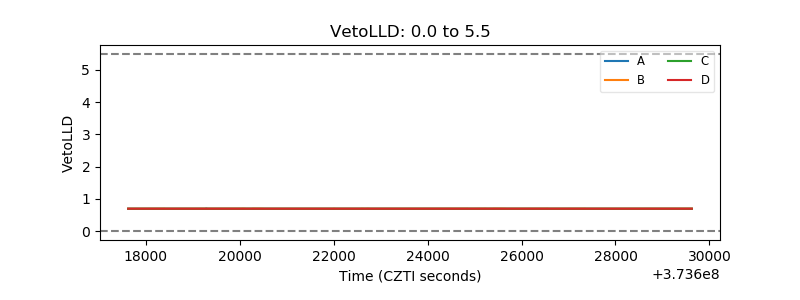 |
| Alpha Counter | 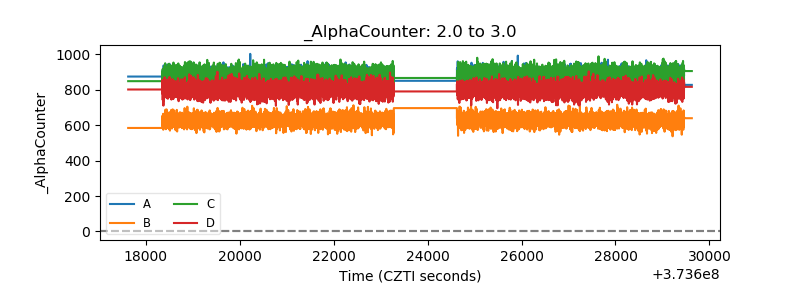 |
| _CPM_Rate | 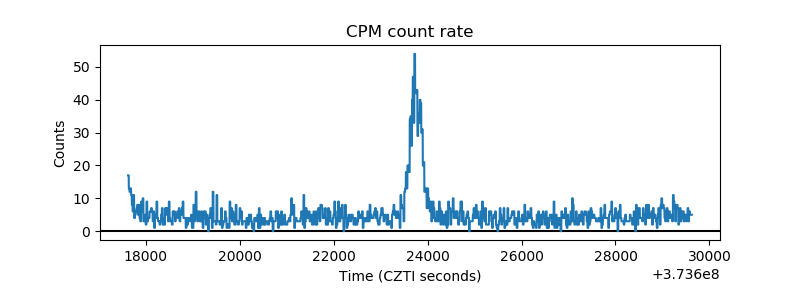 |
| CZT Counter | 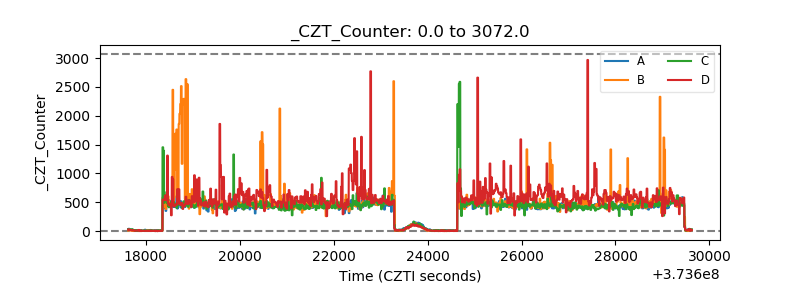 |
| +2.5 Volts monitor |  |
| +5 Volts monitor |  |
| _ROLL_ROT | 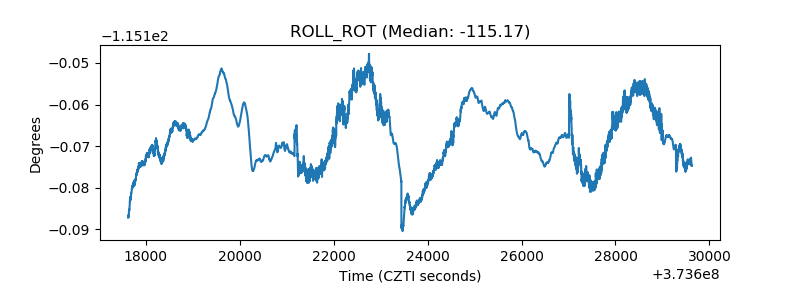 |
| _Roll_DEC | 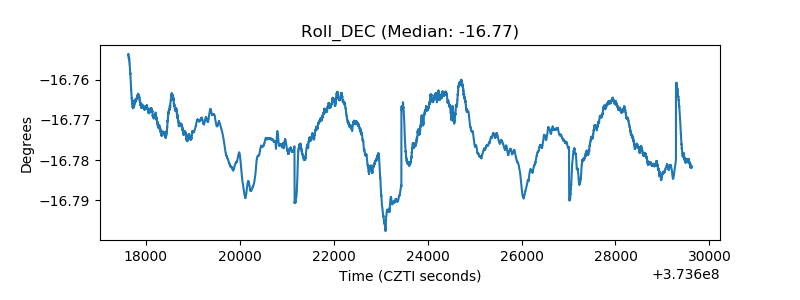 |
| _Roll_RA | 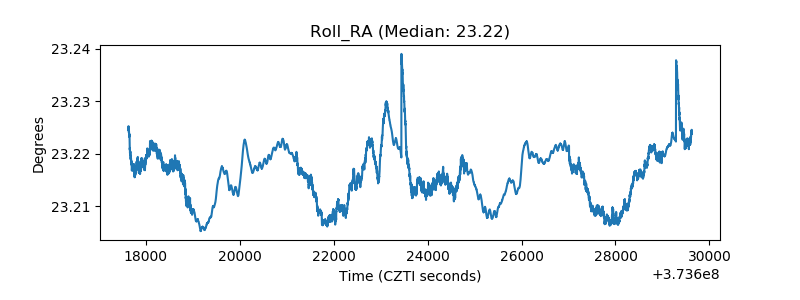 |
| Veto Counter | 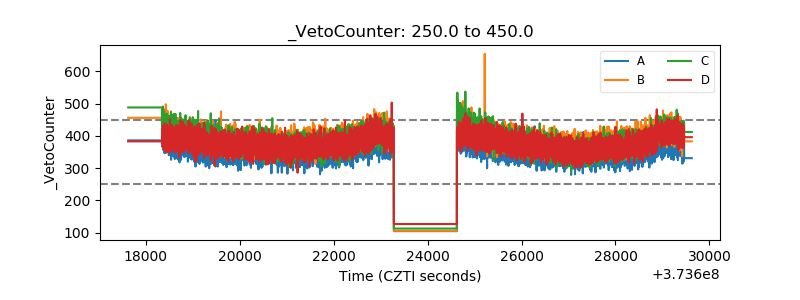 |