| Param | Original file | Final file |
|---|---|---|
| Filename | modeM0/AS1C07_003T01_9000004754_32984cztM0_level2.evt | modeM0/AS1C07_003T01_9000004754_32984cztM0_level2_quad_clean.evt |
| Size (bytes) | 440,527,680 | 90,311,040 |
| Size | 420.1 MB | 86.1 MB |
| Events in quadrant A | 2,771,791 | 590,598 |
| Events in quadrant B | 3,544,816 | 591,054 |
| Events in quadrant C | 2,924,198 | 584,547 |
| Events in quadrant D | 3,699,043 | 555,836 |
| Mode SS | |||
|---|---|---|---|
| Quadrant | BADHDUFLAG | Total packets | Discarded packets |
| A | 0 | 122 | 0 |
| B | 0 | 122 | 0 |
| C | 0 | 122 | 0 |
| D | 0 | 122 | 0 |
| Mode M9 | |||
|---|---|---|---|
| Quadrant | BADHDUFLAG | Total packets | Discarded packets |
| A | 0 | 32 | 0 |
| B | 0 | 32 | 0 |
| C | 0 | 32 | 0 |
| D | 0 | 32 | 0 |
| Mode M0 | |||
|---|---|---|---|
| Quadrant | BADHDUFLAG | Total packets | Discarded packets |
| A | 0 | 12011 | 3 |
| B | 0 | 14223 | 2 |
| C | 0 | 12556 | 2 |
| D | 0 | 14860 | 2 |
| Quadrant | Total seconds | Saturated seconds | Saturation percentage |
|---|---|---|---|
| A | 5911 | 8 | 0.135341% |
| B | 5911 | 263 | 4.449332% |
| C | 5911 | 75 | 1.268821% |
| D | 5911 | 64 | 1.082727% |
Noise dominated data is calculated using 1-second bins in cleaned event files. If a bin has >2000 counts, and if more than 50% of those come from <1% of pixels, then it is considered to be noise-dominated and hence unusable.
| Quadrant | # 1 sec bins | Bins with >0 counts | Bins with >2000 counts | High rate bins dominated by noise | Noise dominated (total time) | Noise dominated (detector-on time) | Marked lightcurve |
|---|---|---|---|---|---|---|---|
| A | 9106 | 5913 | 2 | 2 | 0.02% | 0.03% | 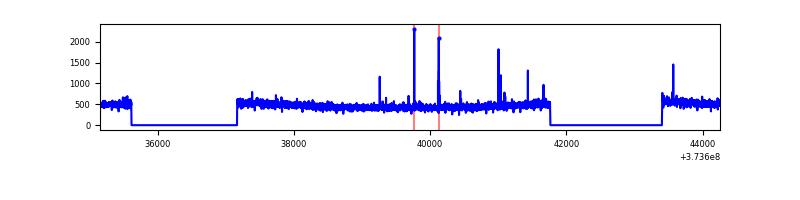 |
| B | 9106 | 5913 | 153 | 153 | 1.68% | 2.59% | 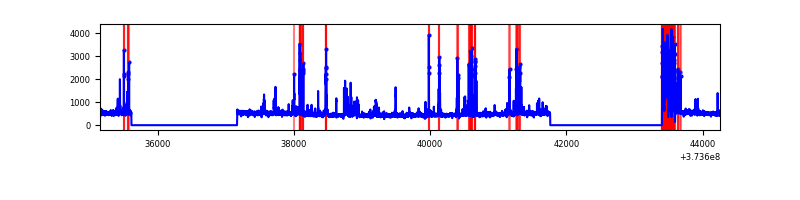 |
| C | 9106 | 5913 | 44 | 44 | 0.48% | 0.74% | 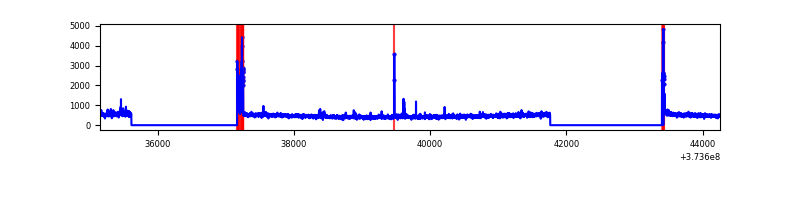 |
| D | 9106 | 5913 | 57 | 57 | 0.63% | 0.96% | 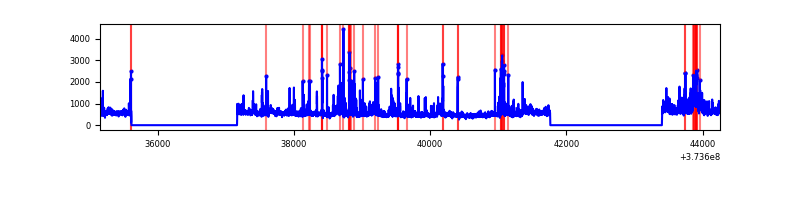 |
Top three noisy pixels from each quadrant. If the there are fewer than three noisy pixels in the level2.evt file, extra rows are filled as -1
| Pixel properties | Quadrant properties | ||||||
|---|---|---|---|---|---|---|---|
| Quadrant | DetID | PixID | Counts | Sigma | Mean | Median | Sigma |
| A | 9 | 143 | 18927 | 127.17 | 711 | 699 | 143.3 |
| A | 13 | 254 | 10365 | 67.44 | 711 | 699 | 143.3 |
| A | 3 | 137 | 6893 | 43.21 | 711 | 699 | 143.3 |
| B | 5 | 172 | 684420 | 5107.2 | 695 | 678 | 133.9 |
| B | 0 | 197 | 75864 | 561.6 | 695 | 678 | 133.9 |
| B | 12 | 111 | 16557 | 118.61 | 695 | 678 | 133.9 |
| C | 0 | 10 | 164773 | 1032.14 | 683 | 689 | 159.0 |
| C | 3 | 233 | 43607 | 269.97 | 683 | 689 | 159.0 |
| C | 9 | 54 | 19399 | 117.69 | 683 | 689 | 159.0 |
| D | 8 | 195 | 328421 | 1839.04 | 679 | 666 | 178.2 |
| D | 12 | 227 | 202053 | 1129.99 | 679 | 666 | 178.2 |
| D | 7 | 80 | 142465 | 795.64 | 679 | 666 | 178.2 |
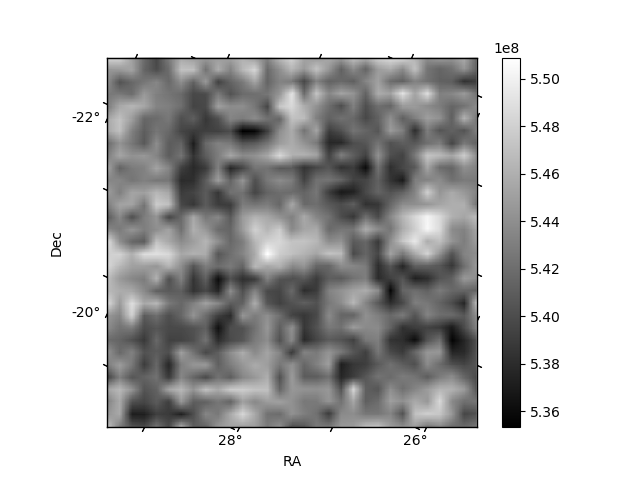
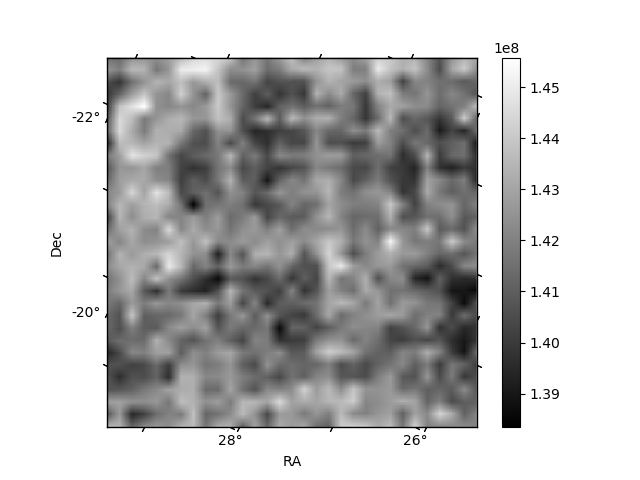
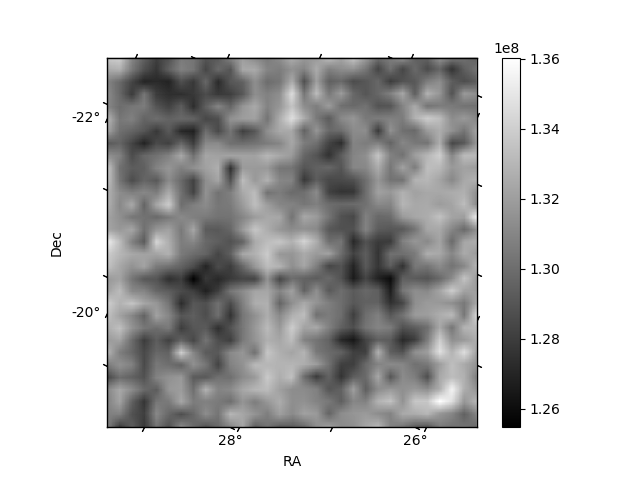
Histogram calculated using DETX and DETY for each event in the final _common_clean file
| Quadrant A | 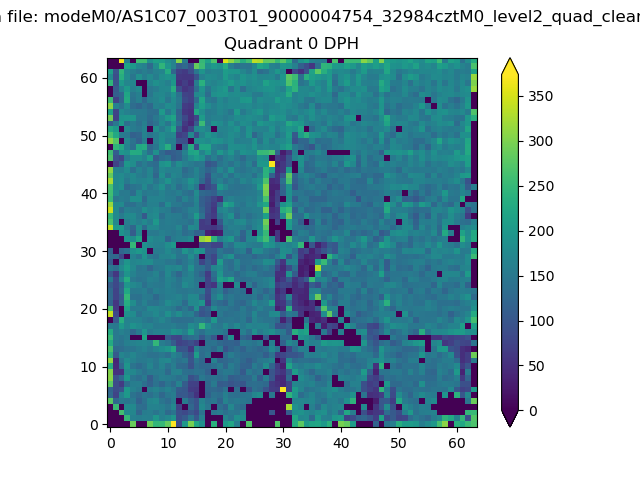 |
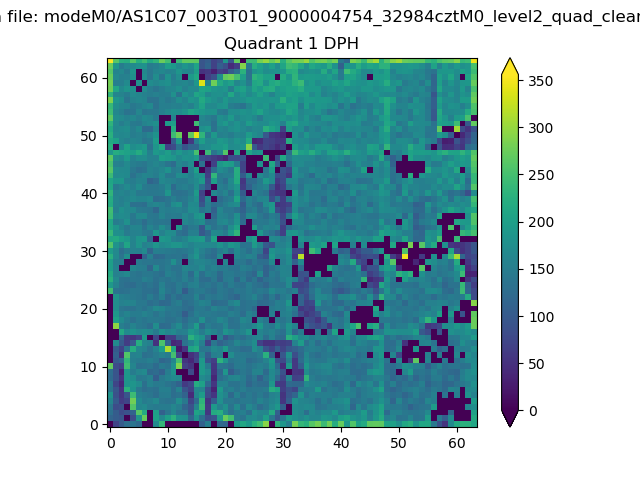 |
Quadrant B |
|---|---|---|---|
| Quadrant D | 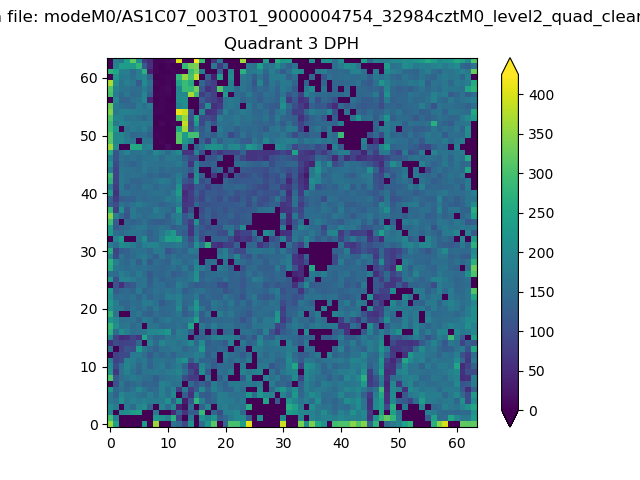 |
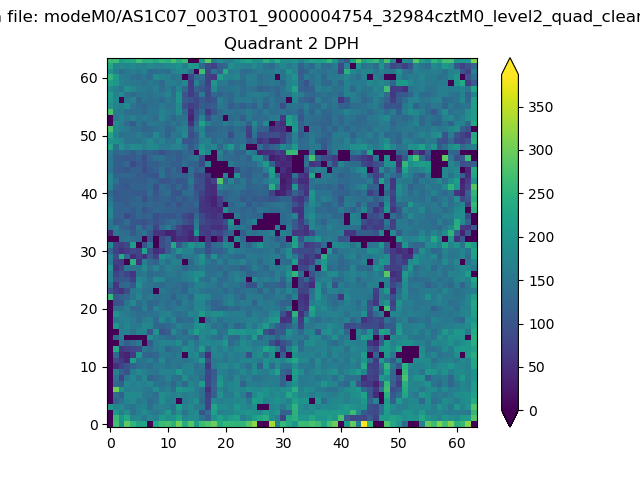 |
Quadrant C |
| Plot type | Count rate plots | Images |
|---|---|---|
| Comparison with Poisson distribution Blue bars denote a histogram of data divided into 1 sec bins. Red curve is a Poisson curve with rate = median count rate of data. |
 |
 |
| Quadrant-wise count rates Data is divided into 100 sec bins |
 |
|
| Module-wise count rates for Quadrant A Data is divided into 100 sec bins |
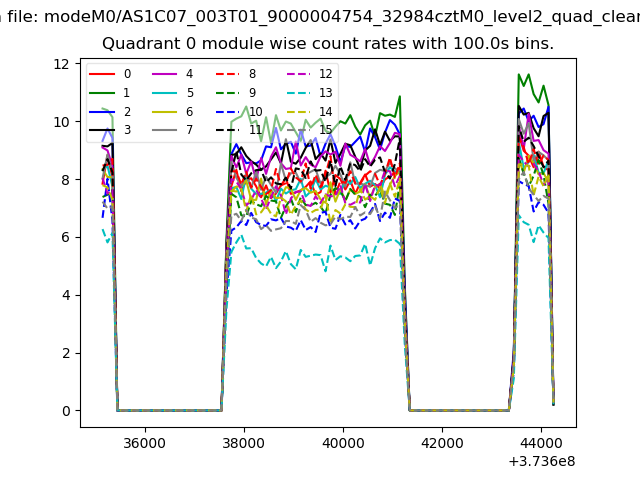 |
 |
| Module-wise count rates for Quadrant B Data is divided into 100 sec bins |
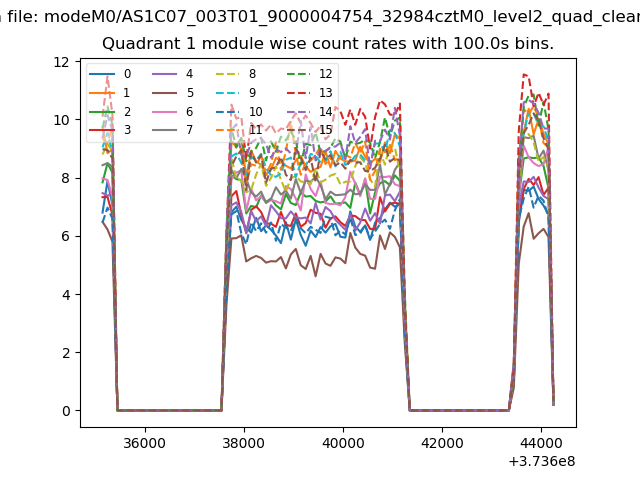 |
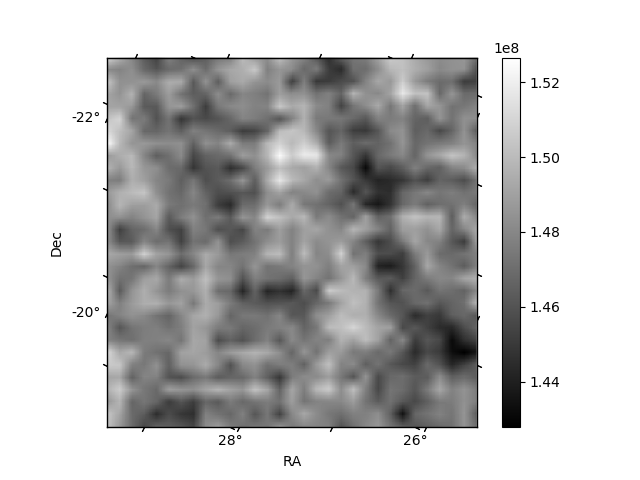 |
| Module-wise count rates for Quadrant C Data is divided into 100 sec bins |
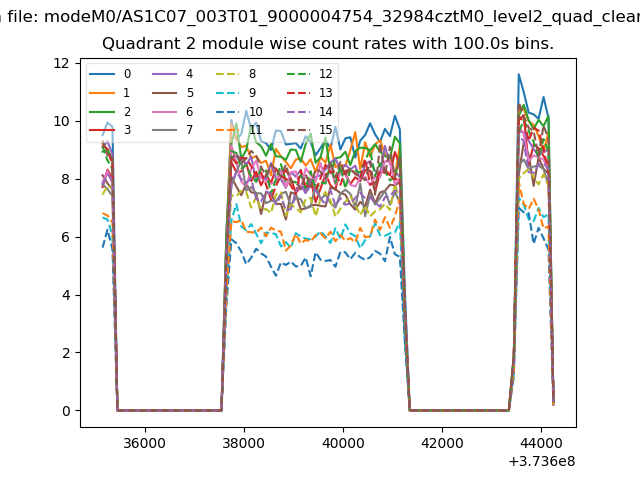 |
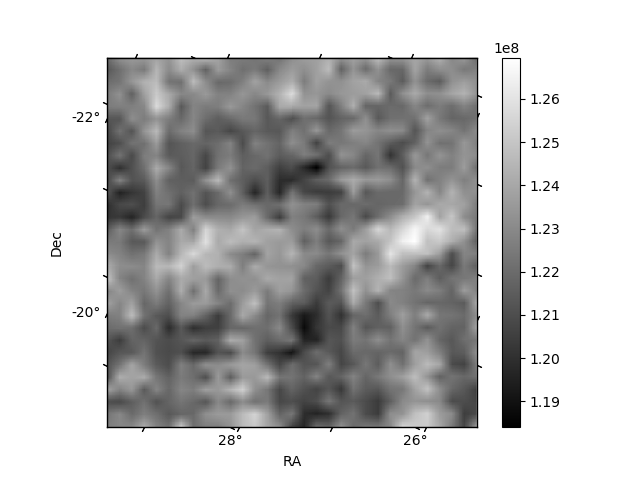 |
| Module-wise count rates for Quadrant D Data is divided into 100 sec bins |
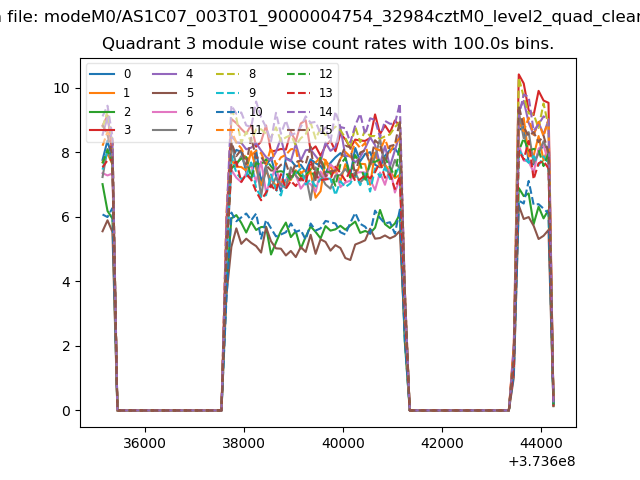 |
 |
| Parameter | Plot |
|---|---|
| CZT HV Monitor | 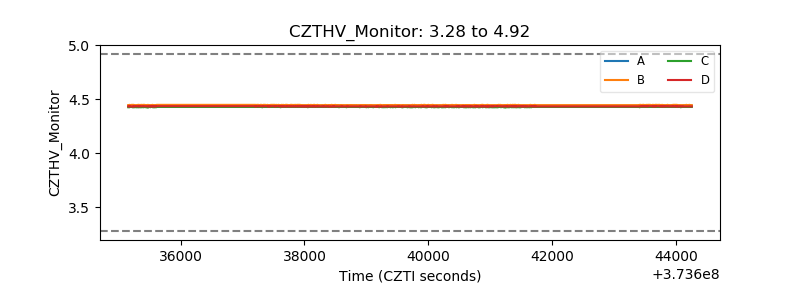 |
| D_VDD | 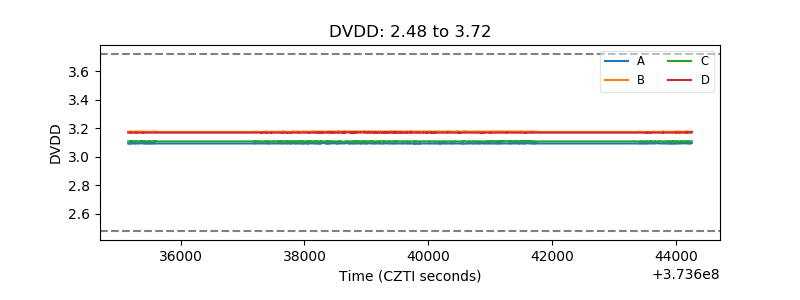 |
| Temperature 1 | 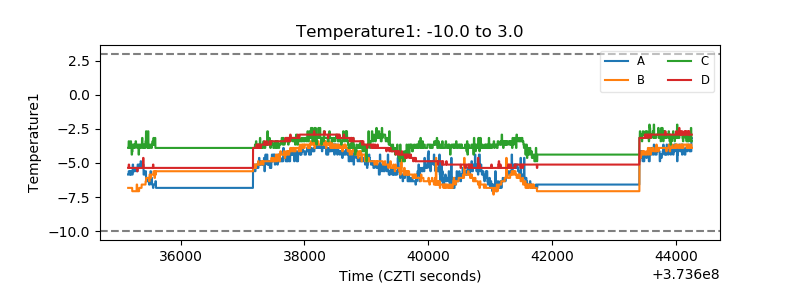 |
| Veto HV Monitor | 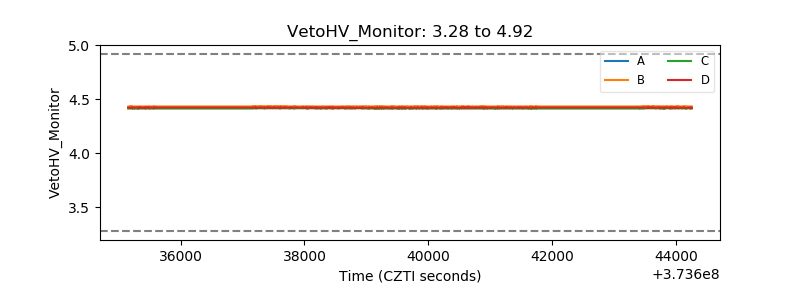 |
| Veto LLD | 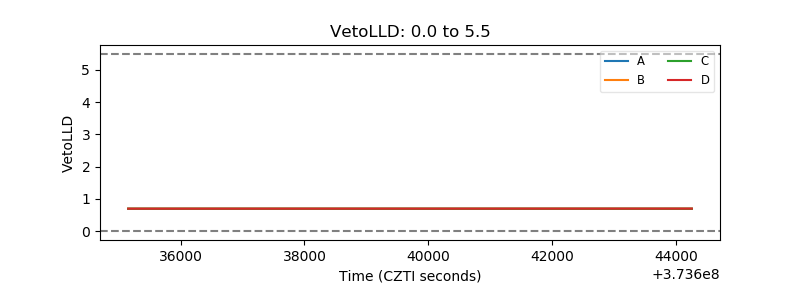 |
| Alpha Counter | 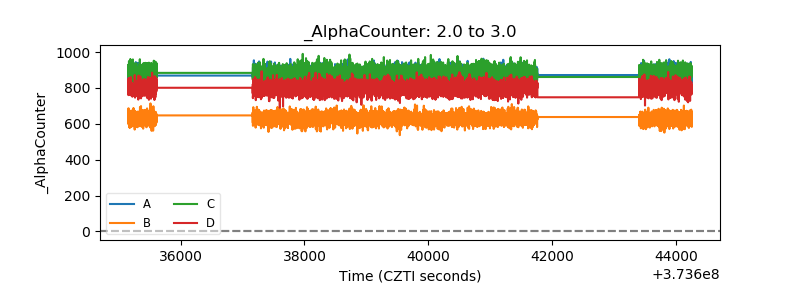 |
| _CPM_Rate |  |
| CZT Counter | 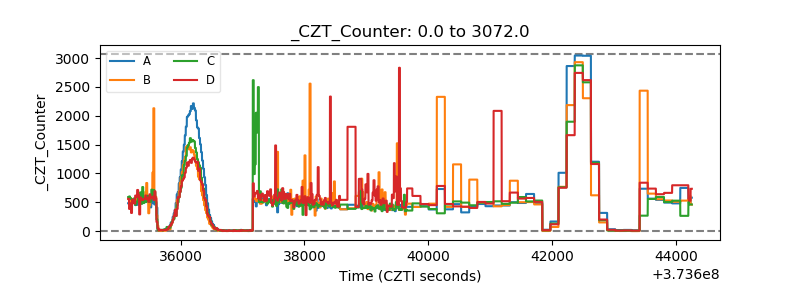 |
| +2.5 Volts monitor |  |
| +5 Volts monitor | 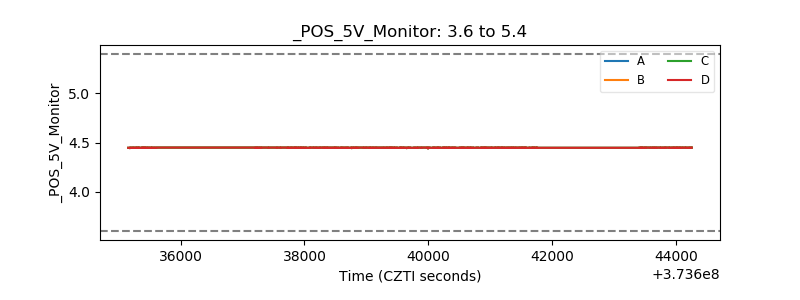 |
| _ROLL_ROT | 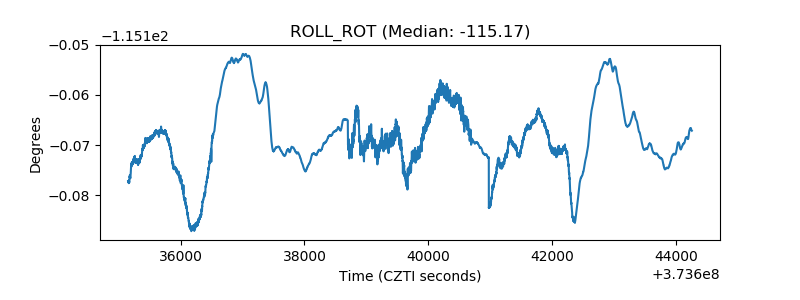 |
| _Roll_DEC | 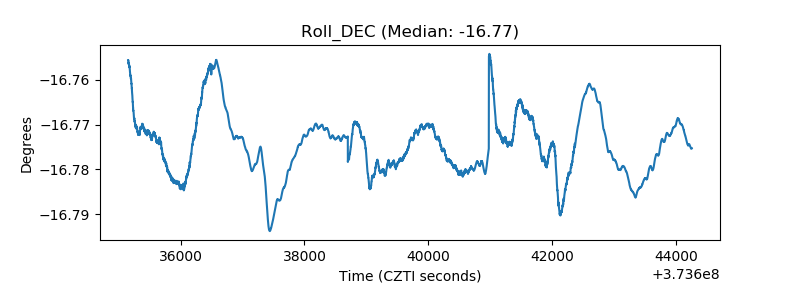 |
| _Roll_RA | 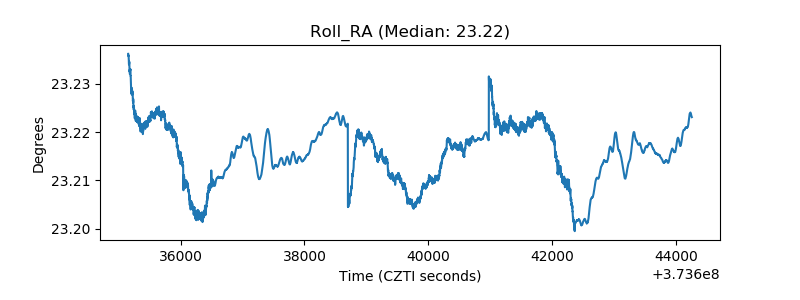 |
| Veto Counter | 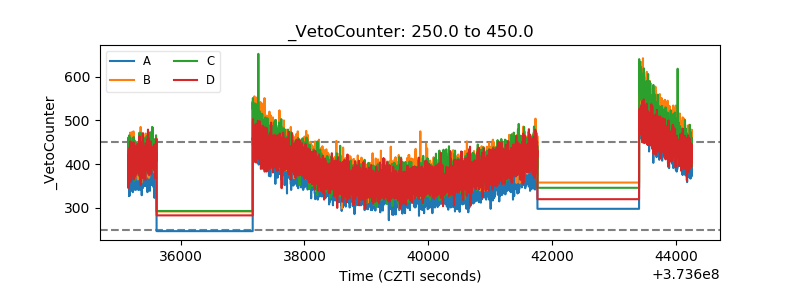 |