| Param | Original file | Final file |
|---|---|---|
| Filename | modeM0/AS1C07_003T01_9000004754_32987cztM0_level2.evt | modeM0/AS1C07_003T01_9000004754_32987cztM0_level2_quad_clean.evt |
| Size (bytes) | 408,957,120 | 88,128,000 |
| Size | 390.0 MB | 84.0 MB |
| Events in quadrant A | 2,599,243 | 595,753 |
| Events in quadrant B | 3,141,387 | 601,275 |
| Events in quadrant C | 2,679,787 | 564,577 |
| Events in quadrant D | 3,613,028 | 544,511 |
| Mode SS | |||
|---|---|---|---|
| Quadrant | BADHDUFLAG | Total packets | Discarded packets |
| A | 0 | 106 | 0 |
| B | 0 | 106 | 0 |
| C | 0 | 106 | 0 |
| D | 0 | 106 | 0 |
| Mode M9 | |||
|---|---|---|---|
| Quadrant | BADHDUFLAG | Total packets | Discarded packets |
| A | 0 | 23 | 0 |
| B | 0 | 23 | 0 |
| C | 0 | 23 | 0 |
| D | 0 | 24 | 0 |
| Mode M0 | |||
|---|---|---|---|
| Quadrant | BADHDUFLAG | Total packets | Discarded packets |
| A | 0 | 10998 | 3 |
| B | 0 | 12658 | 2 |
| C | 0 | 11223 | 2 |
| D | 0 | 14124 | 2 |
| Quadrant | Total seconds | Saturated seconds | Saturation percentage |
|---|---|---|---|
| A | 5176 | 10 | 0.193199% |
| B | 5176 | 122 | 2.357032% |
| C | 5176 | 116 | 2.241113% |
| D | 5176 | 142 | 2.743431% |
Noise dominated data is calculated using 1-second bins in cleaned event files. If a bin has >2000 counts, and if more than 50% of those come from <1% of pixels, then it is considered to be noise-dominated and hence unusable.
| Quadrant | # 1 sec bins | Bins with >0 counts | Bins with >2000 counts | High rate bins dominated by noise | Noise dominated (total time) | Noise dominated (detector-on time) | Marked lightcurve |
|---|---|---|---|---|---|---|---|
| A | 7090 | 5177 | 2 | 2 | 0.03% | 0.04% | 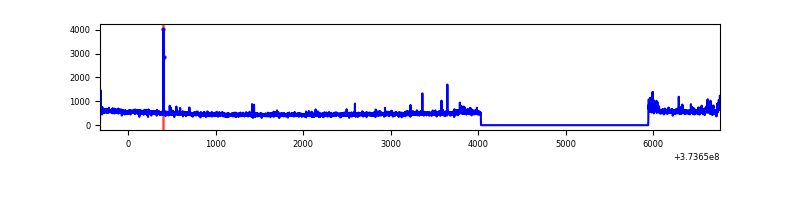 |
| B | 7090 | 5177 | 79 | 79 | 1.11% | 1.53% | 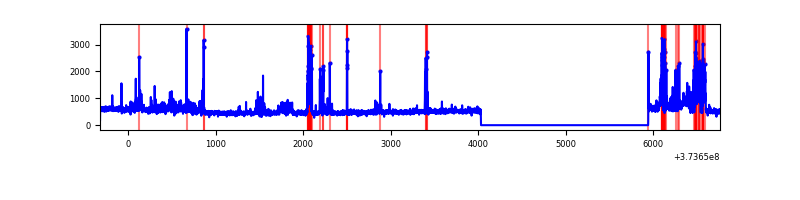 |
| C | 7090 | 5177 | 69 | 69 | 0.97% | 1.33% | 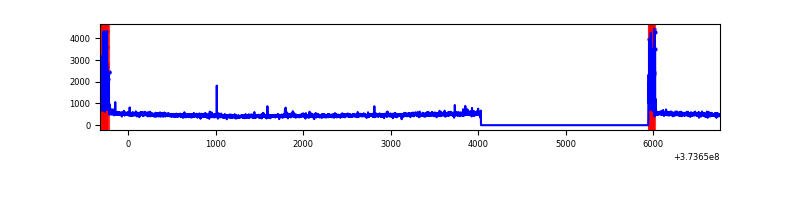 |
| D | 7090 | 5177 | 111 | 111 | 1.57% | 2.14% | 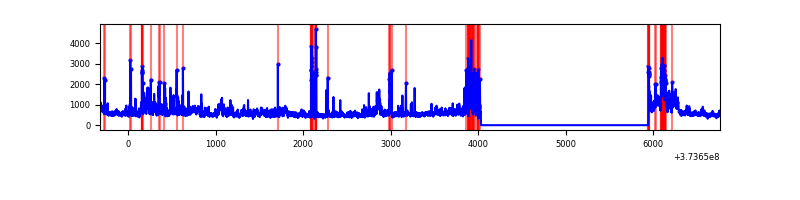 |
Top three noisy pixels from each quadrant. If the there are fewer than three noisy pixels in the level2.evt file, extra rows are filled as -1
| Pixel properties | Quadrant properties | ||||||
|---|---|---|---|---|---|---|---|
| Quadrant | DetID | PixID | Counts | Sigma | Mean | Median | Sigma |
| A | 12 | 227 | 66830 | 510.55 | 648 | 638 | 129.6 |
| A | 9 | 143 | 21938 | 164.29 | 648 | 638 | 129.6 |
| A | 13 | 254 | 8990 | 64.42 | 648 | 638 | 129.6 |
| B | 5 | 172 | 475359 | 3886.52 | 644 | 632 | 122.1 |
| B | 0 | 197 | 110027 | 895.6 | 644 | 632 | 122.1 |
| B | 12 | 111 | 14294 | 111.85 | 644 | 632 | 122.1 |
| C | 0 | 10 | 270625 | 1925.08 | 606 | 613 | 140.3 |
| C | 3 | 233 | 16308 | 111.9 | 606 | 613 | 140.3 |
| C | 14 | 67 | 10979 | 73.91 | 606 | 613 | 140.3 |
| D | 8 | 195 | 428181 | 2691.88 | 604 | 594 | 158.8 |
| D | 2 | 250 | 340102 | 2137.38 | 604 | 594 | 158.8 |
| D | 12 | 227 | 329666 | 2071.68 | 604 | 594 | 158.8 |
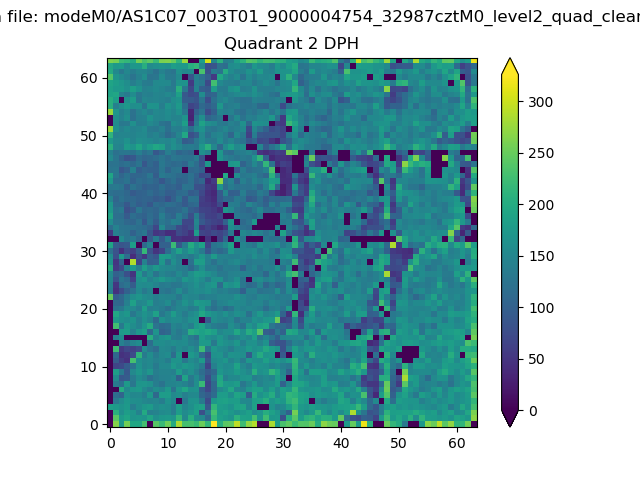
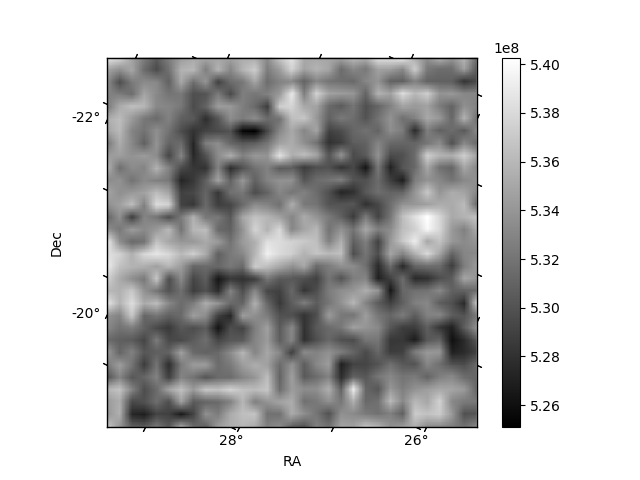
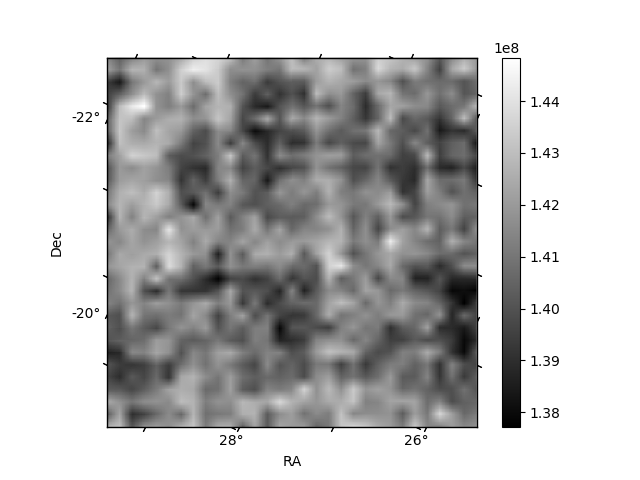
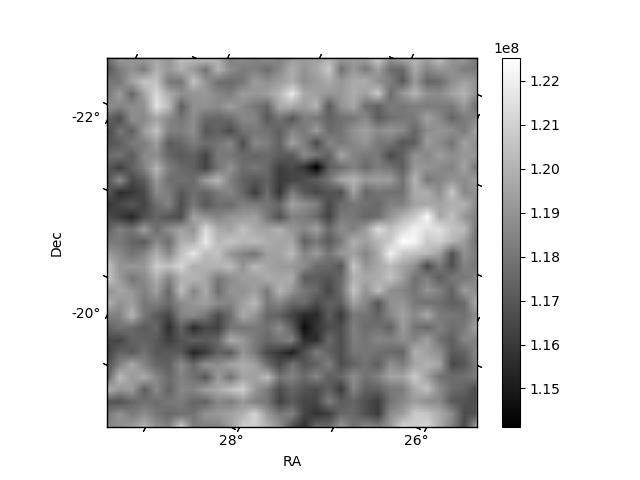
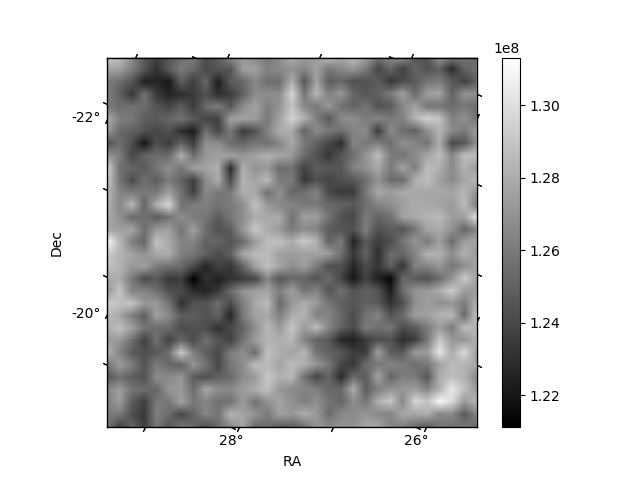
Histogram calculated using DETX and DETY for each event in the final _common_clean file
| Quadrant A | 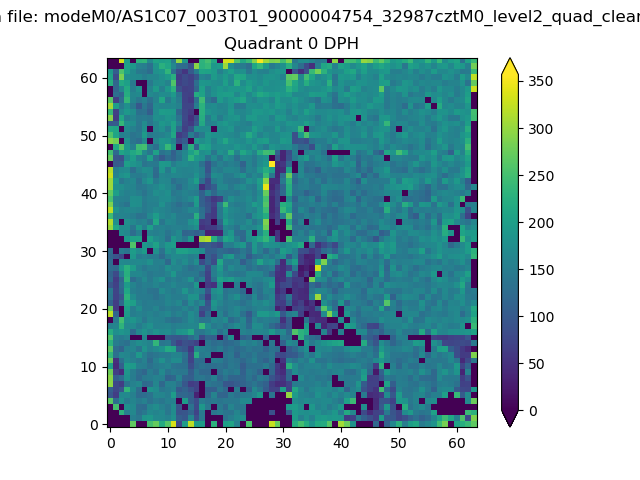 |
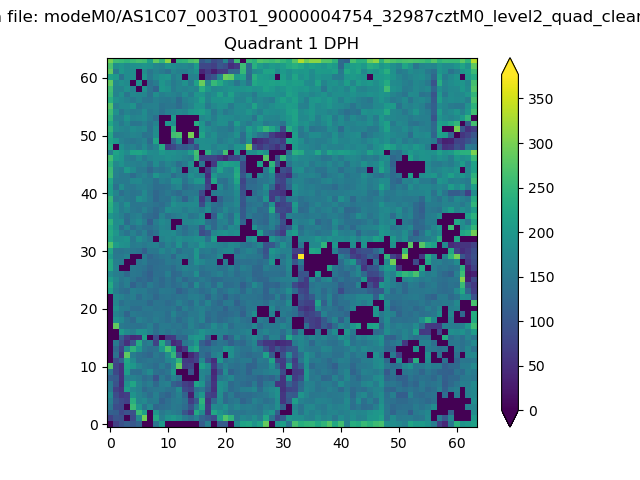 |
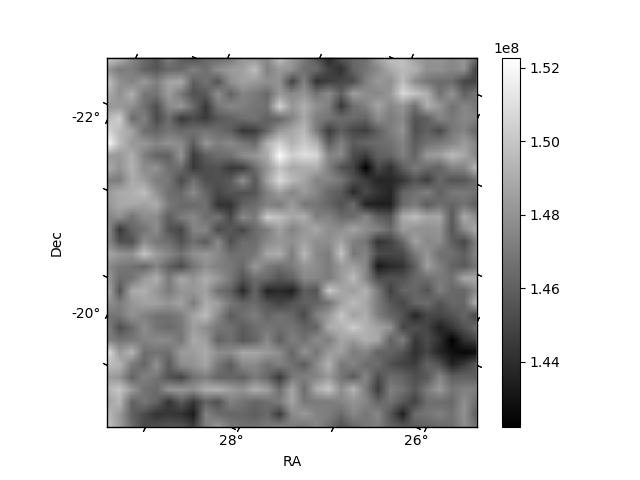
Quadrant B |
|---|---|---|---|
| Quadrant D | 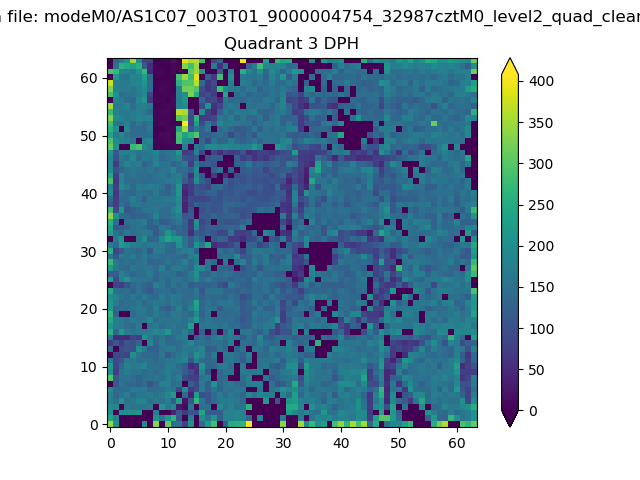 |
 |
Quadrant C |
| Plot type | Count rate plots | Images |
|---|---|---|
| Comparison with Poisson distribution Blue bars denote a histogram of data divided into 1 sec bins. Red curve is a Poisson curve with rate = median count rate of data. |
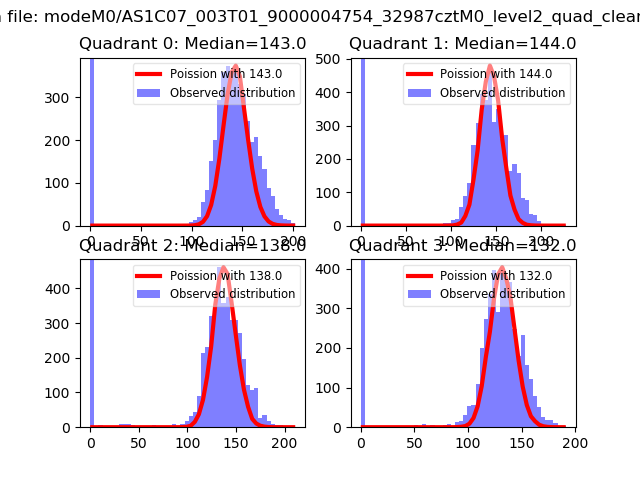 |
 |
| Quadrant-wise count rates Data is divided into 100 sec bins |
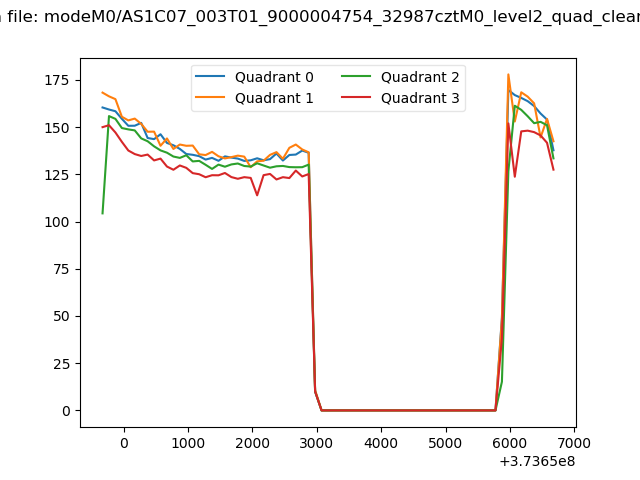 |
|
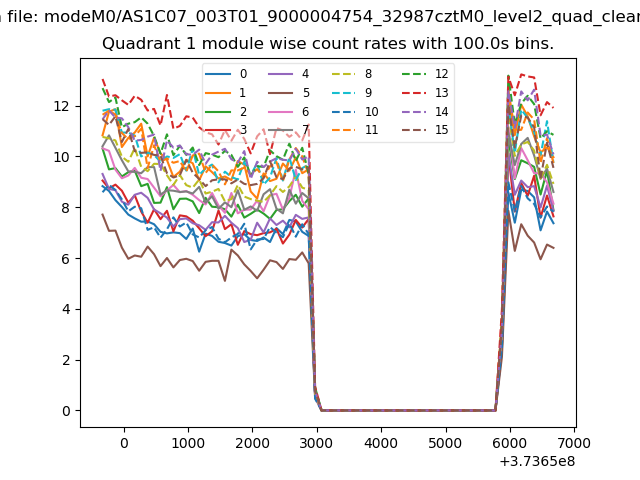
| Module-wise count rates for Quadrant A Data is divided into 100 sec bins |
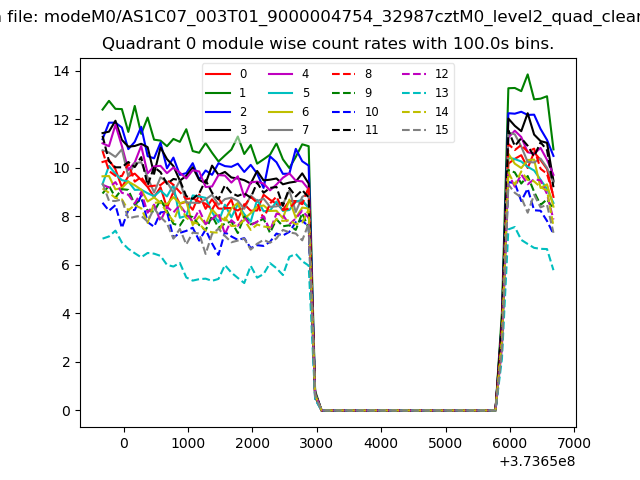 |
 |
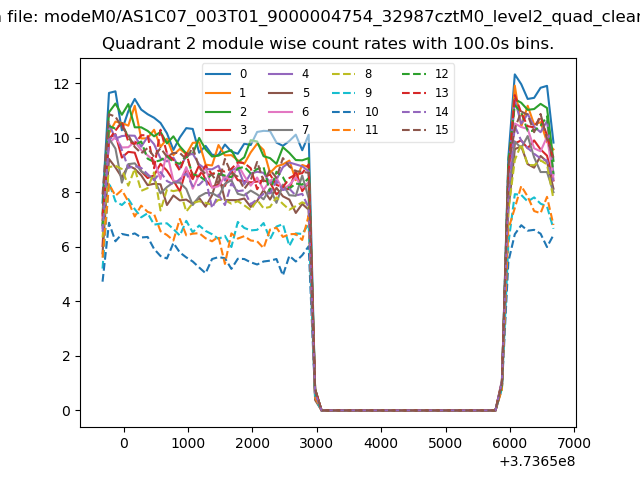
| Module-wise count rates for Quadrant B Data is divided into 100 sec bins |
 |
 |
| Module-wise count rates for Quadrant C Data is divided into 100 sec bins |
 |
 |
| Module-wise count rates for Quadrant D Data is divided into 100 sec bins |
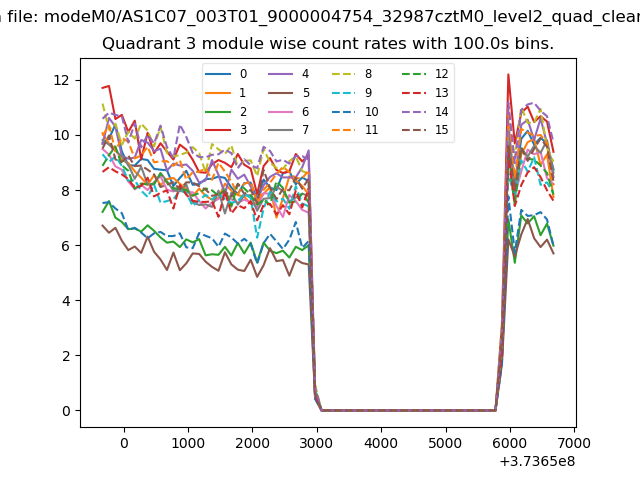 |
 |
| Parameter | Plot |
|---|---|
| CZT HV Monitor | 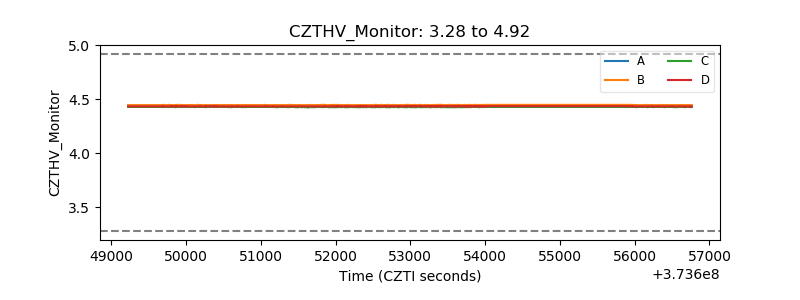 |
| D_VDD | 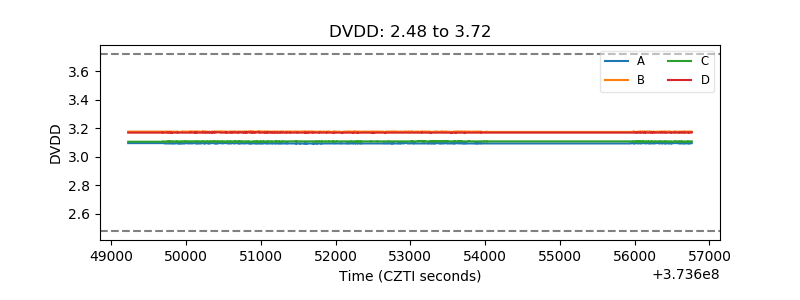 |
| Temperature 1 | 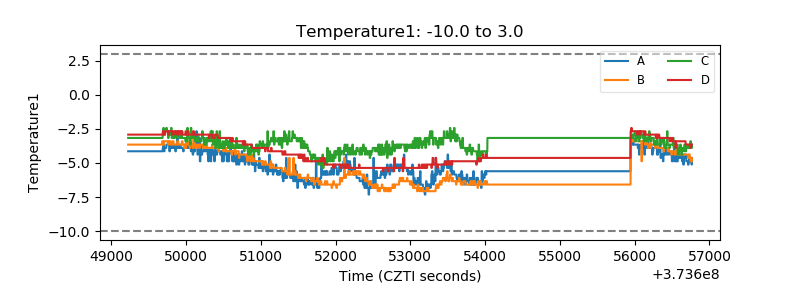 |
| Veto HV Monitor | 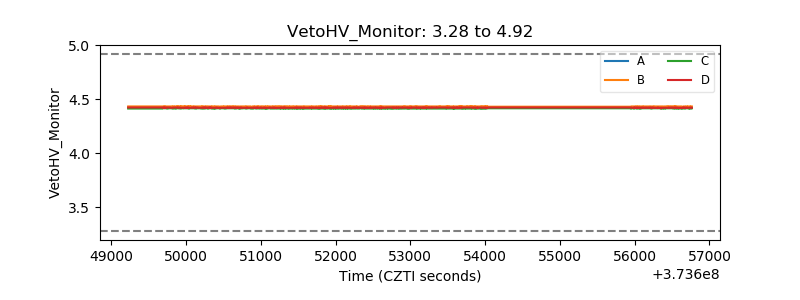 |
| Veto LLD | 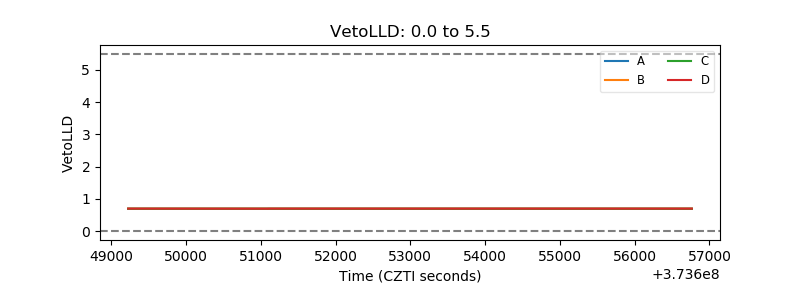 |
| Alpha Counter | 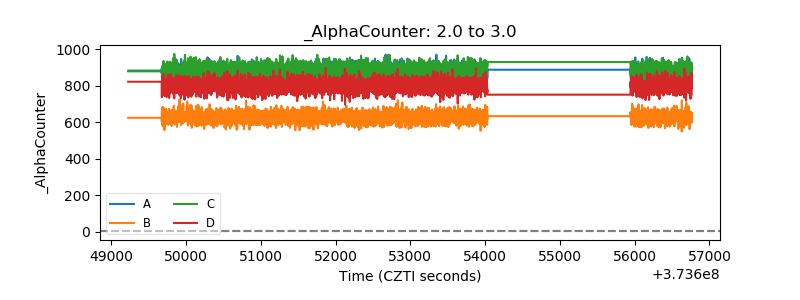 |
| _CPM_Rate | 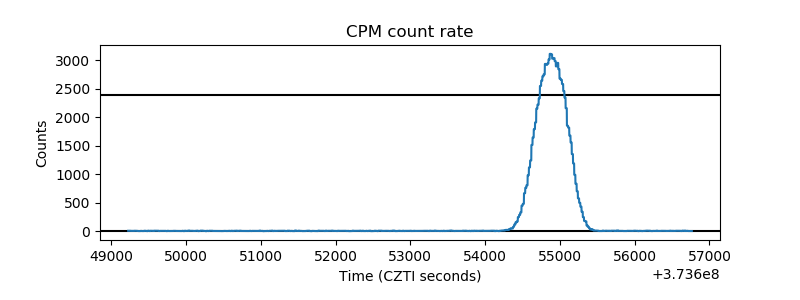 |
| CZT Counter |  |
| +2.5 Volts monitor |  |
| +5 Volts monitor | 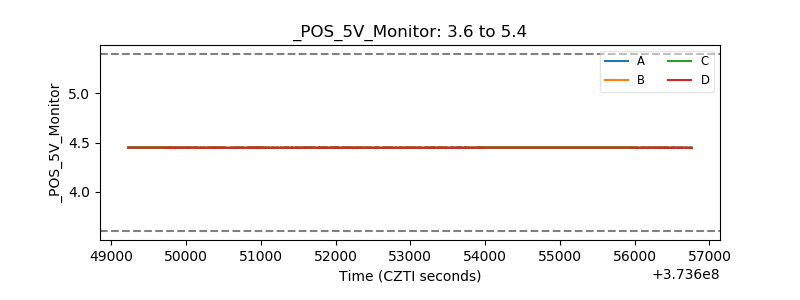 |
| _ROLL_ROT | 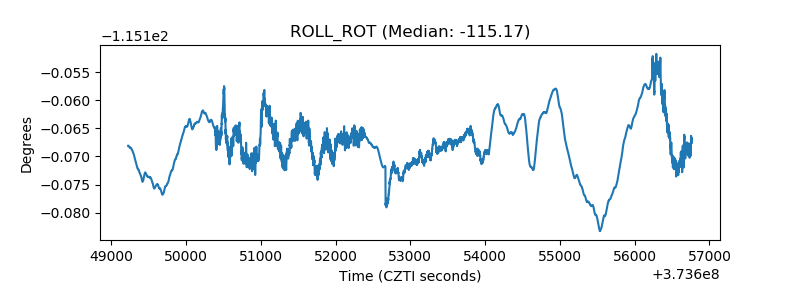 |
| _Roll_DEC |  |
| _Roll_RA |  |
| Veto Counter | 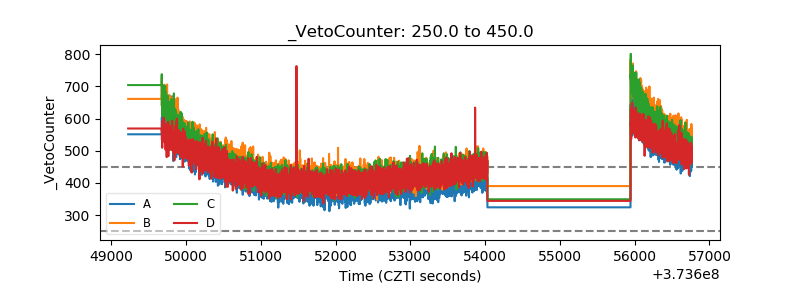 |