| Param | Original file | Final file |
|---|---|---|
| Filename | modeM0/AS1C07_003T01_9000004754_32990cztM0_level2.evt | modeM0/AS1C07_003T01_9000004754_32990cztM0_level2_quad_clean.evt |
| Size (bytes) | 439,583,040 | 63,855,360 |
| Size | 419.2 MB | 60.9 MB |
| Events in quadrant A | 2,356,274 | 409,457 |
| Events in quadrant B | 2,823,519 | 418,829 |
| Events in quadrant C | 2,616,585 | 397,488 |
| Events in quadrant D | 5,181,267 | 361,069 |
| Mode SS | |||
|---|---|---|---|
| Quadrant | BADHDUFLAG | Total packets | Discarded packets |
| A | 0 | 102 | 0 |
| B | 0 | 102 | 0 |
| C | 0 | 102 | 0 |
| D | 0 | 102 | 0 |
| Mode M9 | |||
|---|---|---|---|
| Quadrant | BADHDUFLAG | Total packets | Discarded packets |
| A | 0 | 35 | 0 |
| B | 0 | 35 | 0 |
| C | 0 | 35 | 0 |
| D | 0 | 36 | 0 |
| Mode M0 | |||
|---|---|---|---|
| Quadrant | BADHDUFLAG | Total packets | Discarded packets |
| A | 0 | 10010 | 3 |
| B | 0 | 11335 | 2 |
| C | 0 | 10808 | 2 |
| D | 0 | 18927 | 2 |
| Quadrant | Total seconds | Saturated seconds | Saturation percentage |
|---|---|---|---|
| A | 4934 | 6 | 0.121605% |
| B | 4934 | 145 | 2.938792% |
| C | 4934 | 43 | 0.871504% |
| D | 4934 | 314 | 6.364005% |
Noise dominated data is calculated using 1-second bins in cleaned event files. If a bin has >2000 counts, and if more than 50% of those come from <1% of pixels, then it is considered to be noise-dominated and hence unusable.
| Quadrant | # 1 sec bins | Bins with >0 counts | Bins with >2000 counts | High rate bins dominated by noise | Noise dominated (total time) | Noise dominated (detector-on time) | Marked lightcurve |
|---|---|---|---|---|---|---|---|
| A | 7087 | 4935 | 0 | 0 | 0.00% | 0.00% | 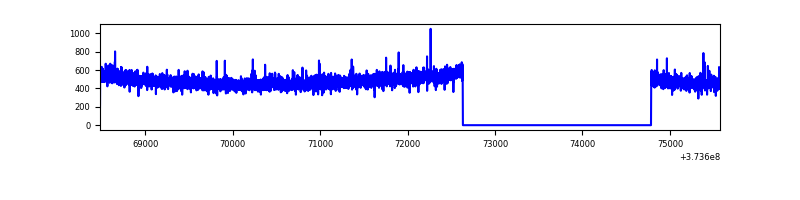 |
| B | 7087 | 4935 | 97 | 97 | 1.37% | 1.97% | 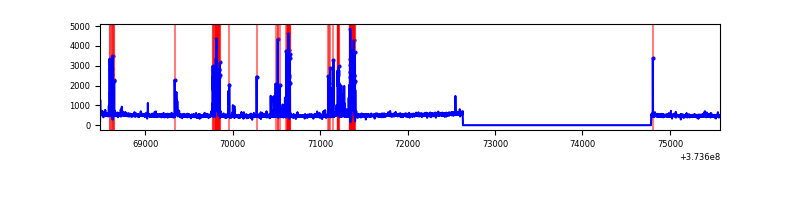 |
| C | 7087 | 4935 | 27 | 27 | 0.38% | 0.55% | 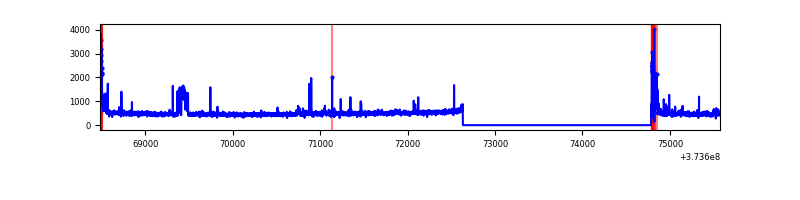 |
| D | 7087 | 4935 | 432 | 432 | 6.10% | 8.75% | 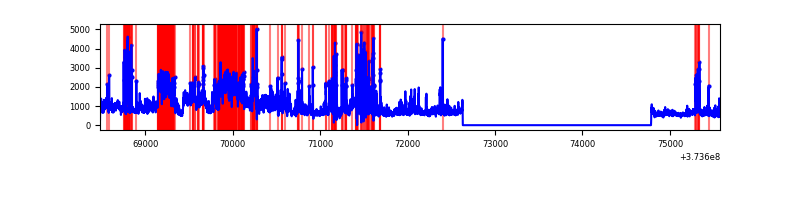 |
Top three noisy pixels from each quadrant. If the there are fewer than three noisy pixels in the level2.evt file, extra rows are filled as -1
| Pixel properties | Quadrant properties | ||||||
|---|---|---|---|---|---|---|---|
| Quadrant | DetID | PixID | Counts | Sigma | Mean | Median | Sigma |
| A | 12 | 227 | 12761 | 101.59 | 603 | 593 | 119.8 |
| A | 13 | 254 | 8892 | 69.29 | 603 | 593 | 119.8 |
| A | 9 | 143 | 5918 | 44.46 | 603 | 593 | 119.8 |
| B | 5 | 172 | 299031 | 2612.04 | 603 | 589 | 114.3 |
| B | 5 | 200 | 100899 | 877.94 | 603 | 589 | 114.3 |
| B | 0 | 246 | 35446 | 305.08 | 603 | 589 | 114.3 |
| C | 0 | 10 | 156803 | 1147.81 | 588 | 594 | 136.1 |
| C | 9 | 187 | 103259 | 754.37 | 588 | 594 | 136.1 |
| C | 14 | 67 | 15232 | 107.56 | 588 | 594 | 136.1 |
| D | 12 | 227 | 1519768 | 10077.71 | 568 | 557 | 150.7 |
| D | 2 | 250 | 625327 | 4144.42 | 568 | 557 | 150.7 |
| D | 8 | 195 | 619015 | 4102.55 | 568 | 557 | 150.7 |
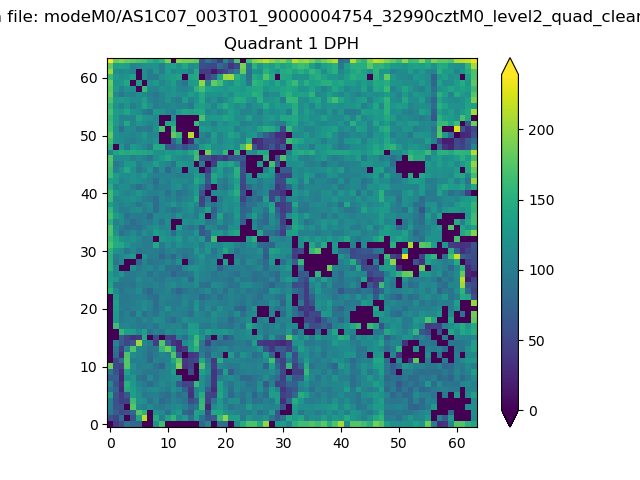
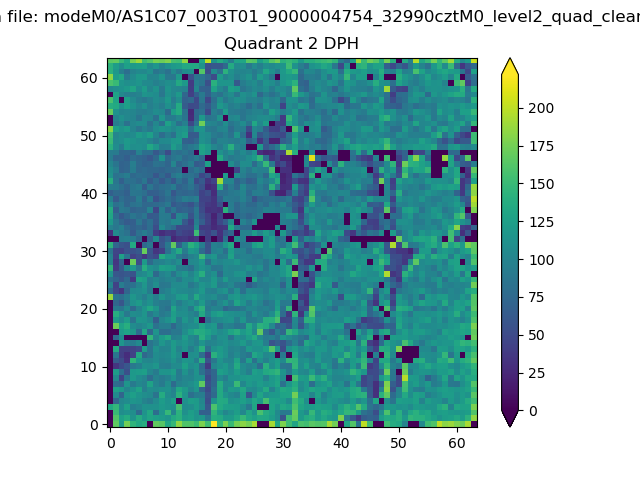
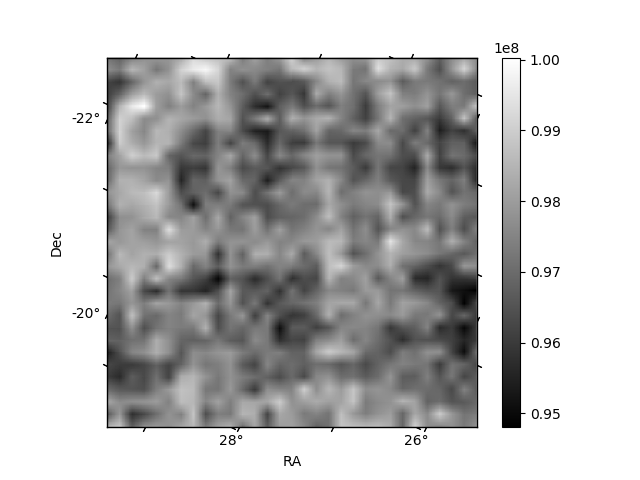
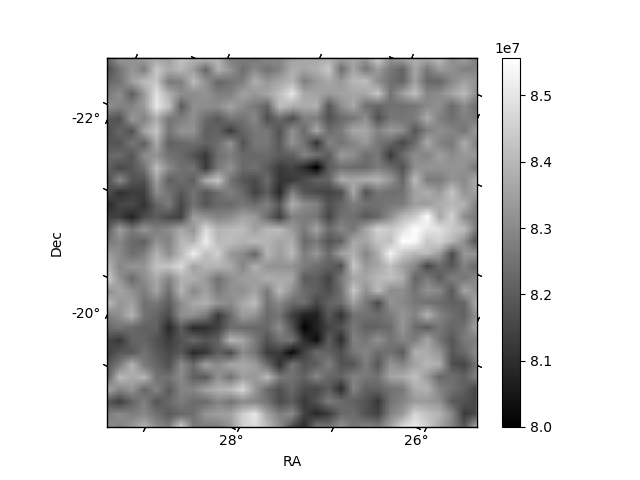
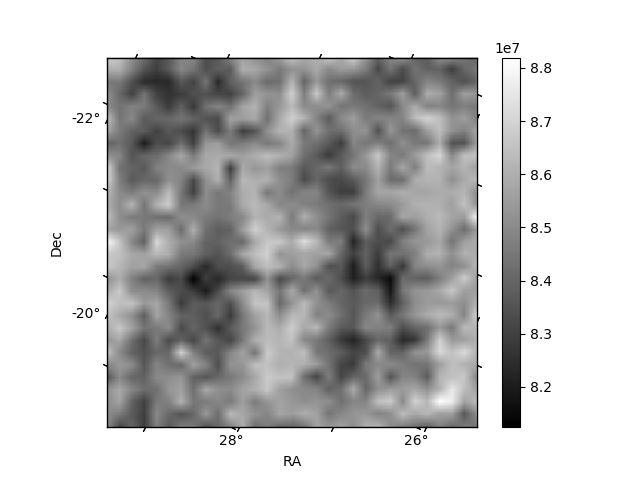
Histogram calculated using DETX and DETY for each event in the final _common_clean file
| Quadrant A |  |
 |
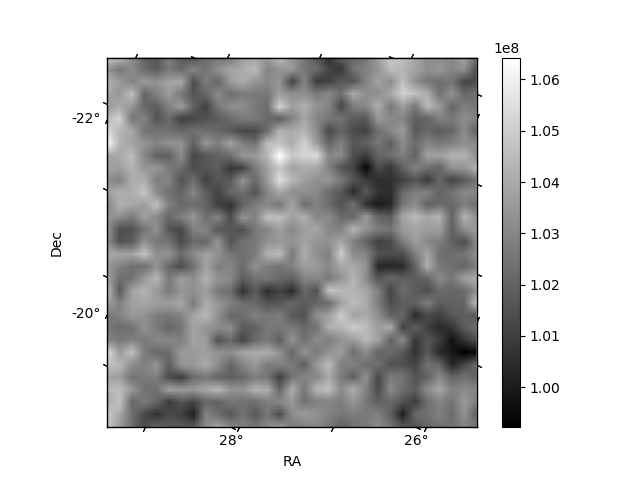
Quadrant B |
|---|---|---|---|
| Quadrant D |  |
 |
Quadrant C |
| Plot type | Count rate plots | Images |
|---|---|---|
| Comparison with Poisson distribution Blue bars denote a histogram of data divided into 1 sec bins. Red curve is a Poisson curve with rate = median count rate of data. |
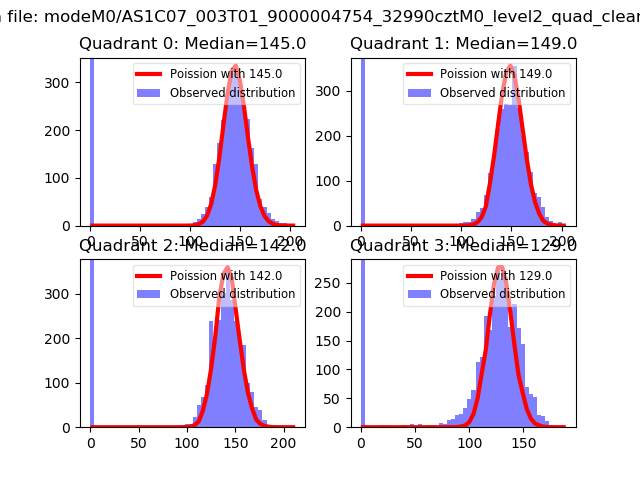 |
 |
| Quadrant-wise count rates Data is divided into 100 sec bins |
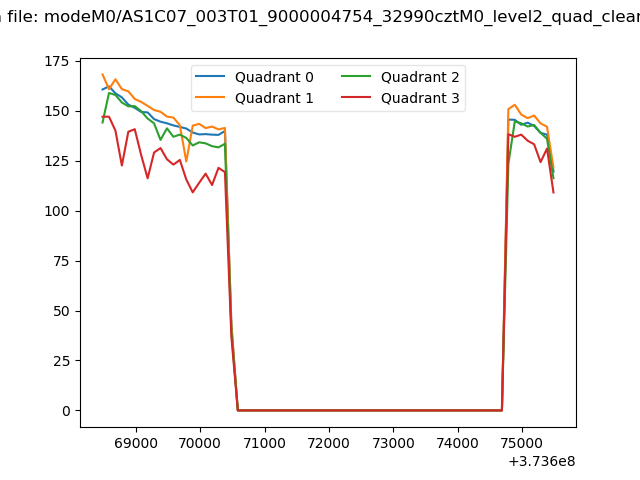 |
|
| Module-wise count rates for Quadrant A Data is divided into 100 sec bins |
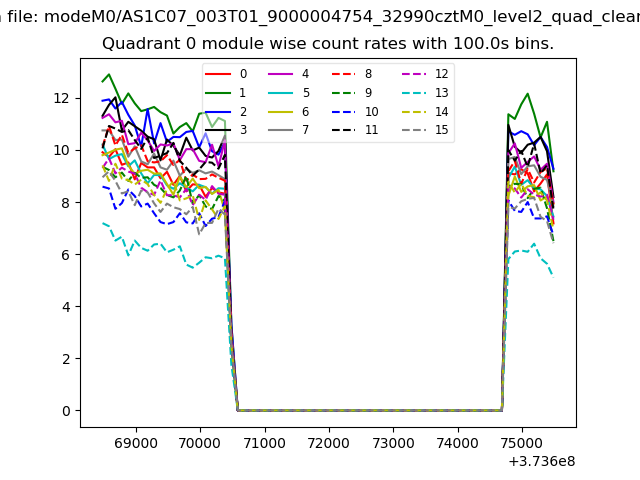 |
 |
| Module-wise count rates for Quadrant B Data is divided into 100 sec bins |
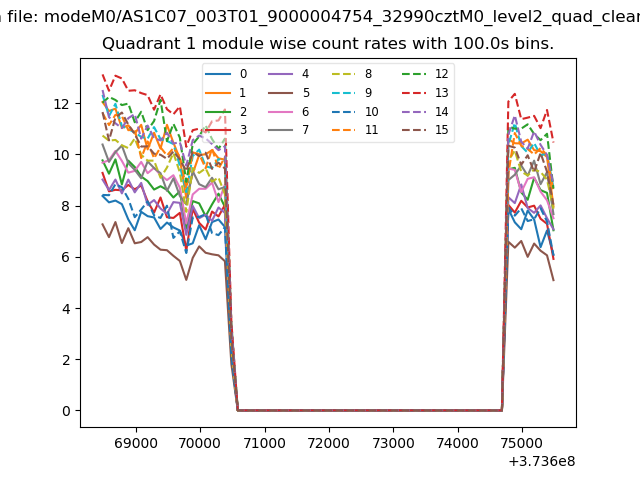 |
 |
| Module-wise count rates for Quadrant C Data is divided into 100 sec bins |
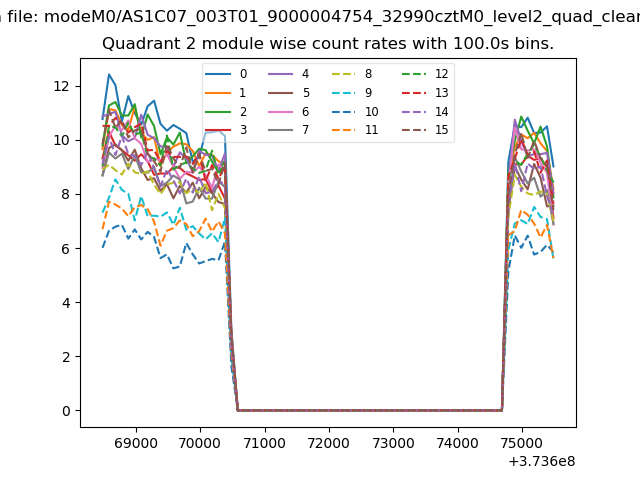 |
 |
| Module-wise count rates for Quadrant D Data is divided into 100 sec bins |
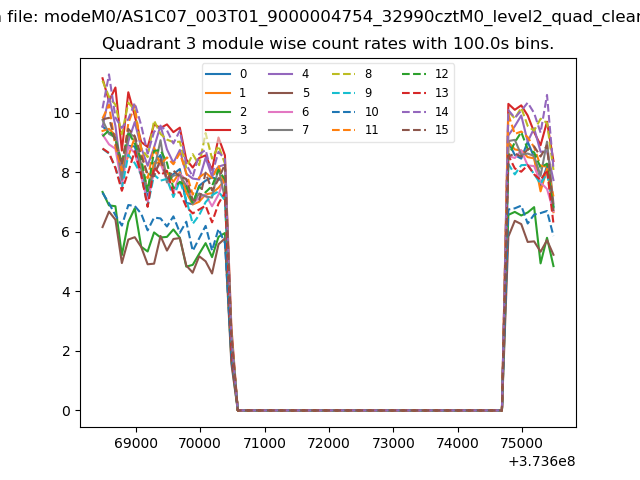 |
 |
| Parameter | Plot |
|---|---|
| CZT HV Monitor | 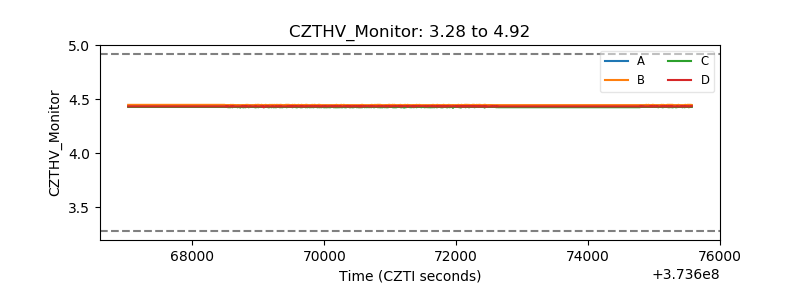 |
| D_VDD | 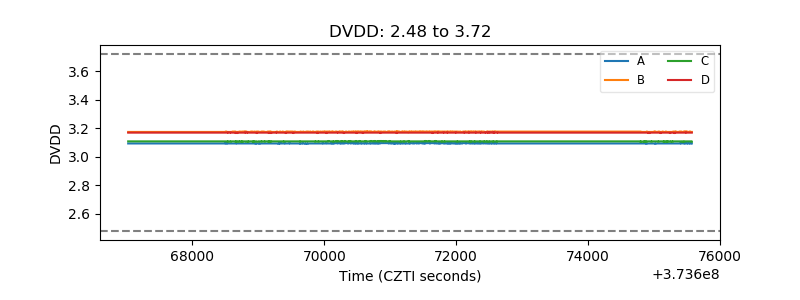 |
| Temperature 1 | 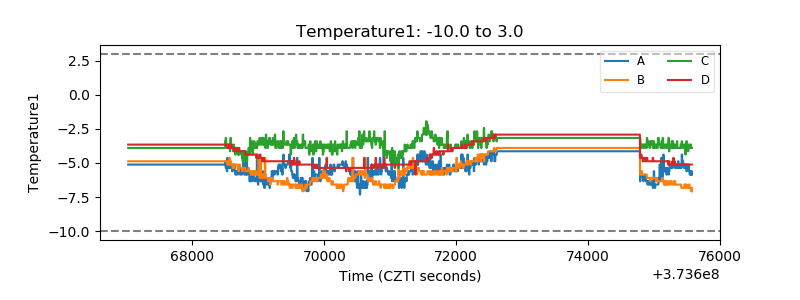 |
| Veto HV Monitor | 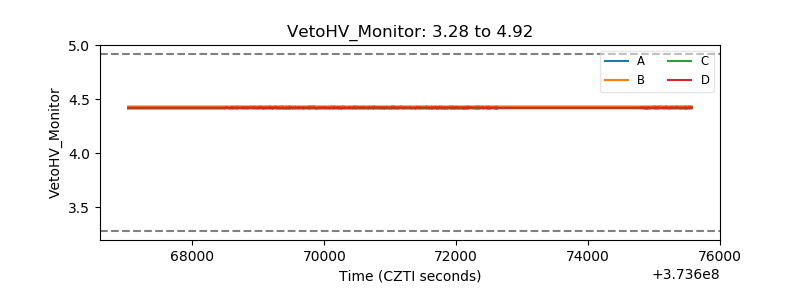 |
| Veto LLD | 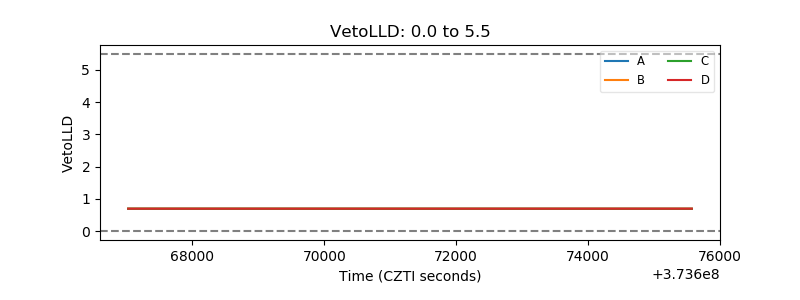 |
| Alpha Counter | 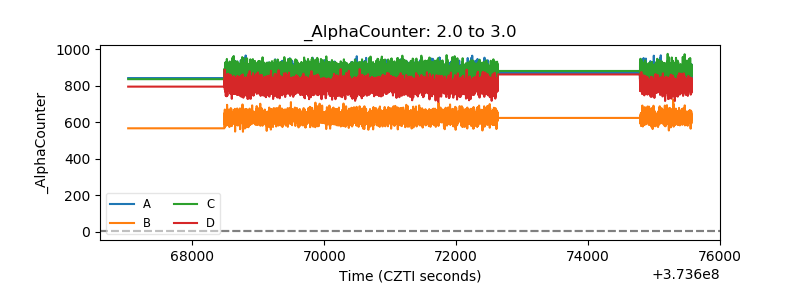 |
| _CPM_Rate | 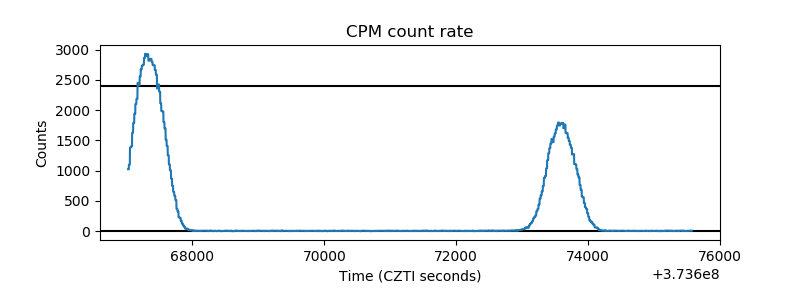 |
| CZT Counter |  |
| +2.5 Volts monitor |  |
| +5 Volts monitor | 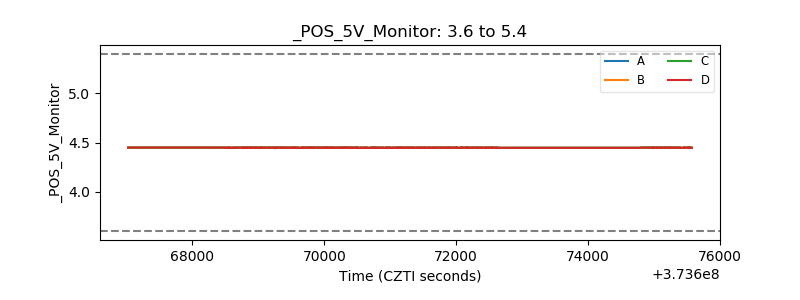 |
| _ROLL_ROT | 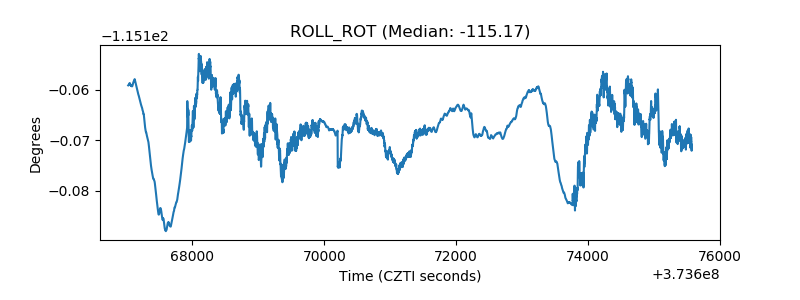 |
| _Roll_DEC | 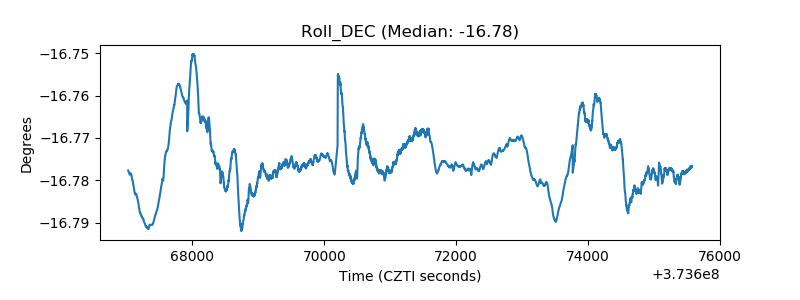 |
| _Roll_RA |  |
| Veto Counter | 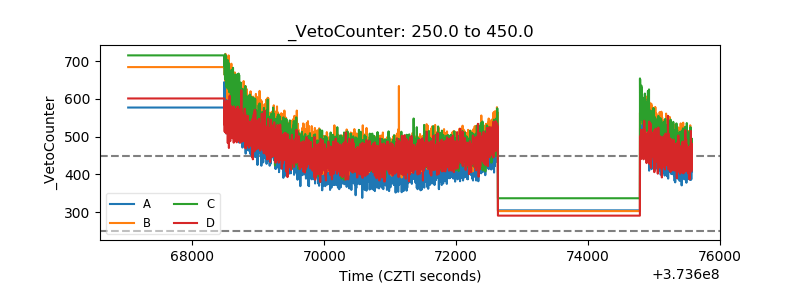 |