| Param | Original file | Final file |
|---|---|---|
| Filename | modeM0/AS1C07_003T01_9000004754_32991cztM0_level2.evt | modeM0/AS1C07_003T01_9000004754_32991cztM0_level2_quad_clean.evt |
| Size (bytes) | 96,410,880 | 27,011,520 |
| Size | 91.9 MB | 25.8 MB |
| Events in quadrant A | 599,336 | 183,163 |
| Events in quadrant B | 640,281 | 188,829 |
| Events in quadrant C | 700,165 | 177,296 |
| Events in quadrant D | 887,672 | 169,819 |
| Mode SS | |||
|---|---|---|---|
| Quadrant | BADHDUFLAG | Total packets | Discarded packets |
| A | 0 | 26 | 0 |
| B | 0 | 26 | 0 |
| C | 0 | 26 | 0 |
| D | 0 | 26 | 0 |
| Mode M9 | |||
|---|---|---|---|
| Quadrant | BADHDUFLAG | Total packets | Discarded packets |
| A | 0 | 10 | 0 |
| B | 0 | 10 | 0 |
| C | 0 | 10 | 0 |
| D | 0 | 11 | 0 |
| Mode M0 | |||
|---|---|---|---|
| Quadrant | BADHDUFLAG | Total packets | Discarded packets |
| A | 0 | 2641 | 1 |
| B | 0 | 2717 | 1 |
| C | 0 | 2920 | 1 |
| D | 0 | 3511 | 1 |
| Quadrant | Total seconds | Saturated seconds | Saturation percentage |
|---|---|---|---|
| A | 1315 | 1 | 0.076046% |
| B | 1315 | 7 | 0.532319% |
| C | 1315 | 20 | 1.520913% |
| D | 1315 | 19 | 1.444867% |
Noise dominated data is calculated using 1-second bins in cleaned event files. If a bin has >2000 counts, and if more than 50% of those come from <1% of pixels, then it is considered to be noise-dominated and hence unusable.
| Quadrant | # 1 sec bins | Bins with >0 counts | Bins with >2000 counts | High rate bins dominated by noise | Noise dominated (total time) | Noise dominated (detector-on time) | Marked lightcurve |
|---|---|---|---|---|---|---|---|
| A | 1315 | 1315 | 0 | 0 | 0.00% | 0.00% | 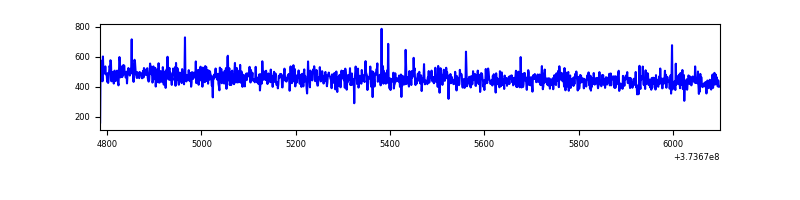 |
| B | 1315 | 1315 | 4 | 4 | 0.30% | 0.30% | 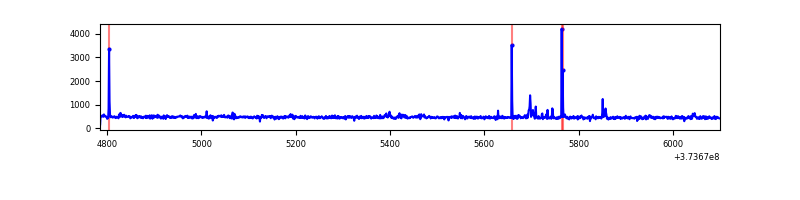 |
| C | 1315 | 1315 | 13 | 13 | 0.99% | 0.99% | 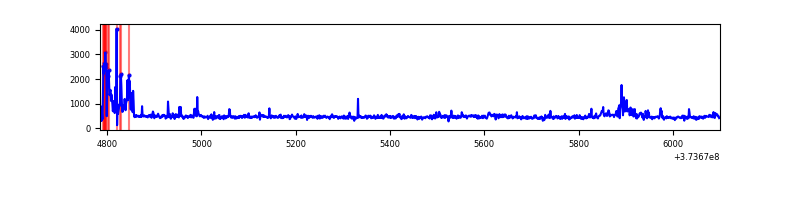 |
| D | 1315 | 1315 | 19 | 19 | 1.44% | 1.44% | 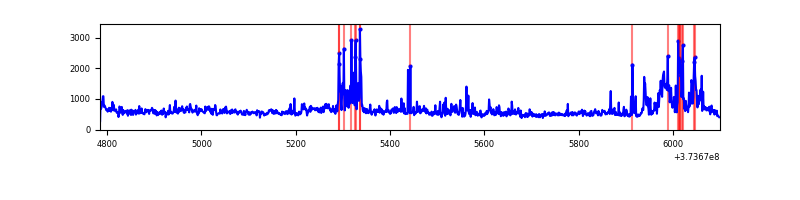 |
Top three noisy pixels from each quadrant. If the there are fewer than three noisy pixels in the level2.evt file, extra rows are filled as -1
| Pixel properties | Quadrant properties | ||||||
|---|---|---|---|---|---|---|---|
| Quadrant | DetID | PixID | Counts | Sigma | Mean | Median | Sigma |
| A | 13 | 254 | 2263 | 64.71 | 153 | 150 | 32.7 |
| A | 9 | 143 | 2146 | 61.13 | 153 | 150 | 32.7 |
| A | 15 | 47 | 1541 | 42.6 | 153 | 150 | 32.7 |
| B | 5 | 172 | 18307 | 580.21 | 155 | 152 | 31.3 |
| B | 0 | 199 | 4347 | 134.07 | 155 | 152 | 31.3 |
| B | 12 | 111 | 3301 | 100.64 | 155 | 152 | 31.3 |
| C | 0 | 10 | 105635 | 2926.73 | 148 | 150 | 36.0 |
| C | 15 | 208 | 4547 | 122.0 | 148 | 150 | 36.0 |
| C | 7 | 247 | 3887 | 103.68 | 148 | 150 | 36.0 |
| D | 2 | 250 | 138689 | 3447.13 | 147 | 144 | 40.2 |
| D | 8 | 195 | 136974 | 3404.46 | 147 | 144 | 40.2 |
| D | 1 | 47 | 26516 | 656.16 | 147 | 144 | 40.2 |
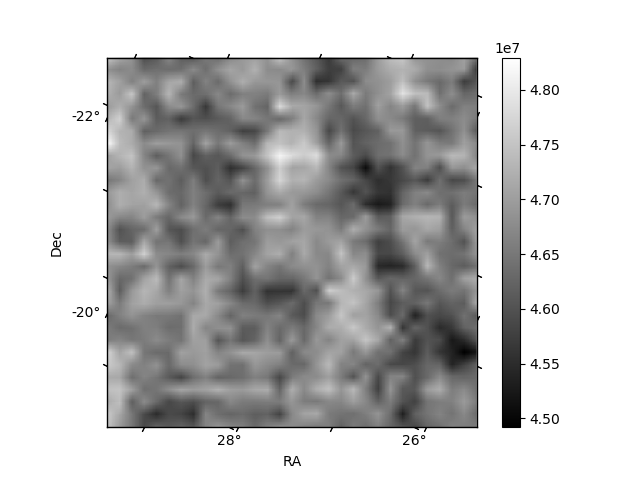
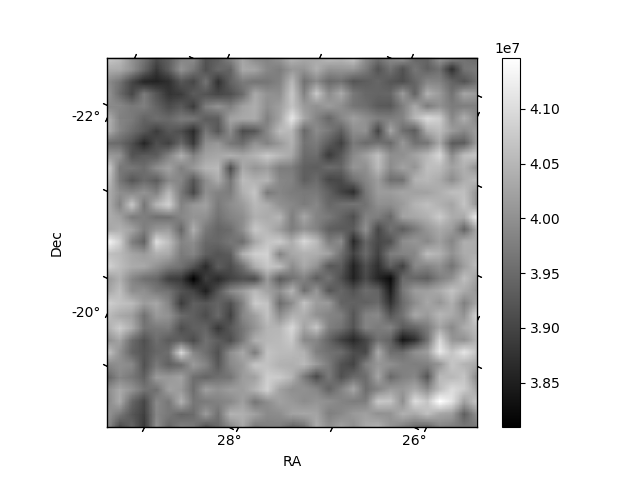
Histogram calculated using DETX and DETY for each event in the final _common_clean file
| Quadrant A | 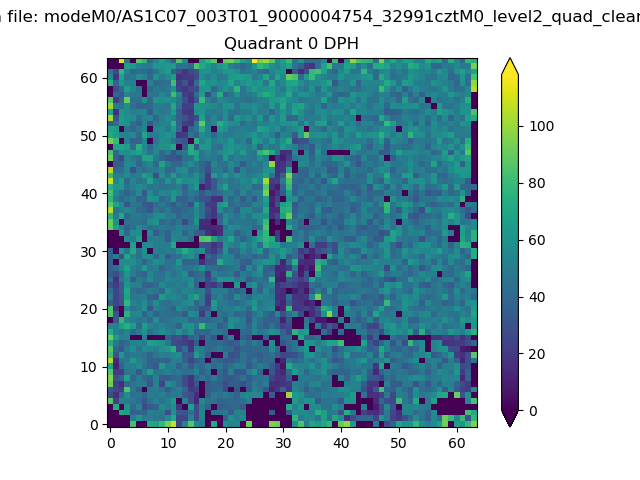 |
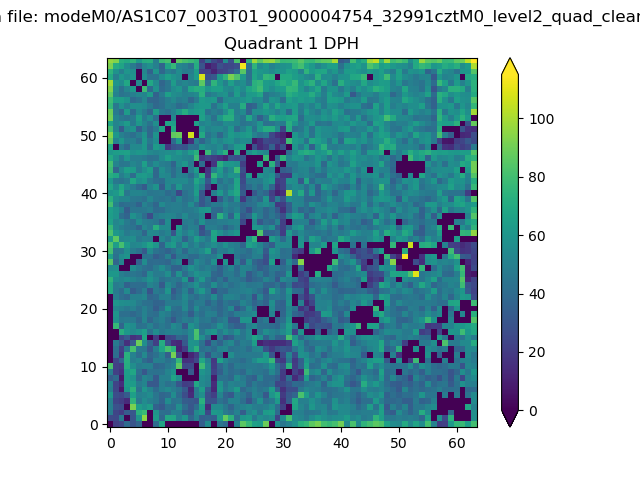 |
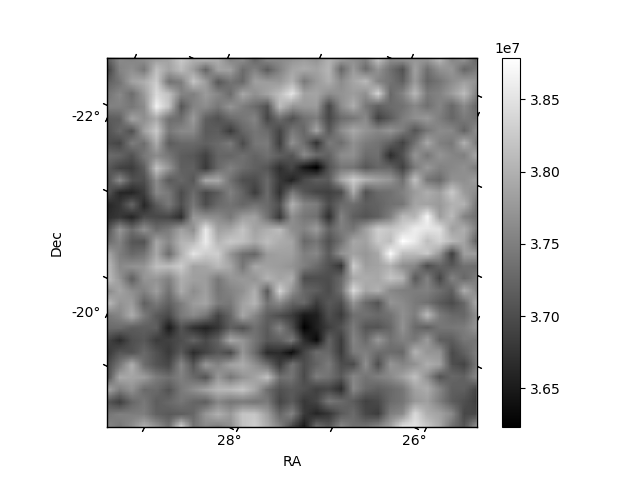
Quadrant B |
|---|---|---|---|
| Quadrant D | 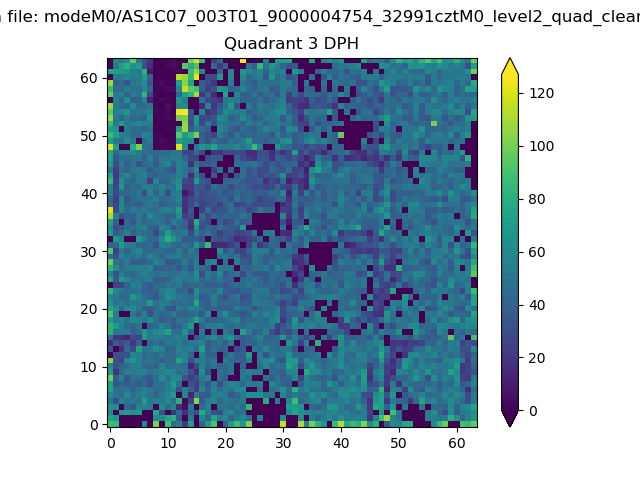 |
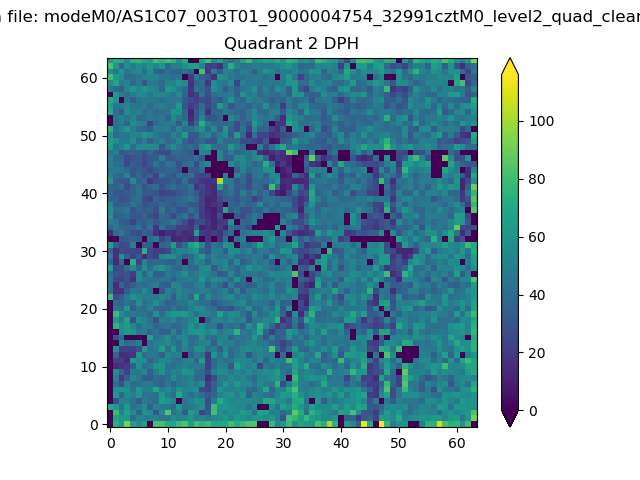 |
Quadrant C |
| Plot type | Count rate plots | Images |
|---|---|---|
| Comparison with Poisson distribution Blue bars denote a histogram of data divided into 1 sec bins. Red curve is a Poisson curve with rate = median count rate of data. |
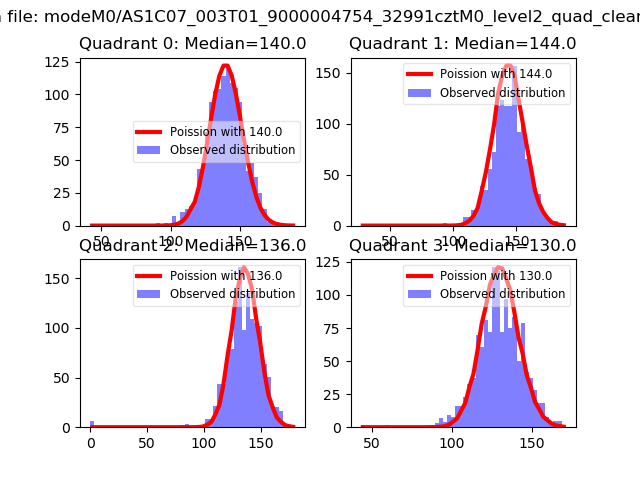 |
 |
| Quadrant-wise count rates Data is divided into 100 sec bins |
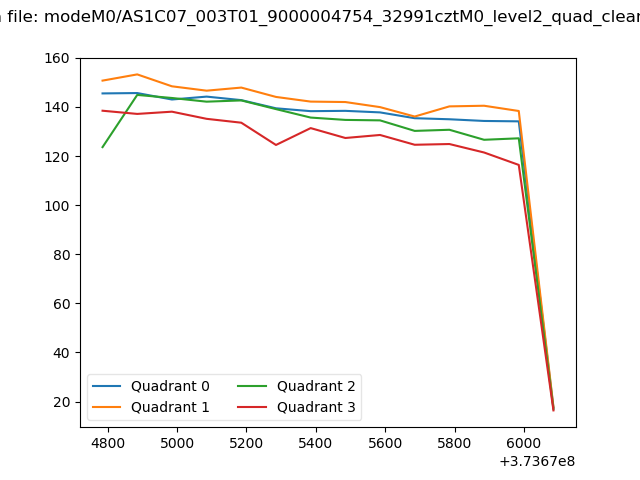 |
|
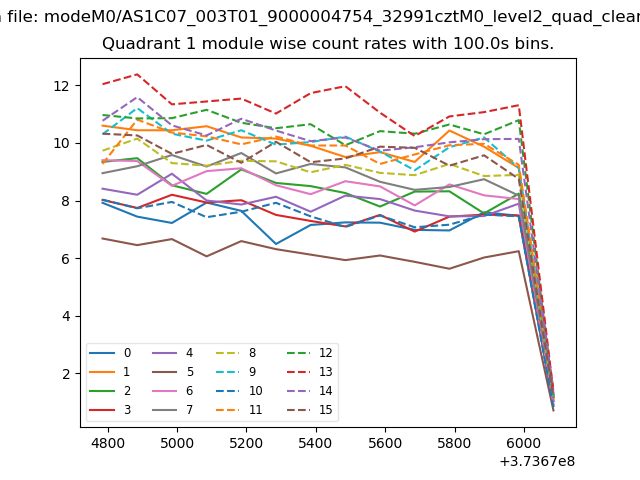
| Module-wise count rates for Quadrant A Data is divided into 100 sec bins |
 |
 |
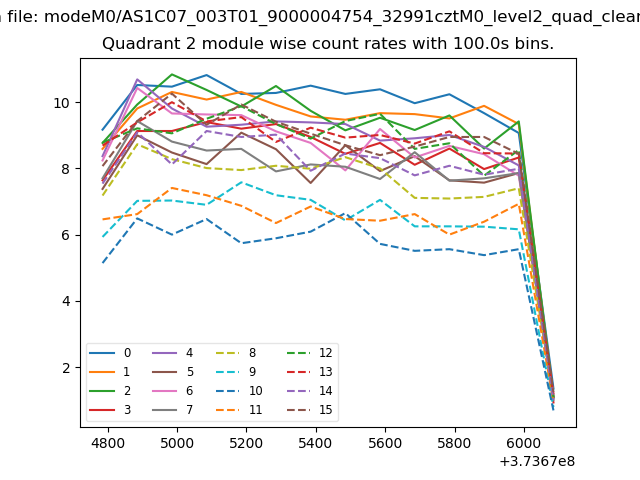
| Module-wise count rates for Quadrant B Data is divided into 100 sec bins |
 |
 |
| Module-wise count rates for Quadrant C Data is divided into 100 sec bins |
 |
 |
| Module-wise count rates for Quadrant D Data is divided into 100 sec bins |
 |
 |
| Parameter | Plot |
|---|---|
| CZT HV Monitor |  |
| D_VDD |  |
| Temperature 1 | 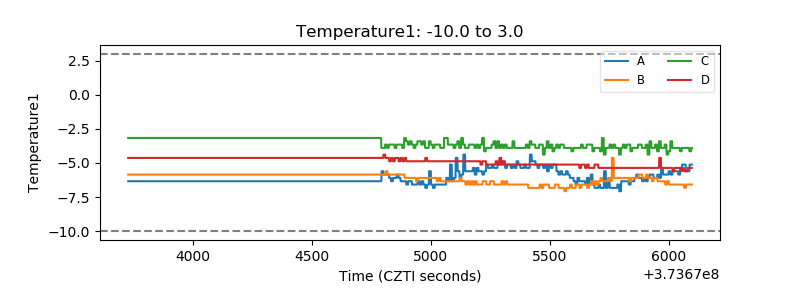 |
| Veto HV Monitor | 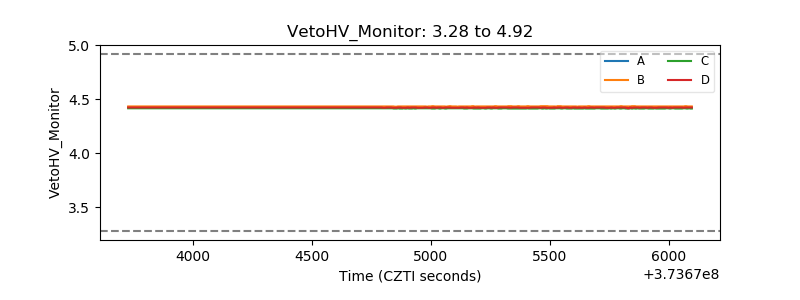 |
| Veto LLD |  |
| Alpha Counter | 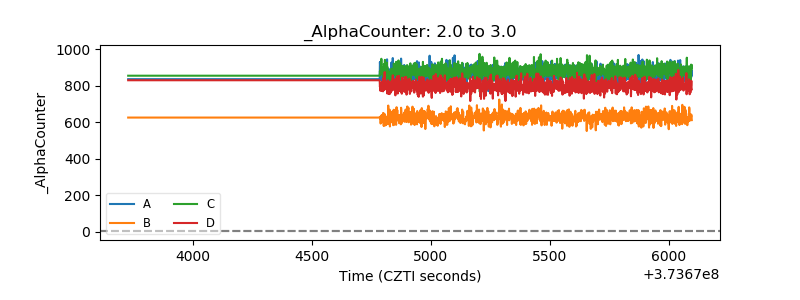 |
| _CPM_Rate | 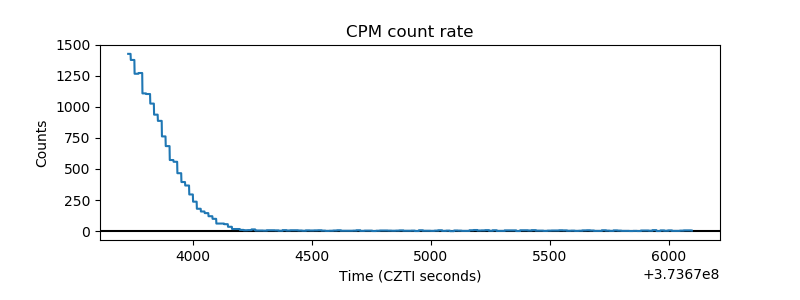 |
| CZT Counter | 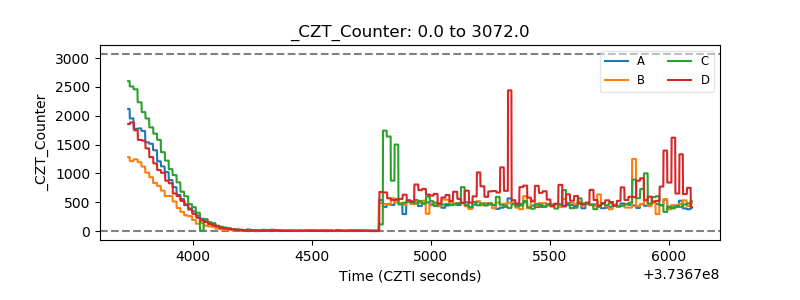 |
| +2.5 Volts monitor |  |
| +5 Volts monitor |  |
| _ROLL_ROT | 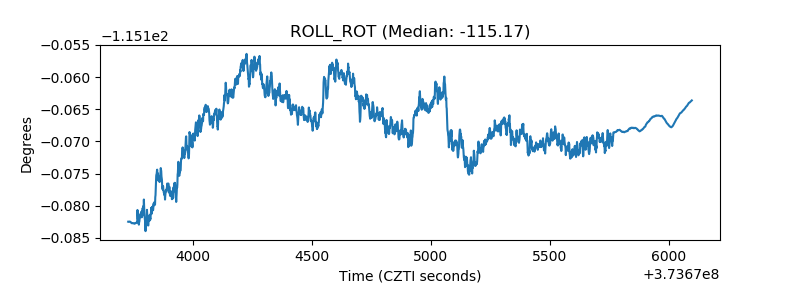 |
| _Roll_DEC | 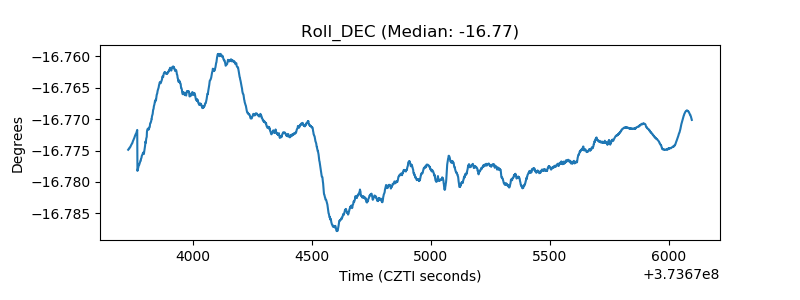 |
| _Roll_RA | 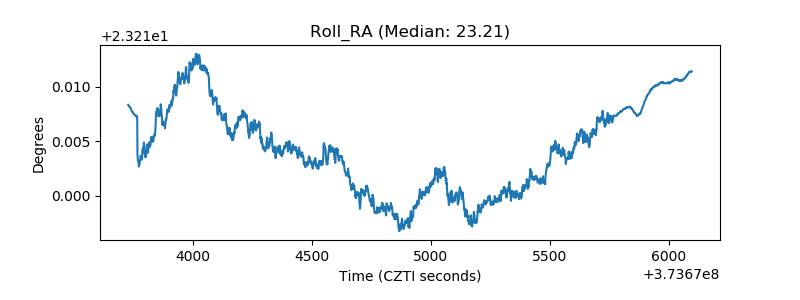 |
| Veto Counter |  |