| Param | Original file | Final file |
|---|---|---|
| Filename | modeM0/AS1A11_080T01_9000004756cztM0_level2.fits | modeM0/AS1A11_080T01_9000004756cztM0_level2_quad_clean.evt |
| Size (bytes) | 320,541,120 | 404,089,920 |
| Size | 305.7 MB | 385.4 MB |
| Events in quadrant A | 1,992,128 | 2,755,542 |
| Events in quadrant B | 1,850,764 | 2,553,223 |
| Events in quadrant C | 1,919,446 | 2,551,170 |
| Events in quadrant D | 1,550,370 | 1,986,117 |
| Mode SS | |||
|---|---|---|---|
| Quadrant | BADHDUFLAG | Total packets | Discarded packets |
| A | 0 | 714 | 0 |
| B | 0 | 716 | 0 |
| C | 0 | 713 | 0 |
| D | 0 | 718 | 0 |
| Mode M9 | |||
|---|---|---|---|
| Quadrant | BADHDUFLAG | Total packets | Discarded packets |
| A | 0 | 139 | 0 |
| B | 0 | 139 | 0 |
| C | 0 | 137 | 0 |
| D | 0 | 142 | 0 |
| Mode M0 | |||
|---|---|---|---|
| Quadrant | BADHDUFLAG | Total packets | Discarded packets |
| A | 0 | 70692 | 0 |
| B | 0 | 89959 | 0 |
| C | 0 | 75587 | 0 |
| D | 0 | 136012 | 0 |
| Quadrant | Total seconds | Saturated seconds | Saturation percentage |
|---|---|---|---|
| A | 34852 | 29 | 0.083209% |
| B | 34805 | 1919 | 5.513576% |
| C | 34848 | 463 | 1.328627% |
| D | 34783 | 4578 | 13.161602% |
Noise dominated data is calculated using 1-second bins in cleaned event files. If a bin has >2000 counts, and if more than 50% of those come from <1% of pixels, then it is considered to be noise-dominated and hence unusable.
| Quadrant | # 1 sec bins | Bins with >0 counts | Bins with >2000 counts | High rate bins dominated by noise | Noise dominated (total time) | Noise dominated (detector-on time) | Marked lightcurve |
|---|---|---|---|---|---|---|---|
| A | 122197 | 34975 | 0 | 0 | 0.00% | 0.00% |  |
| B | 122199 | 34860 | 0 | 0 | 0.00% | 0.00% |  |
| C | 122199 | 34934 | 0 | 0 | 0.00% | 0.00% |  |
| D | 122198 | 34850 | 0 | 0 | 0.00% | 0.00% |  |
Top three noisy pixels from each quadrant. If the there are fewer than three noisy pixels in the level2.evt file, extra rows are filled as -1
| Pixel properties | Quadrant properties | ||||||
|---|---|---|---|---|---|---|---|
| Quadrant | DetID | PixID | Counts | Sigma | Mean | Median | Sigma |
| A | 0 | 29 | 1662 | 9.13 | 519 | 488 | 128.6 |
| A | 9 | 19 | 1619 | 8.8 | 519 | 488 | 128.6 |
| A | 7 | 110 | 1611 | 8.73 | 519 | 488 | 128.6 |
| B | 2 | 9 | 1556 | 10.76 | 490 | 466 | 101.3 |
| B | 3 | 80 | 1445 | 9.67 | 490 | 466 | 101.3 |
| B | 2 | 8 | 1272 | 7.96 | 490 | 466 | 101.3 |
| C | 1 | 81 | 1823 | 10.33 | 507 | 476 | 130.4 |
| C | 1 | 80 | 1715 | 9.5 | 507 | 476 | 130.4 |
| C | 1 | 65 | 1372 | 6.87 | 507 | 476 | 130.4 |
| D | 10 | 113 | 1166 | 6.23 | 444 | 405 | 122.2 |
| D | 15 | 47 | 1158 | 6.16 | 444 | 405 | 122.2 |
| D | 4 | 160 | 1149 | 6.09 | 444 | 405 | 122.2 |
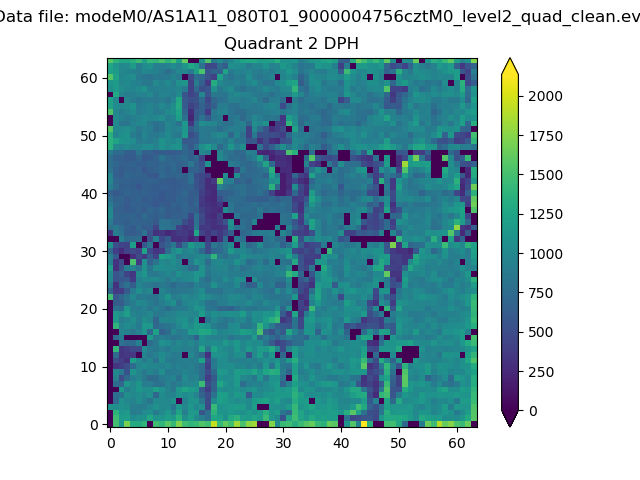
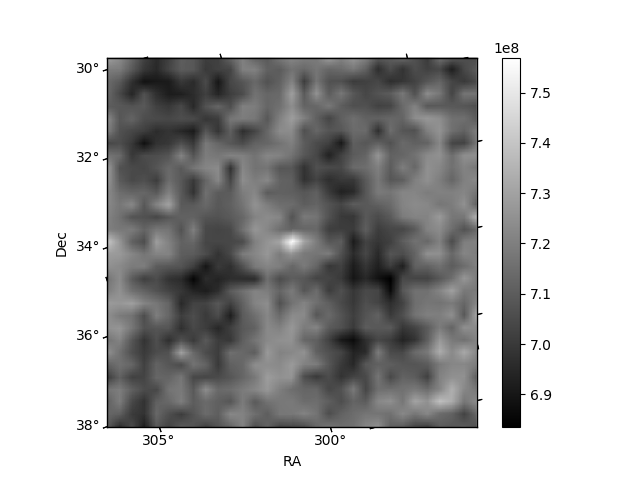
Histogram calculated using DETX and DETY for each event in the final _common_clean file
| Quadrant A | 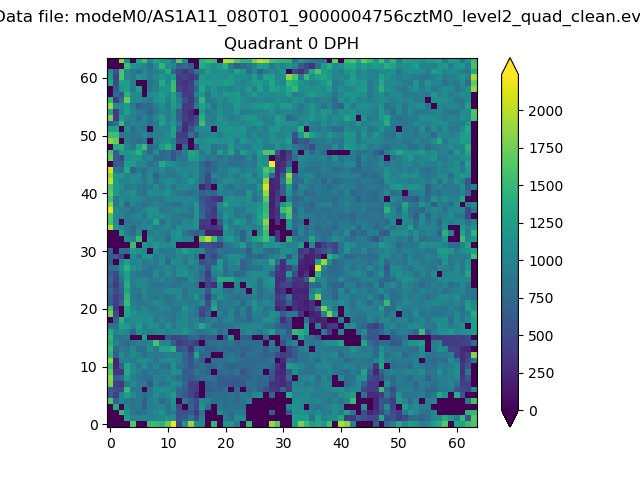 |
 |
Quadrant B |
|---|---|---|---|
| Quadrant D |  |
 |
Quadrant C |
| Plot type | Count rate plots | Images |
|---|---|---|
| Comparison with Poisson distribution Blue bars denote a histogram of data divided into 1 sec bins. Red curve is a Poisson curve with rate = median count rate of data. |
 |
 |
| Quadrant-wise count rates Data is divided into 100 sec bins |
 |
|
| Module-wise count rates for Quadrant A Data is divided into 100 sec bins |
 |
 |
| Module-wise count rates for Quadrant B Data is divided into 100 sec bins |
 |
 |
| Module-wise count rates for Quadrant C Data is divided into 100 sec bins |
 |
 |
| Module-wise count rates for Quadrant D Data is divided into 100 sec bins |
 |
 |
| Parameter | Plot |
|---|---|
| CZT HV Monitor |  |
| D_VDD |  |
| Temperature 1 |  |
| Veto HV Monitor |  |
| Veto LLD |  |
| Alpha Counter |  |
| _CPM_Rate | 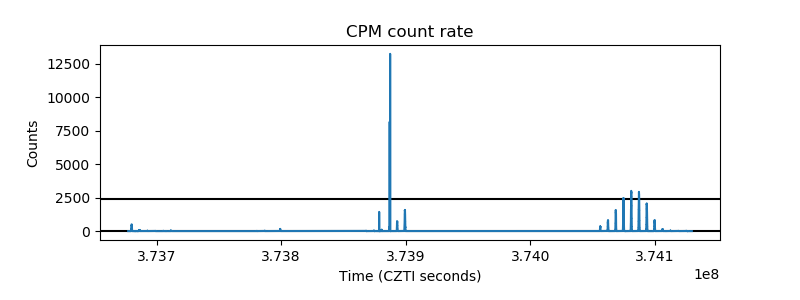 |
| CZT Counter |  |
| +2.5 Volts monitor |  |
| +5 Volts monitor |  |
| _ROLL_ROT |  |
| _Roll_DEC |  |
| _Roll_RA |  |
| Veto Counter |  |