| Param | Original file | Final file |
|---|---|---|
| Filename | modeM0/AS1A11_080T01_9000004756_32991cztM0_level2.evt | modeM0/AS1A11_080T01_9000004756_32991cztM0_level2_quad_clean.evt |
| Size (bytes) | 230,276,160 | 39,476,160 |
| Size | 219.6 MB | 37.6 MB |
| Events in quadrant A | 1,354,173 | 254,830 |
| Events in quadrant B | 1,829,553 | 252,912 |
| Events in quadrant C | 1,465,665 | 253,885 |
| Events in quadrant D | 2,131,736 | 232,492 |
| Mode SS | |||
|---|---|---|---|
| Quadrant | BADHDUFLAG | Total packets | Discarded packets |
| A | 0 | 58 | 0 |
| B | 0 | 58 | 0 |
| C | 0 | 58 | 0 |
| D | 0 | 58 | 0 |
| Mode M9 | |||
|---|---|---|---|
| Quadrant | BADHDUFLAG | Total packets | Discarded packets |
| A | 0 | 21 | 0 |
| B | 0 | 21 | 0 |
| C | 0 | 21 | 0 |
| D | 0 | 21 | 0 |
| Mode M0 | |||
|---|---|---|---|
| Quadrant | BADHDUFLAG | Total packets | Discarded packets |
| A | 0 | 5715 | 2 |
| B | 0 | 7185 | 1 |
| C | 0 | 6113 | 1 |
| D | 0 | 8274 | 1 |
| Quadrant | Total seconds | Saturated seconds | Saturation percentage |
|---|---|---|---|
| A | 2813 | 7 | 0.248845% |
| B | 2813 | 131 | 4.656950% |
| C | 2813 | 46 | 1.635265% |
| D | 2813 | 105 | 3.732670% |
Noise dominated data is calculated using 1-second bins in cleaned event files. If a bin has >2000 counts, and if more than 50% of those come from <1% of pixels, then it is considered to be noise-dominated and hence unusable.
| Quadrant | # 1 sec bins | Bins with >0 counts | Bins with >2000 counts | High rate bins dominated by noise | Noise dominated (total time) | Noise dominated (detector-on time) | Marked lightcurve |
|---|---|---|---|---|---|---|---|
| A | 4876 | 2814 | 1 | 1 | 0.02% | 0.04% | 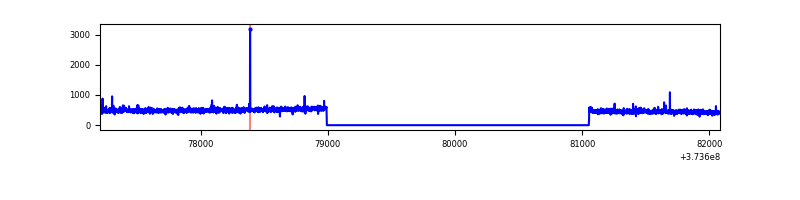 |
| B | 4876 | 2814 | 74 | 74 | 1.52% | 2.63% | 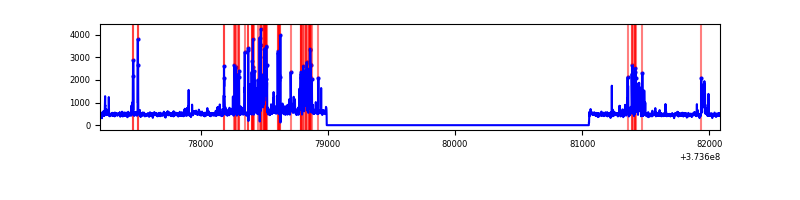 |
| C | 4876 | 2814 | 37 | 37 | 0.76% | 1.31% | 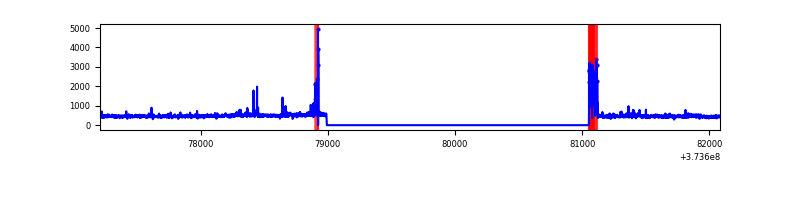 |
| D | 4876 | 2814 | 84 | 84 | 1.72% | 2.99% | 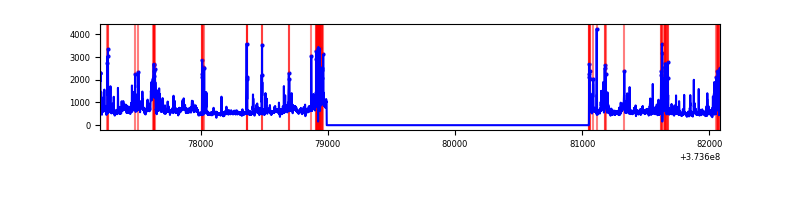 |
Top three noisy pixels from each quadrant. If the there are fewer than three noisy pixels in the level2.evt file, extra rows are filled as -1
| Pixel properties | Quadrant properties | ||||||
|---|---|---|---|---|---|---|---|
| Quadrant | DetID | PixID | Counts | Sigma | Mean | Median | Sigma |
| A | 9 | 143 | 9505 | 132.34 | 343 | 337 | 69.3 |
| A | 15 | 47 | 8782 | 121.9 | 343 | 337 | 69.3 |
| A | 7 | 191 | 5433 | 73.56 | 343 | 337 | 69.3 |
| B | 5 | 172 | 363327 | 5620.98 | 337 | 330 | 64.6 |
| B | 0 | 229 | 46838 | 720.17 | 337 | 330 | 64.6 |
| B | 0 | 197 | 20640 | 314.5 | 337 | 330 | 64.6 |
| C | 0 | 10 | 111589 | 1449.32 | 329 | 333 | 76.8 |
| C | 1 | 241 | 41023 | 530.06 | 329 | 333 | 76.8 |
| C | 14 | 67 | 16912 | 215.97 | 329 | 333 | 76.8 |
| D | 8 | 195 | 356675 | 4199.66 | 322 | 316 | 84.9 |
| D | 2 | 250 | 223621 | 2631.63 | 322 | 316 | 84.9 |
| D | 2 | 120 | 74641 | 875.91 | 322 | 316 | 84.9 |
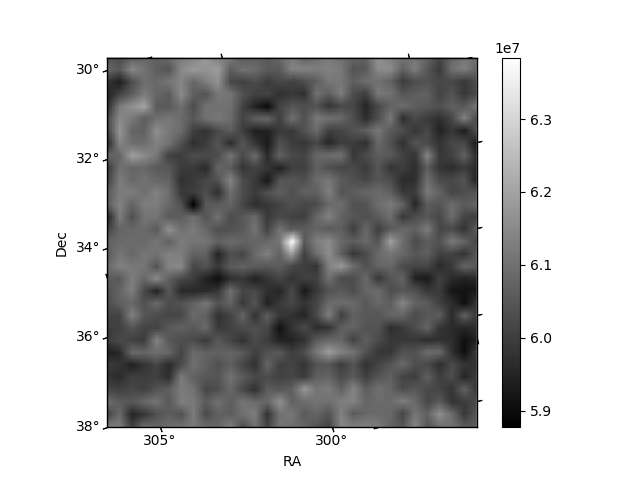
Histogram calculated using DETX and DETY for each event in the final _common_clean file
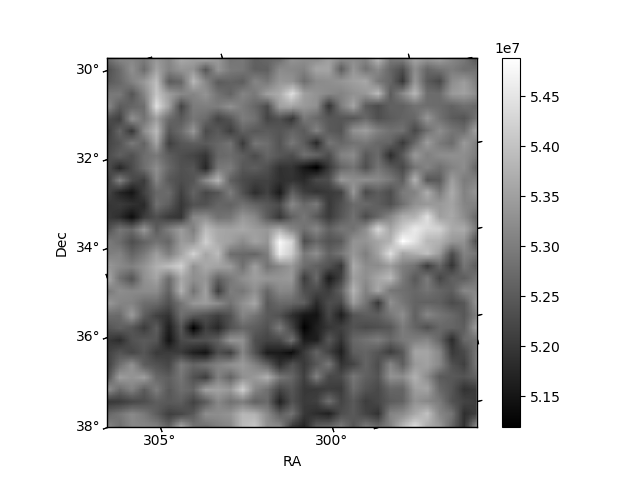
| Quadrant A |  |
 |
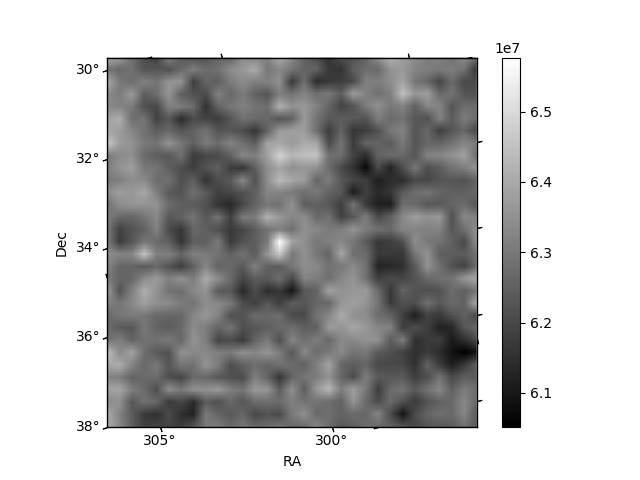
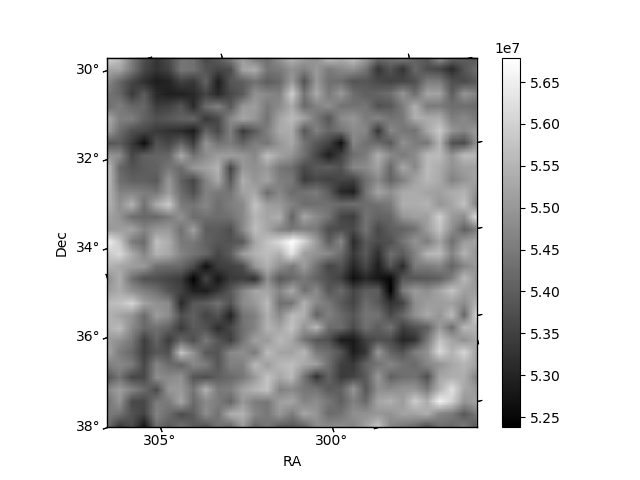
Quadrant B |
|---|---|---|---|
| Quadrant D | 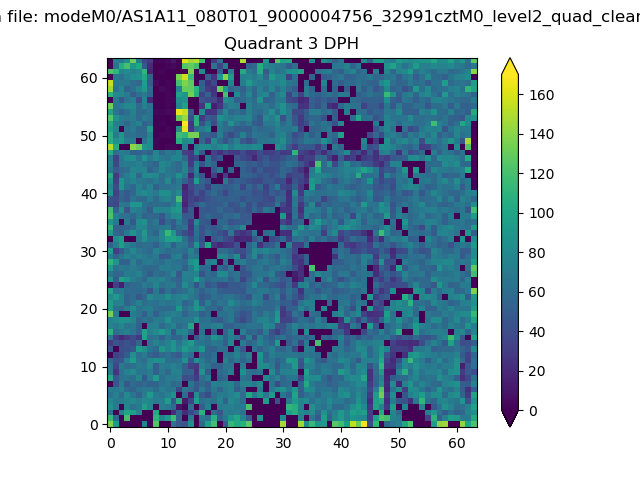 |
 |
Quadrant C |
| Plot type | Count rate plots | Images |
|---|---|---|
| Comparison with Poisson distribution Blue bars denote a histogram of data divided into 1 sec bins. Red curve is a Poisson curve with rate = median count rate of data. |
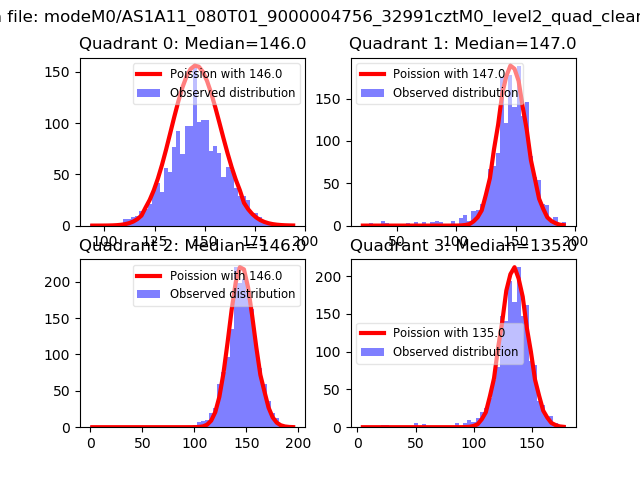 |
 |
| Quadrant-wise count rates Data is divided into 100 sec bins |
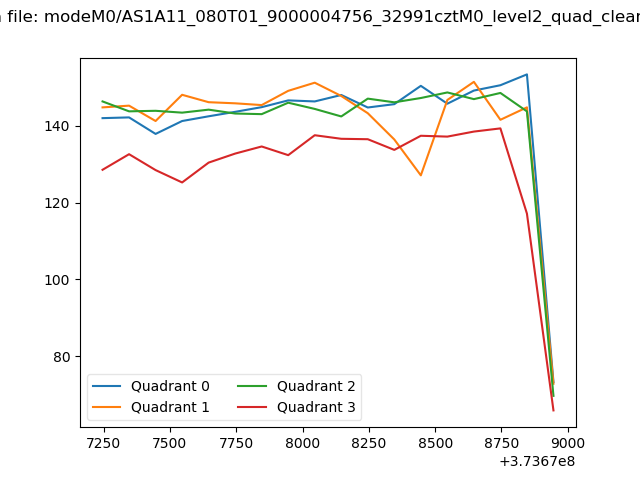 |
|
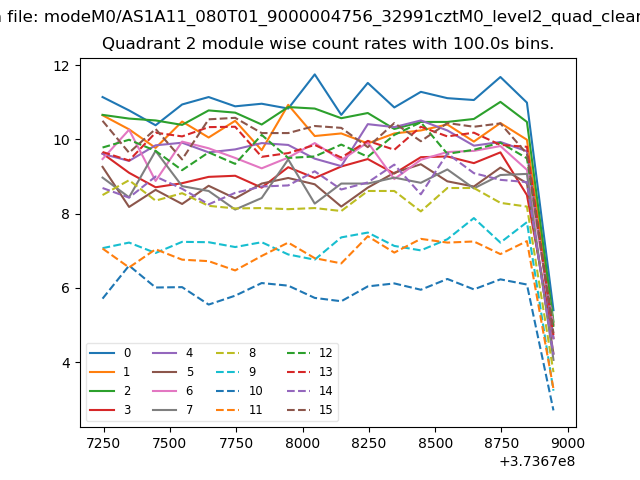
| Module-wise count rates for Quadrant A Data is divided into 100 sec bins |
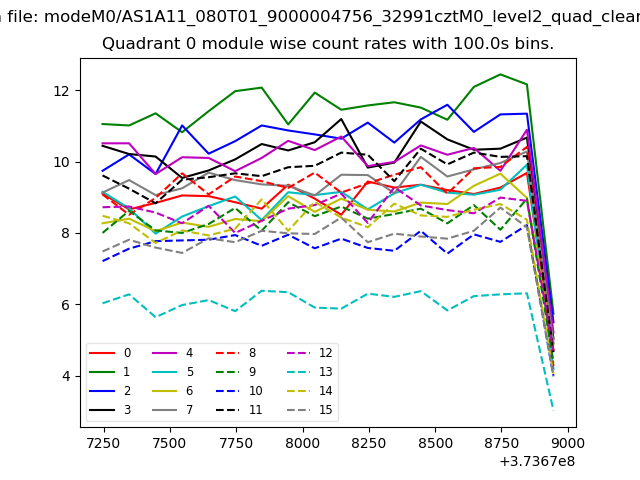 |
 |
| Module-wise count rates for Quadrant B Data is divided into 100 sec bins |
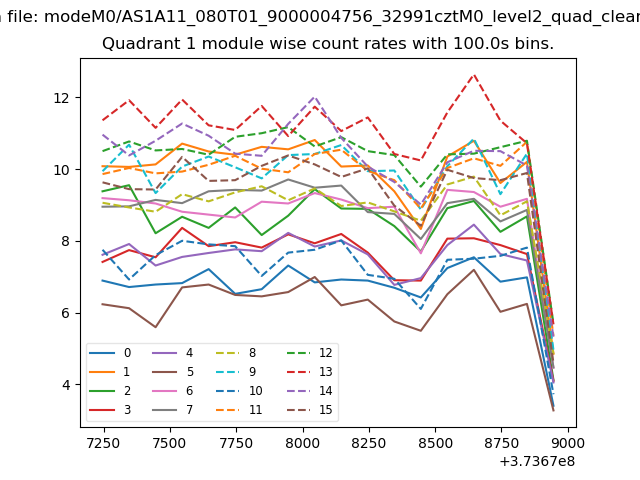 |
 |
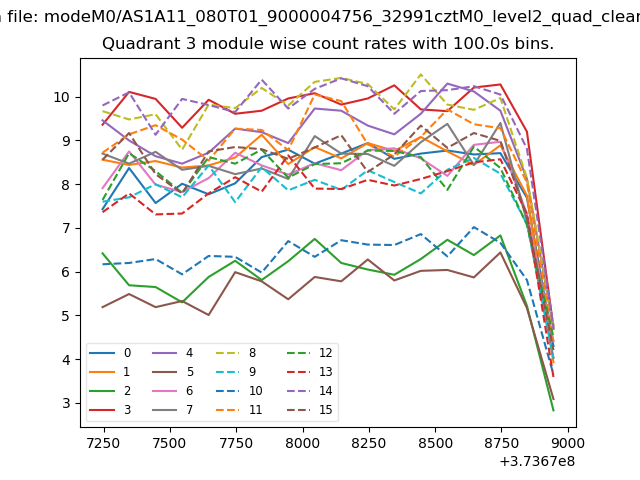
| Module-wise count rates for Quadrant C Data is divided into 100 sec bins |
 |
 |
| Module-wise count rates for Quadrant D Data is divided into 100 sec bins |
 |
 |
| Parameter | Plot |
|---|---|
| CZT HV Monitor | 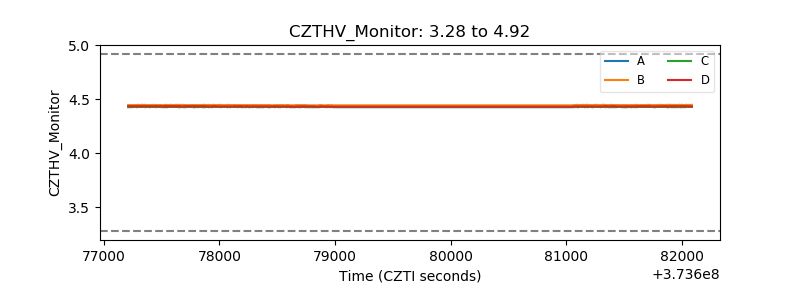 |
| D_VDD | 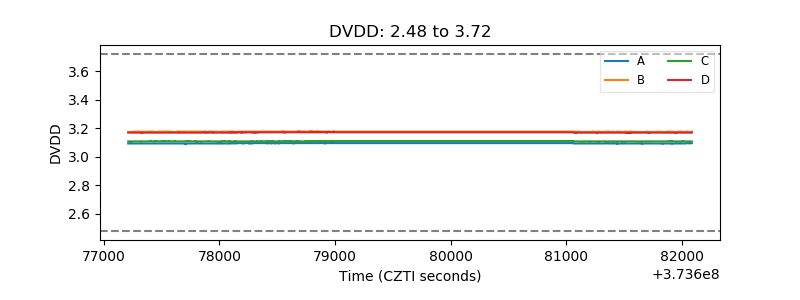 |
| Temperature 1 | 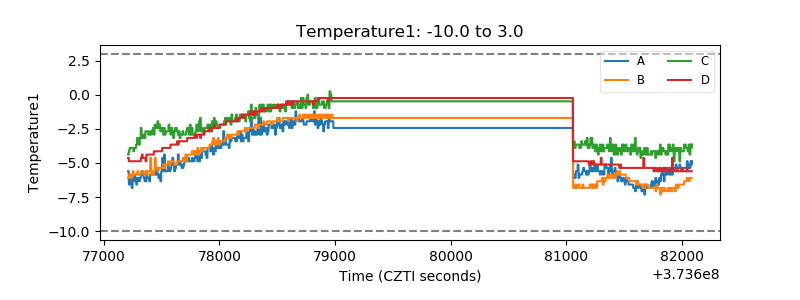 |
| Veto HV Monitor | 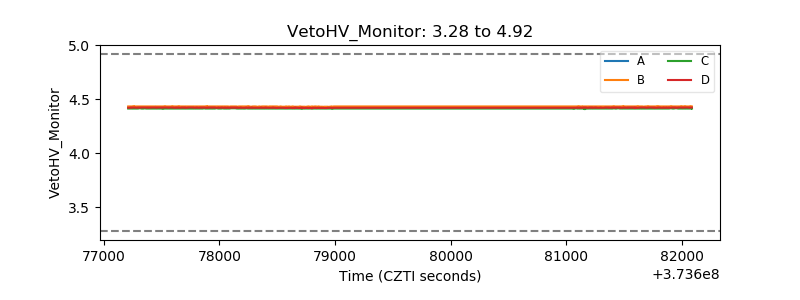 |
| Veto LLD | 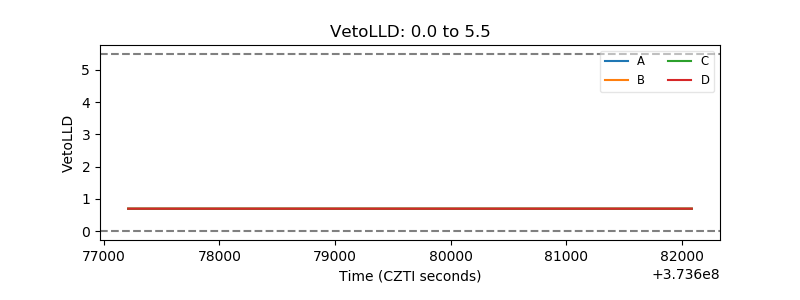 |
| Alpha Counter | 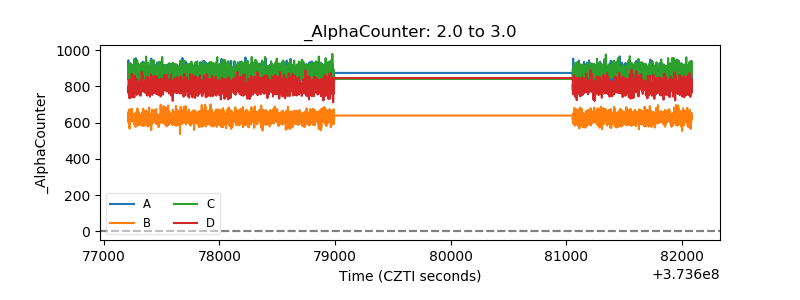 |
| _CPM_Rate | 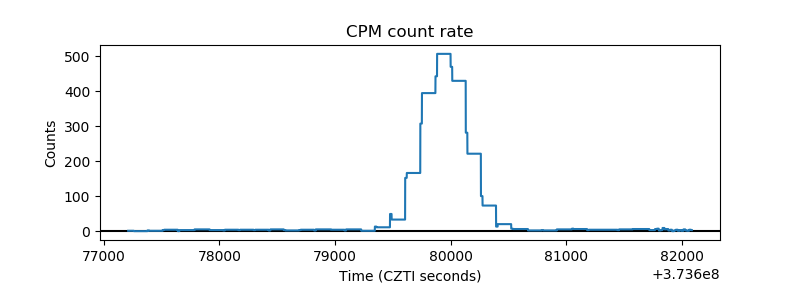 |
| CZT Counter | 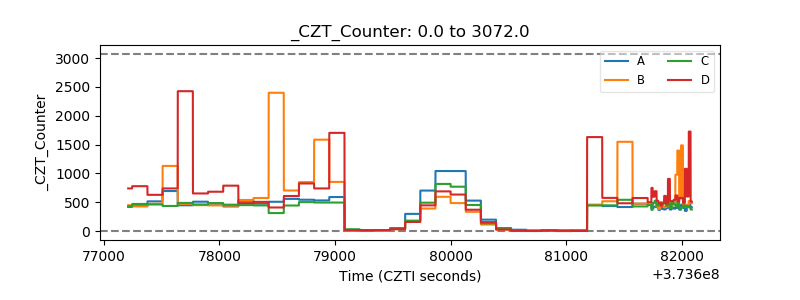 |
| +2.5 Volts monitor |  |
| +5 Volts monitor |  |
| _ROLL_ROT | 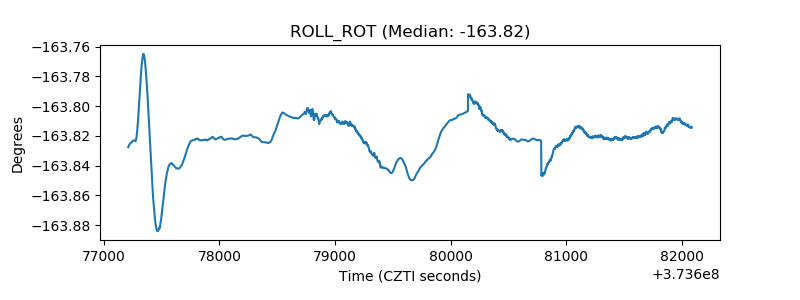 |
| _Roll_DEC | 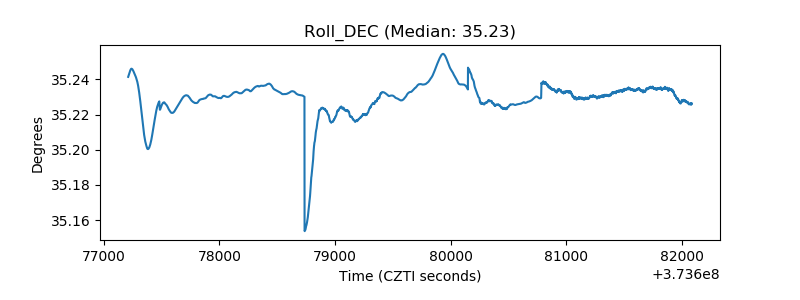 |
| _Roll_RA | 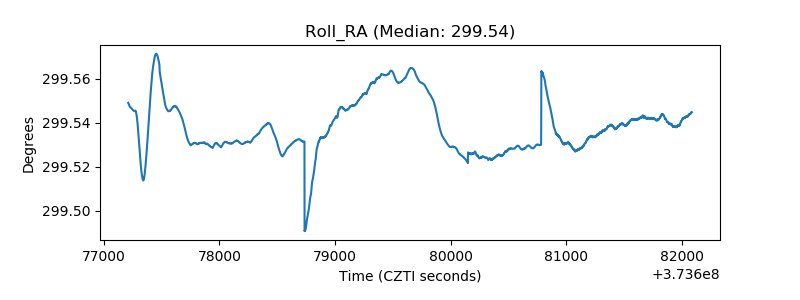 |
| Veto Counter | 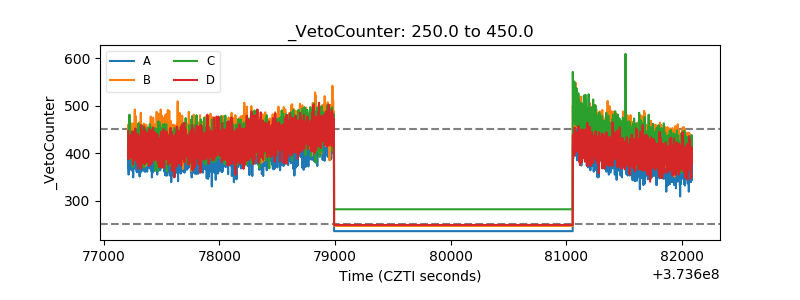 |