| Param | Original file | Final file |
|---|---|---|
| Filename | modeM0/AS1A11_080T01_9000004756_32993cztM0_level2.evt | modeM0/AS1A11_080T01_9000004756_32993cztM0_level2_quad_clean.evt |
| Size (bytes) | 437,405,760 | 72,380,160 |
| Size | 417.1 MB | 69.0 MB |
| Events in quadrant A | 2,593,995 | 479,032 |
| Events in quadrant B | 3,657,748 | 444,300 |
| Events in quadrant C | 2,678,787 | 447,475 |
| Events in quadrant D | 3,937,398 | 430,794 |
| Mode SS | |||
|---|---|---|---|
| Quadrant | BADHDUFLAG | Total packets | Discarded packets |
| A | 0 | 114 | 0 |
| B | 0 | 114 | 0 |
| C | 0 | 114 | 0 |
| D | 0 | 114 | 0 |
| Mode M9 | |||
|---|---|---|---|
| Quadrant | BADHDUFLAG | Total packets | Discarded packets |
| A | 0 | 20 | 0 |
| B | 0 | 20 | 0 |
| C | 0 | 20 | 0 |
| D | 0 | 21 | 0 |
| Mode M0 | |||
|---|---|---|---|
| Quadrant | BADHDUFLAG | Total packets | Discarded packets |
| A | 0 | 11410 | 3 |
| B | 0 | 14516 | 2 |
| C | 0 | 11626 | 2 |
| D | 0 | 15309 | 2 |
| Quadrant | Total seconds | Saturated seconds | Saturation percentage |
|---|---|---|---|
| A | 5573 | 5 | 0.089718% |
| B | 5573 | 323 | 5.795801% |
| C | 5573 | 61 | 1.094563% |
| D | 5573 | 150 | 2.691549% |
Noise dominated data is calculated using 1-second bins in cleaned event files. If a bin has >2000 counts, and if more than 50% of those come from <1% of pixels, then it is considered to be noise-dominated and hence unusable.
| Quadrant | # 1 sec bins | Bins with >0 counts | Bins with >2000 counts | High rate bins dominated by noise | Noise dominated (total time) | Noise dominated (detector-on time) | Marked lightcurve |
|---|---|---|---|---|---|---|---|
| A | 7035 | 5574 | 1 | 1 | 0.01% | 0.02% |  |
| B | 7035 | 5574 | 226 | 226 | 3.21% | 4.05% |  |
| C | 7035 | 5574 | 27 | 27 | 0.38% | 0.48% | 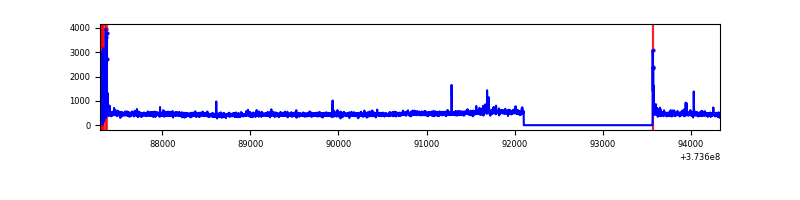 |
| D | 7035 | 5574 | 117 | 117 | 1.66% | 2.10% | 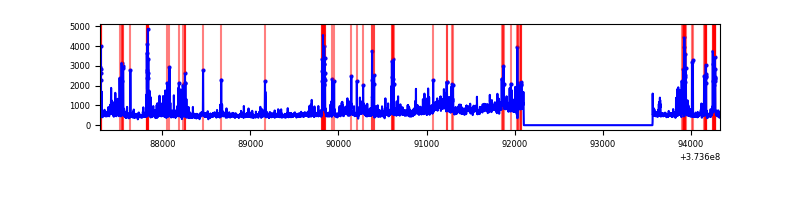 |
Top three noisy pixels from each quadrant. If the there are fewer than three noisy pixels in the level2.evt file, extra rows are filled as -1
| Pixel properties | Quadrant properties | ||||||
|---|---|---|---|---|---|---|---|
| Quadrant | DetID | PixID | Counts | Sigma | Mean | Median | Sigma |
| A | 15 | 47 | 18919 | 136.18 | 661 | 649 | 134.2 |
| A | 13 | 254 | 10120 | 70.59 | 661 | 649 | 134.2 |
| A | 13 | 6 | 8485 | 58.41 | 661 | 649 | 134.2 |
| B | 5 | 172 | 955266 | 7722.4 | 640 | 623 | 123.6 |
| B | 0 | 219 | 64311 | 515.19 | 640 | 623 | 123.6 |
| B | 0 | 229 | 41527 | 330.89 | 640 | 623 | 123.6 |
| C | 0 | 10 | 158843 | 1079.32 | 630 | 637 | 146.6 |
| C | 14 | 67 | 41742 | 280.43 | 630 | 637 | 146.6 |
| C | 3 | 233 | 13675 | 88.95 | 630 | 637 | 146.6 |
| D | 8 | 195 | 607667 | 3575.0 | 627 | 615 | 169.8 |
| D | 2 | 250 | 423120 | 2488.18 | 627 | 615 | 169.8 |
| D | 2 | 249 | 138160 | 810.02 | 627 | 615 | 169.8 |
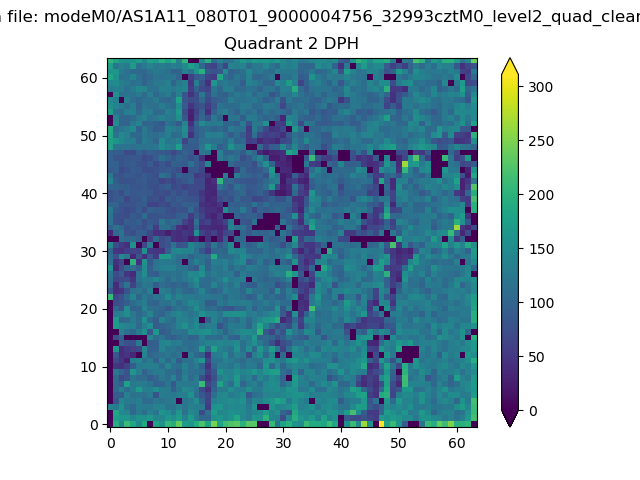
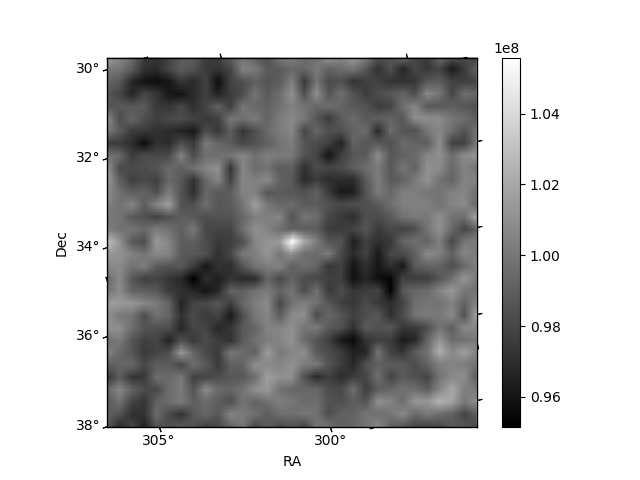
Histogram calculated using DETX and DETY for each event in the final _common_clean file
| Quadrant A | 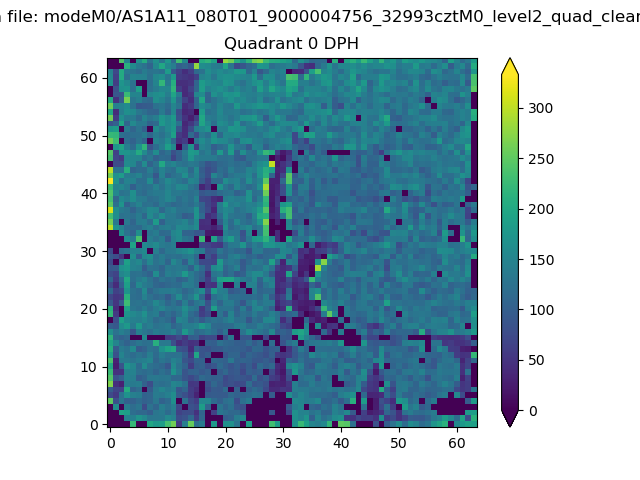 |
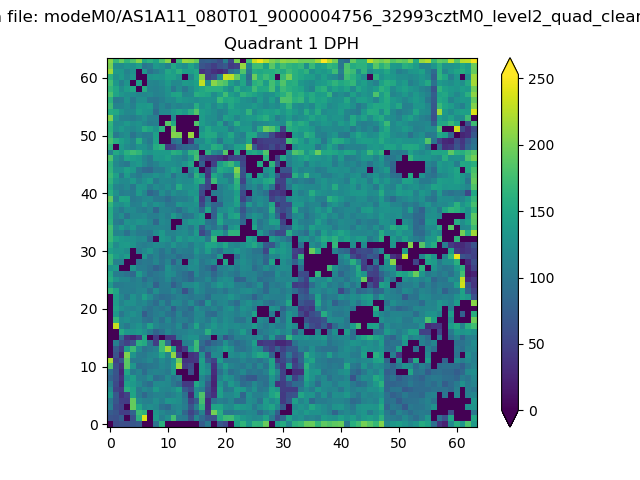 |
Quadrant B |
|---|---|---|---|
| Quadrant D | 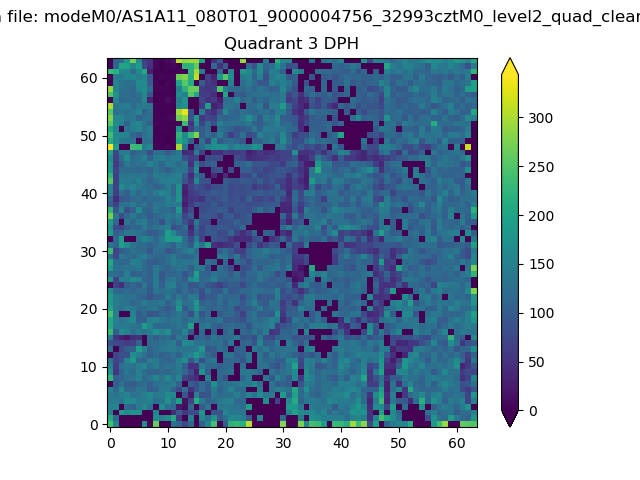 |
 |
Quadrant C |
| Plot type | Count rate plots | Images |
|---|---|---|
| Comparison with Poisson distribution Blue bars denote a histogram of data divided into 1 sec bins. Red curve is a Poisson curve with rate = median count rate of data. |
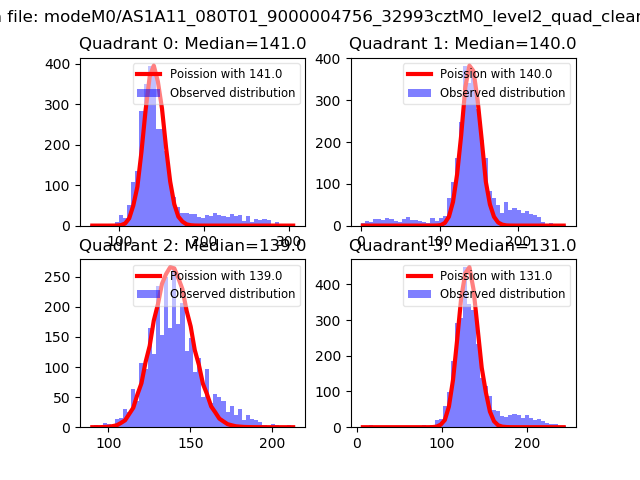 |
 |
| Quadrant-wise count rates Data is divided into 100 sec bins |
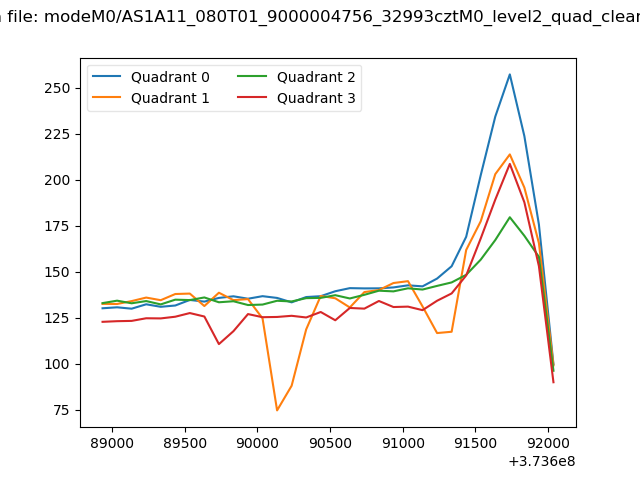 |
|
| Module-wise count rates for Quadrant A Data is divided into 100 sec bins |
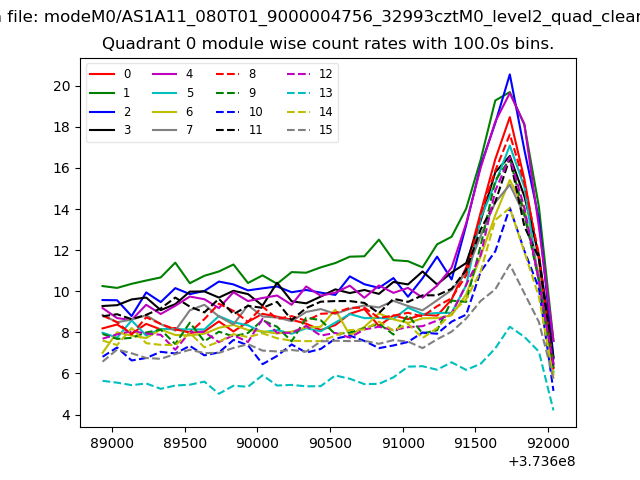 |
 |
| Module-wise count rates for Quadrant B Data is divided into 100 sec bins |
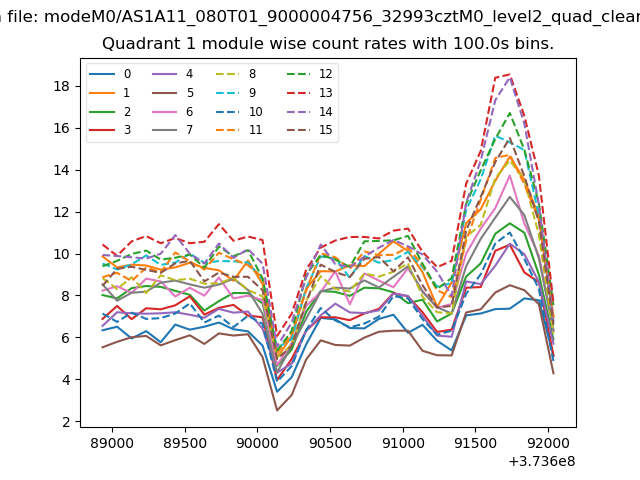 |
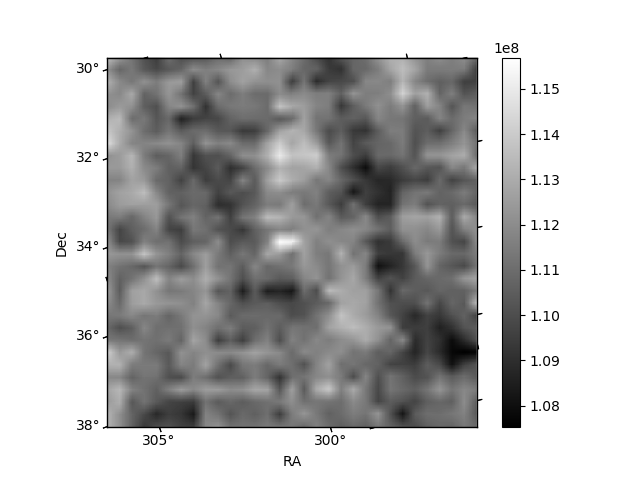 |
| Module-wise count rates for Quadrant C Data is divided into 100 sec bins |
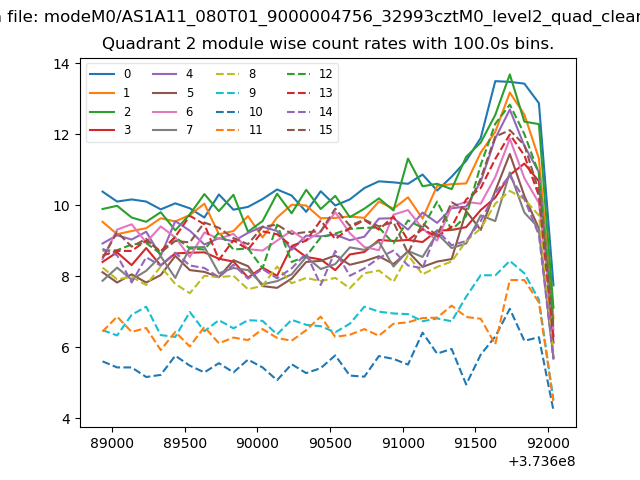 |
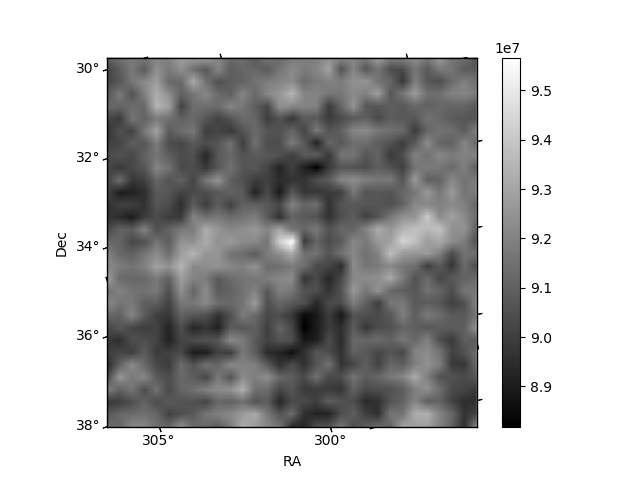 |
| Module-wise count rates for Quadrant D Data is divided into 100 sec bins |
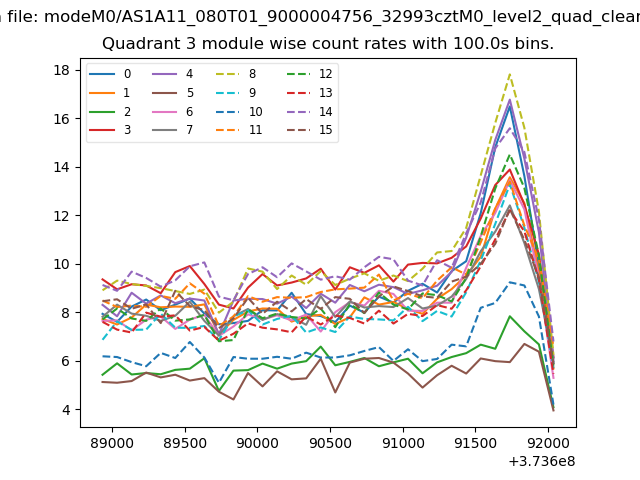 |
 |
| Parameter | Plot |
|---|---|
| CZT HV Monitor | 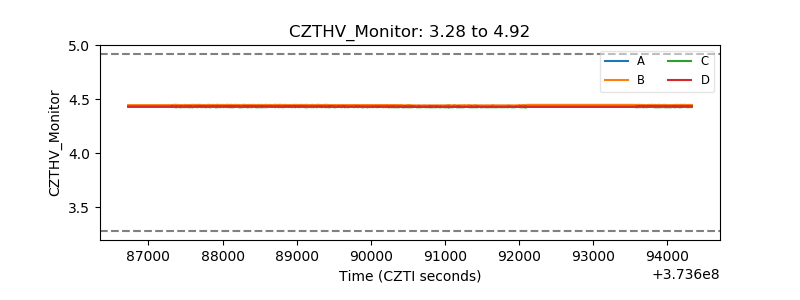 |
| D_VDD | 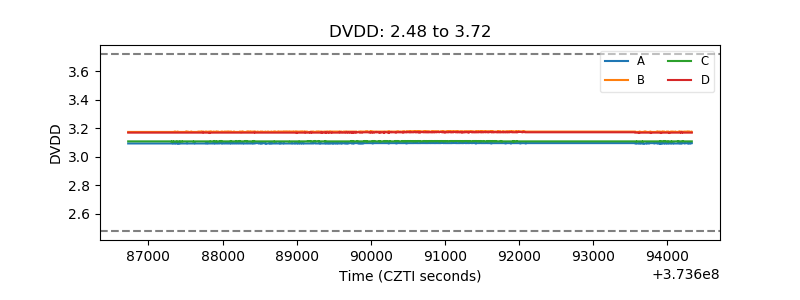 |
| Temperature 1 | 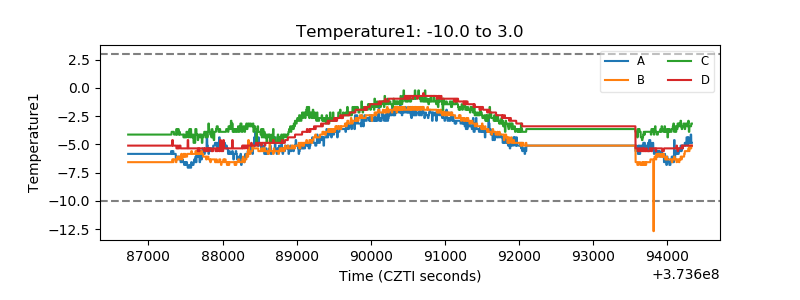 |
| Veto HV Monitor | 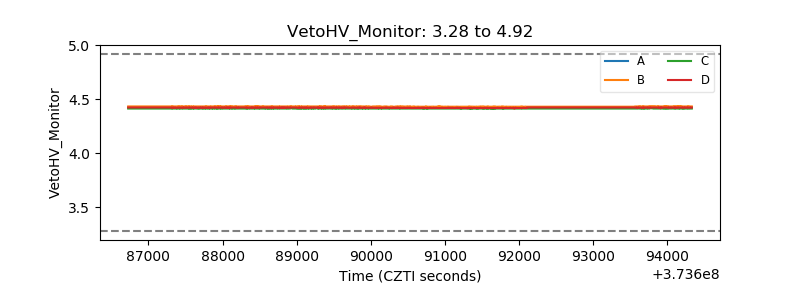 |
| Veto LLD | 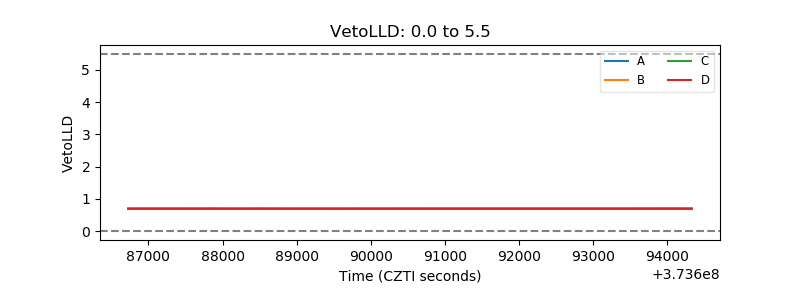 |
| Alpha Counter | 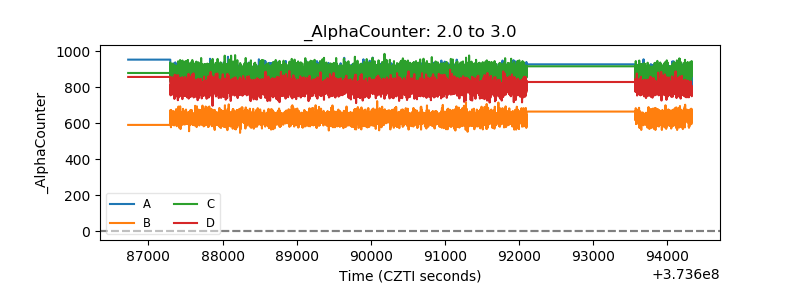 |
| _CPM_Rate | 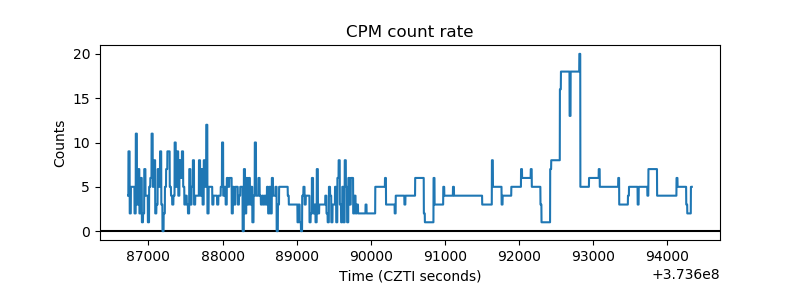 |
| CZT Counter | 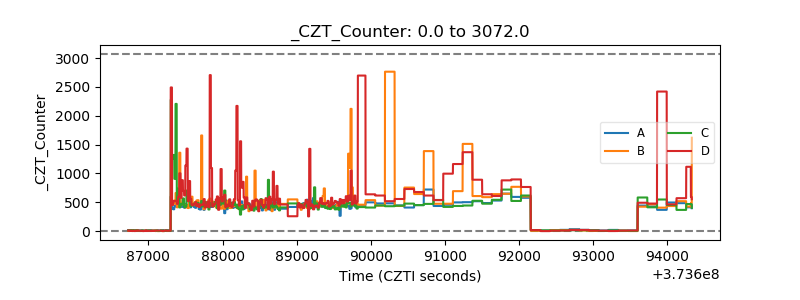 |
| +2.5 Volts monitor | 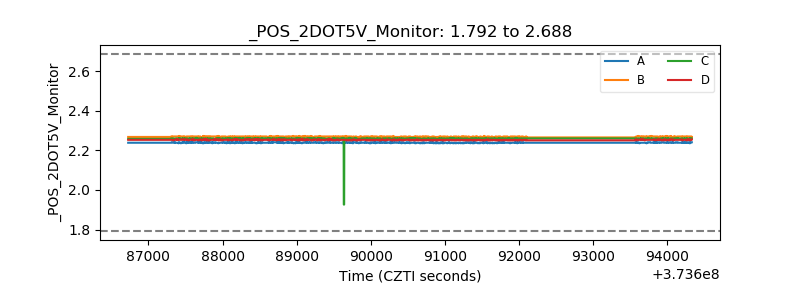 |
| +5 Volts monitor |  |
| _ROLL_ROT | 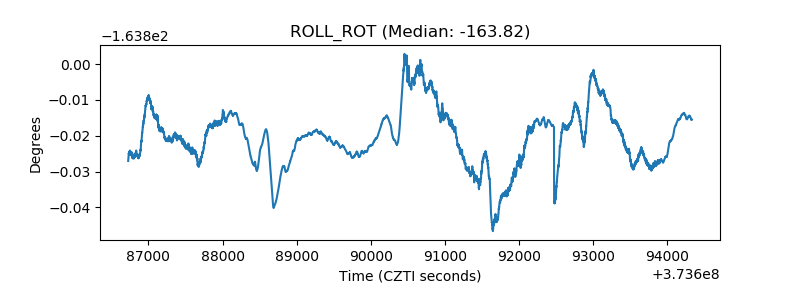 |
| _Roll_DEC | 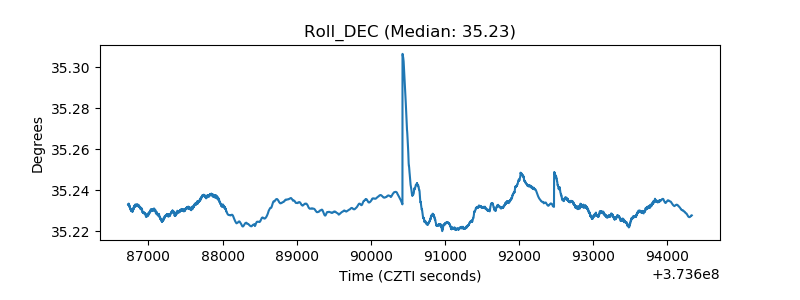 |
| _Roll_RA | 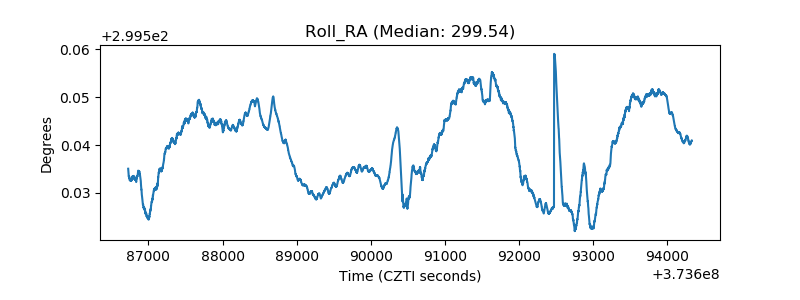 |
| Veto Counter | 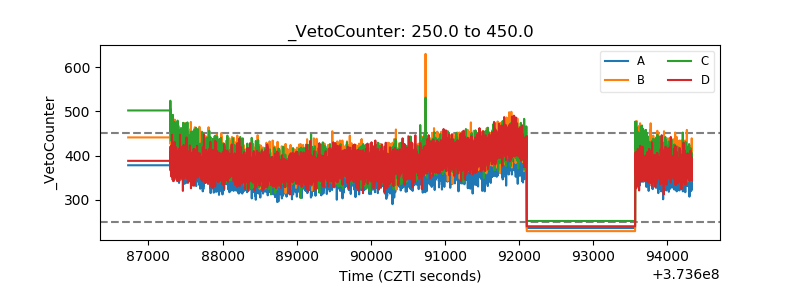 |