| Param | Original file | Final file |
|---|---|---|
| Filename | modeM0/AS1A11_080T01_9000004756_32994cztM0_level2.evt | modeM0/AS1A11_080T01_9000004756_32994cztM0_level2_quad_clean.evt |
| Size (bytes) | 591,500,160 | 84,401,280 |
| Size | 564.1 MB | 80.5 MB |
| Events in quadrant A | 2,780,692 | 572,105 |
| Events in quadrant B | 3,474,029 | 560,941 |
| Events in quadrant C | 3,060,533 | 553,060 |
| Events in quadrant D | 8,189,403 | 447,342 |
| Mode SS | |||
|---|---|---|---|
| Quadrant | BADHDUFLAG | Total packets | Discarded packets |
| A | 0 | 122 | 0 |
| B | 0 | 122 | 0 |
| C | 0 | 122 | 0 |
| D | 0 | 122 | 0 |
| Mode M9 | |||
|---|---|---|---|
| Quadrant | BADHDUFLAG | Total packets | Discarded packets |
| A | 0 | 29 | 0 |
| B | 0 | 29 | 0 |
| C | 0 | 29 | 0 |
| D | 0 | 29 | 0 |
| Mode M0 | |||
|---|---|---|---|
| Quadrant | BADHDUFLAG | Total packets | Discarded packets |
| A | 0 | 12180 | 3 |
| B | 0 | 14235 | 2 |
| C | 0 | 13022 | 2 |
| D | 0 | 28458 | 2 |
| Quadrant | Total seconds | Saturated seconds | Saturation percentage |
|---|---|---|---|
| A | 6050 | 3 | 0.049587% |
| B | 6050 | 114 | 1.884298% |
| C | 6050 | 37 | 0.611570% |
| D | 6050 | 1419 | 23.454545% |
Noise dominated data is calculated using 1-second bins in cleaned event files. If a bin has >2000 counts, and if more than 50% of those come from <1% of pixels, then it is considered to be noise-dominated and hence unusable.
| Quadrant | # 1 sec bins | Bins with >0 counts | Bins with >2000 counts | High rate bins dominated by noise | Noise dominated (total time) | Noise dominated (detector-on time) | Marked lightcurve |
|---|---|---|---|---|---|---|---|
| A | 8824 | 6052 | 0 | 0 | 0.00% | 0.00% | 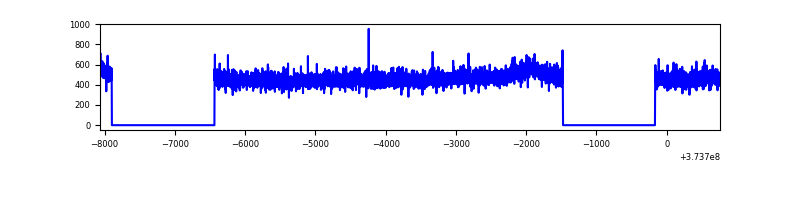 |
| B | 8824 | 6052 | 84 | 84 | 0.95% | 1.39% | 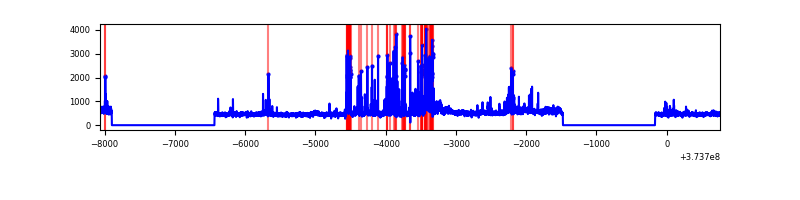 |
| C | 8824 | 6052 | 21 | 21 | 0.24% | 0.35% | 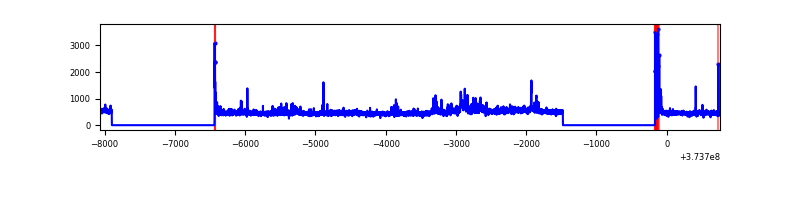 |
| D | 8824 | 6052 | 1372 | 1372 | 15.55% | 22.67% | 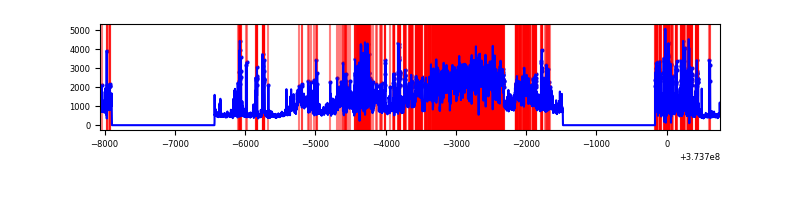 |
Top three noisy pixels from each quadrant. If the there are fewer than three noisy pixels in the level2.evt file, extra rows are filled as -1
| Pixel properties | Quadrant properties | ||||||
|---|---|---|---|---|---|---|---|
| Quadrant | DetID | PixID | Counts | Sigma | Mean | Median | Sigma |
| A | 13 | 254 | 11315 | 73.52 | 714 | 700 | 144.4 |
| A | 15 | 47 | 9215 | 58.98 | 714 | 700 | 144.4 |
| A | 3 | 137 | 6371 | 39.28 | 714 | 700 | 144.4 |
| B | 5 | 172 | 487559 | 3624.14 | 707 | 692 | 134.3 |
| B | 0 | 219 | 86049 | 635.38 | 707 | 692 | 134.3 |
| B | 15 | 85 | 36735 | 268.3 | 707 | 692 | 134.3 |
| C | 0 | 10 | 241730 | 1489.24 | 689 | 696 | 161.8 |
| C | 1 | 23 | 58267 | 355.7 | 689 | 696 | 161.8 |
| C | 14 | 67 | 30083 | 181.57 | 689 | 696 | 161.8 |
| D | 12 | 227 | 2209634 | 13382.79 | 621 | 610 | 165.1 |
| D | 8 | 195 | 1877318 | 11369.54 | 621 | 610 | 165.1 |
| D | 12 | 6 | 420208 | 2542.02 | 621 | 610 | 165.1 |
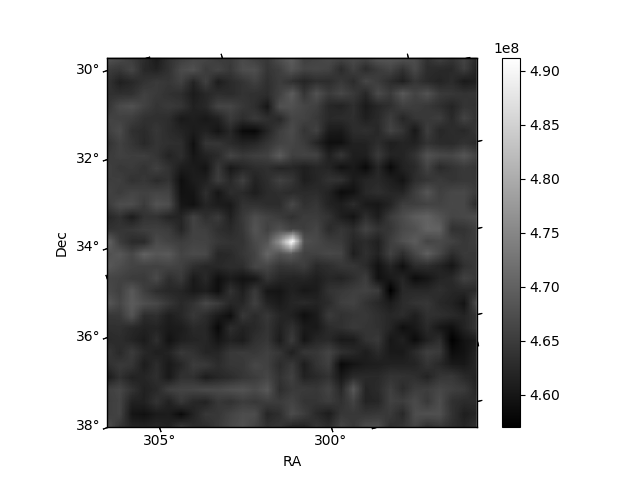
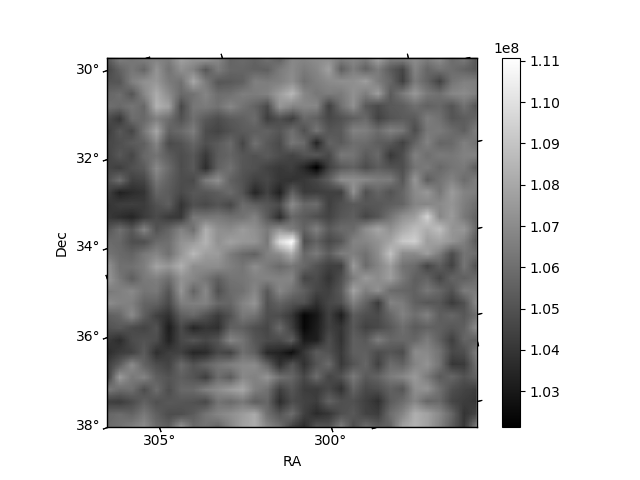
Histogram calculated using DETX and DETY for each event in the final _common_clean file
| Quadrant A | 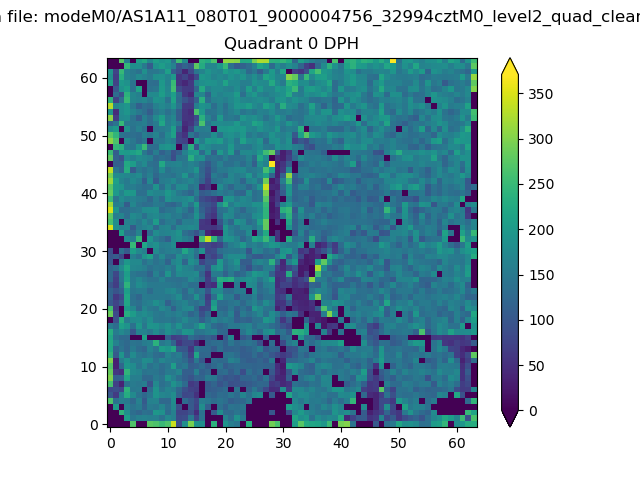 |
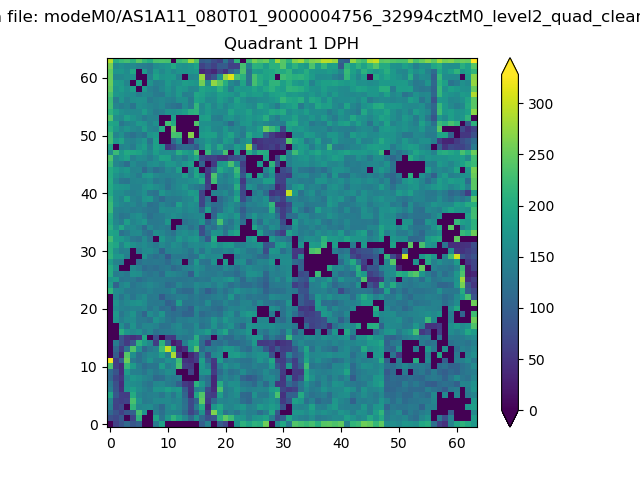 |
Quadrant B |
|---|---|---|---|
| Quadrant D | 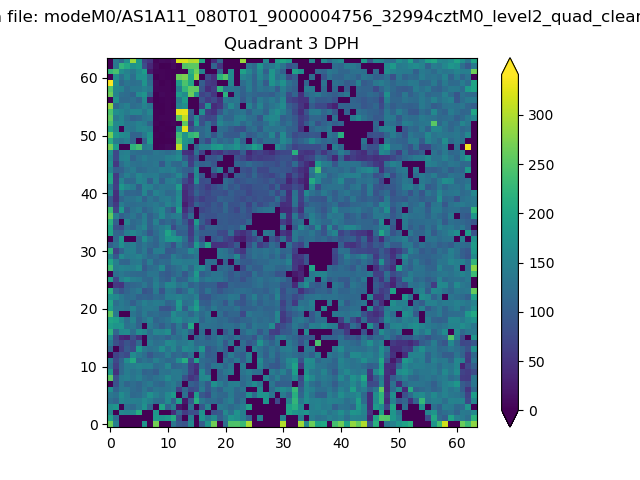 |
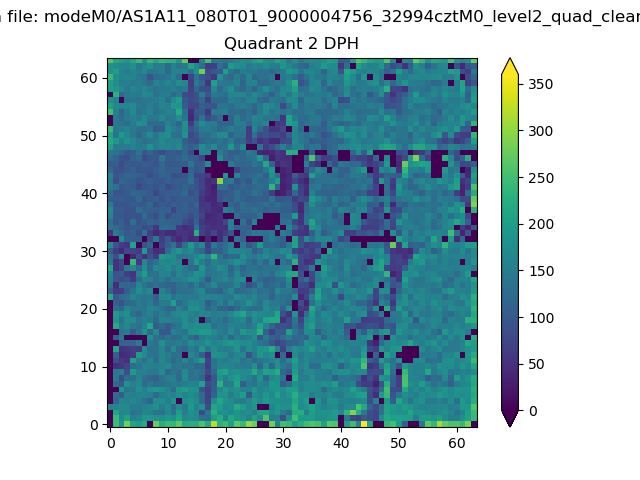 |
Quadrant C |
| Plot type | Count rate plots | Images |
|---|---|---|
| Comparison with Poisson distribution Blue bars denote a histogram of data divided into 1 sec bins. Red curve is a Poisson curve with rate = median count rate of data. |
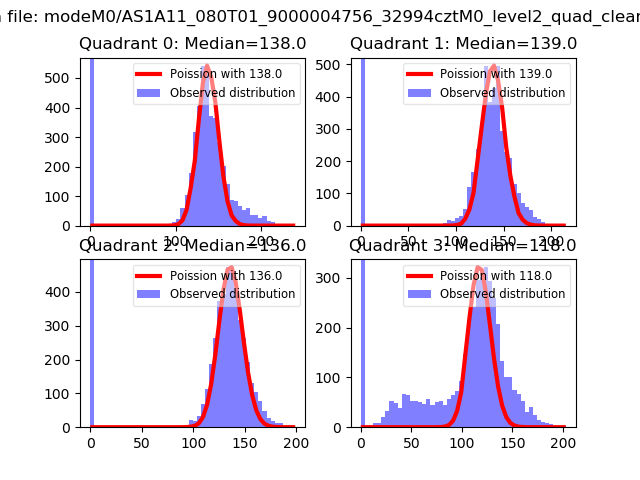 |
 |
| Quadrant-wise count rates Data is divided into 100 sec bins |
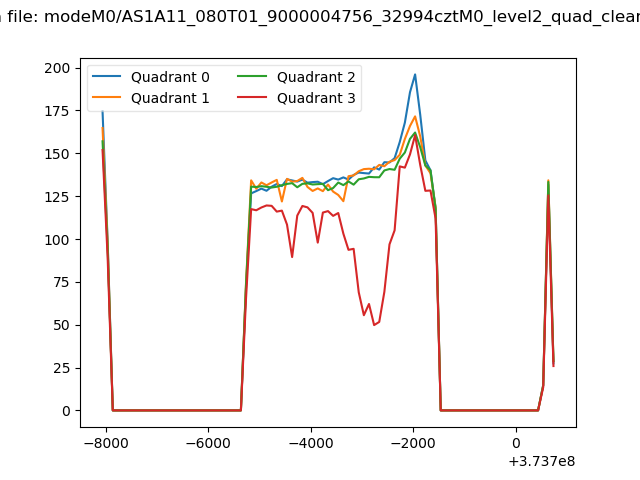 |
|
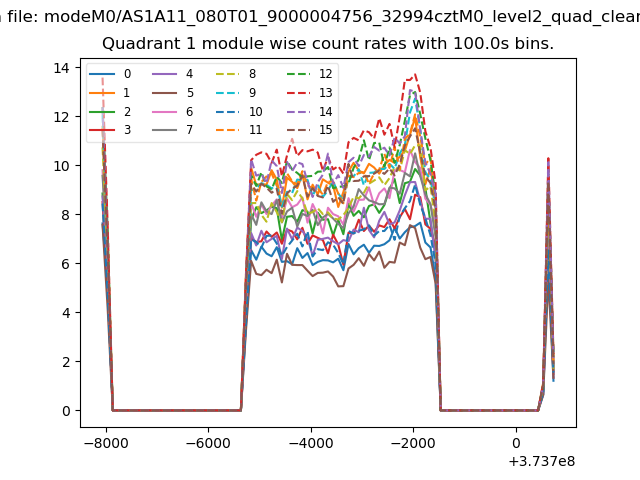
| Module-wise count rates for Quadrant A Data is divided into 100 sec bins |
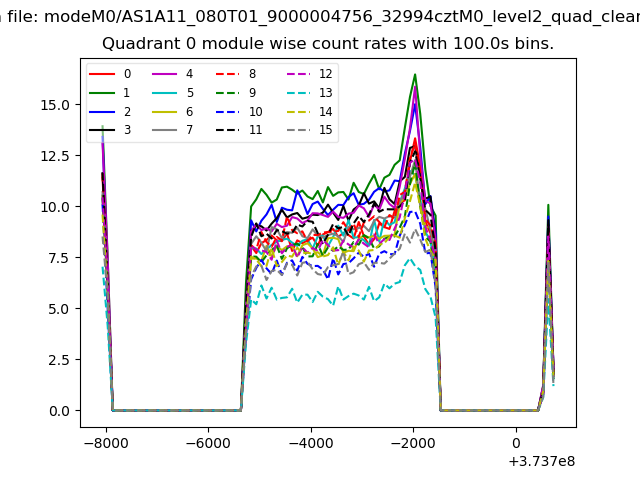 |
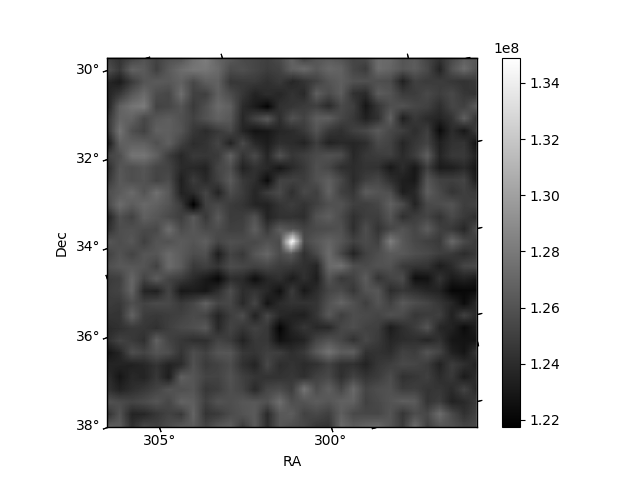 |
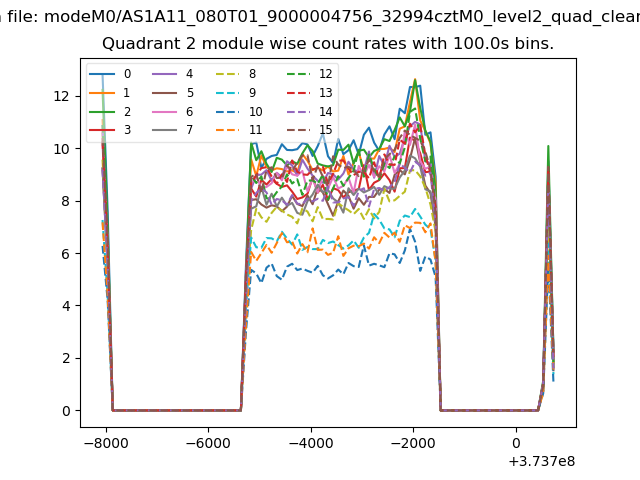
| Module-wise count rates for Quadrant B Data is divided into 100 sec bins |
 |
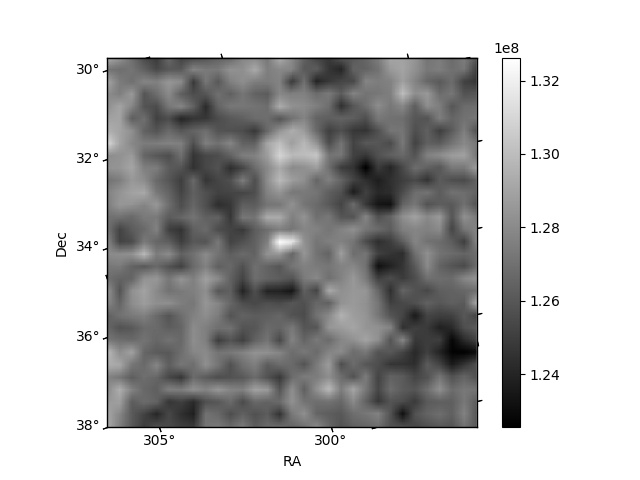 |
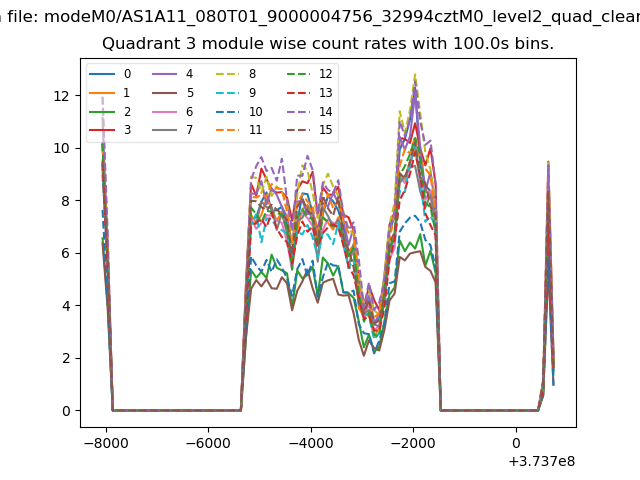
| Module-wise count rates for Quadrant C Data is divided into 100 sec bins |
 |
 |
| Module-wise count rates for Quadrant D Data is divided into 100 sec bins |
 |
 |
| Parameter | Plot |
|---|---|
| CZT HV Monitor | 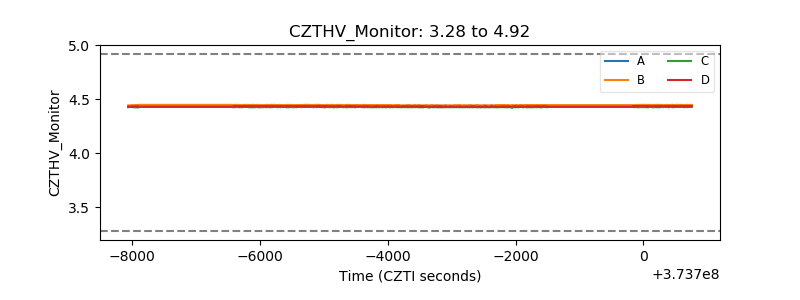 |
| D_VDD | 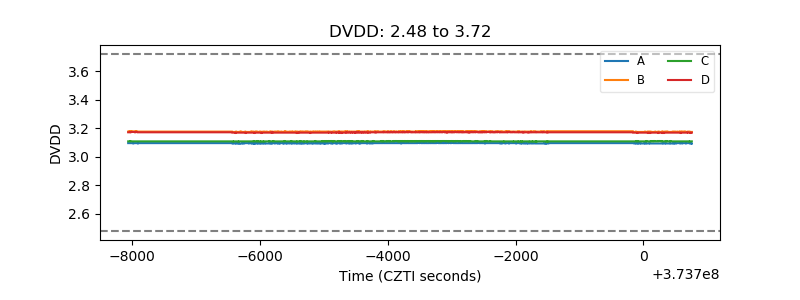 |
| Temperature 1 | 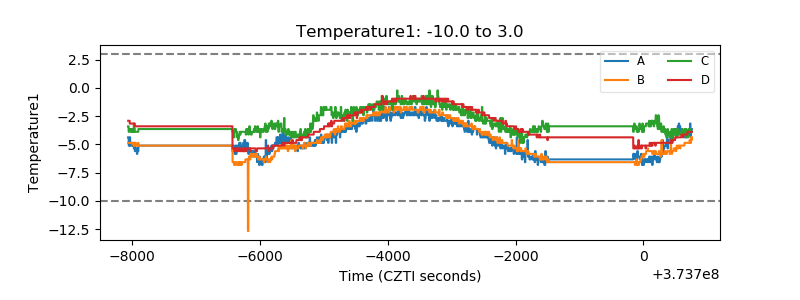 |
| Veto HV Monitor | 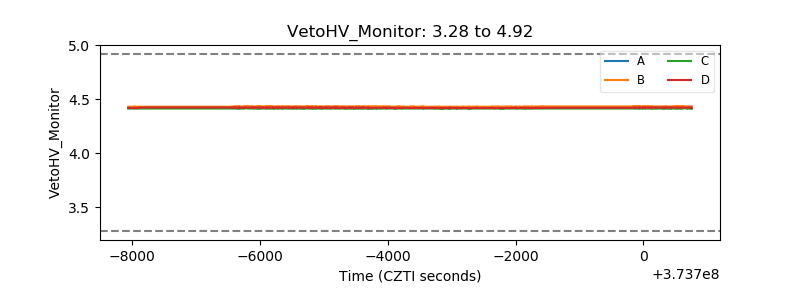 |
| Veto LLD | 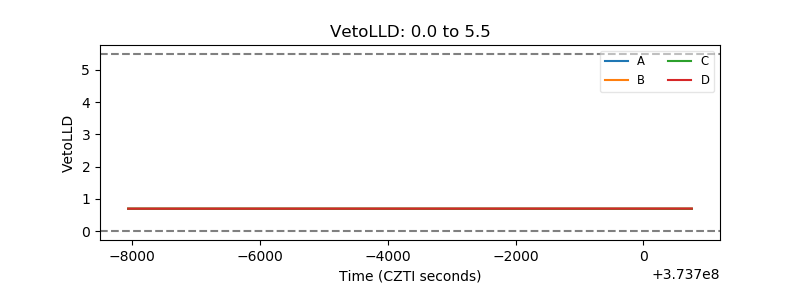 |
| Alpha Counter | 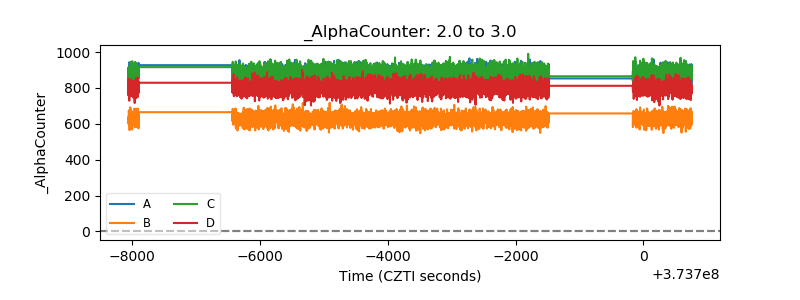 |
| _CPM_Rate | 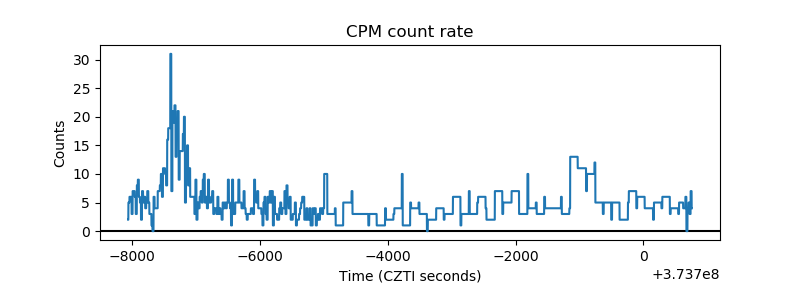 |
| CZT Counter | 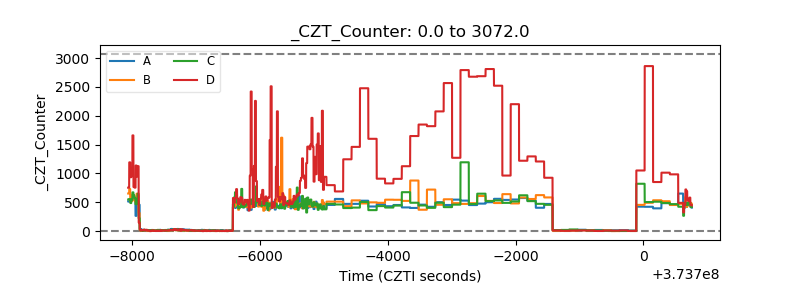 |
| +2.5 Volts monitor |  |
| +5 Volts monitor |  |
| _ROLL_ROT | 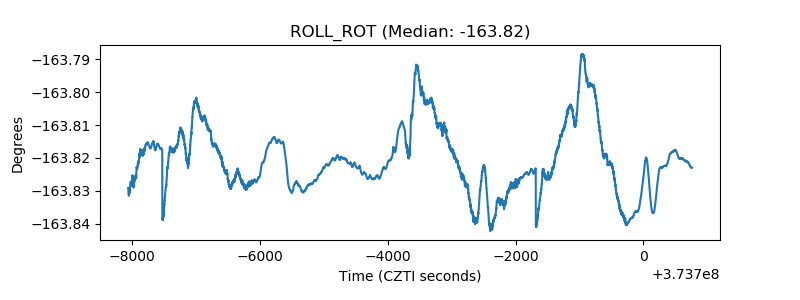 |
| _Roll_DEC | 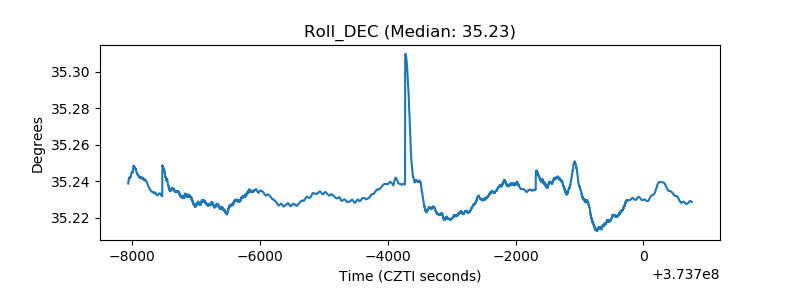 |
| _Roll_RA | 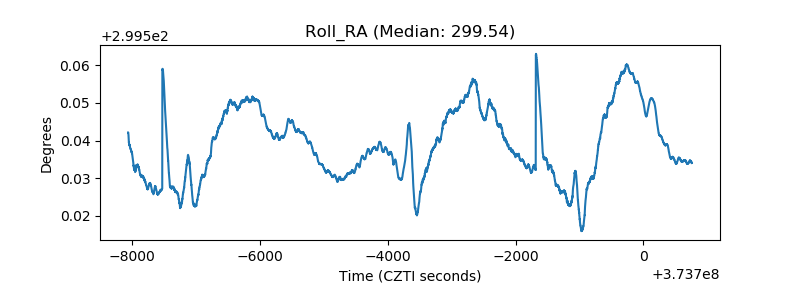 |
| Veto Counter |  |