| Param | Original file | Final file |
|---|---|---|
| Filename | modeM0/AS1A11_080T01_9000004756_32997cztM0_level2.evt | modeM0/AS1A11_080T01_9000004756_32997cztM0_level2_quad_clean.evt |
| Size (bytes) | 1,132,384,320 | 174,467,520 |
| Size | 1.1 GB | 166.4 MB |
| Events in quadrant A | 5,227,922 | 1,193,228 |
| Events in quadrant B | 7,478,093 | 1,153,049 |
| Events in quadrant C | 5,583,832 | 1,171,096 |
| Events in quadrant D | 15,247,446 | 988,551 |
| Mode SS | |||
|---|---|---|---|
| Quadrant | BADHDUFLAG | Total packets | Discarded packets |
| A | 0 | 230 | 0 |
| B | 0 | 230 | 0 |
| C | 0 | 230 | 0 |
| D | 0 | 230 | 0 |
| Mode M9 | |||
|---|---|---|---|
| Quadrant | BADHDUFLAG | Total packets | Discarded packets |
| A | 0 | 40 | 0 |
| B | 0 | 40 | 0 |
| C | 0 | 40 | 0 |
| D | 0 | 40 | 0 |
| Mode M0 | |||
|---|---|---|---|
| Quadrant | BADHDUFLAG | Total packets | Discarded packets |
| A | 0 | 22615 | 3 |
| B | 0 | 29226 | 3 |
| C | 0 | 23831 | 3 |
| D | 0 | 53159 | 3 |
| Quadrant | Total seconds | Saturated seconds | Saturation percentage |
|---|---|---|---|
| A | 11233 | 8 | 0.071219% |
| B | 11233 | 712 | 6.338467% |
| C | 11233 | 136 | 1.210718% |
| D | 11233 | 2456 | 21.864150% |
Noise dominated data is calculated using 1-second bins in cleaned event files. If a bin has >2000 counts, and if more than 50% of those come from <1% of pixels, then it is considered to be noise-dominated and hence unusable.
| Quadrant | # 1 sec bins | Bins with >0 counts | Bins with >2000 counts | High rate bins dominated by noise | Noise dominated (total time) | Noise dominated (detector-on time) | Marked lightcurve |
|---|---|---|---|---|---|---|---|
| A | 15172 | 11236 | 0 | 0 | 0.00% | 0.00% | 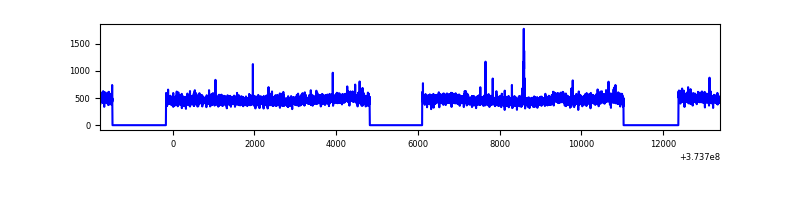 |
| B | 15172 | 11236 | 527 | 527 | 3.47% | 4.69% | 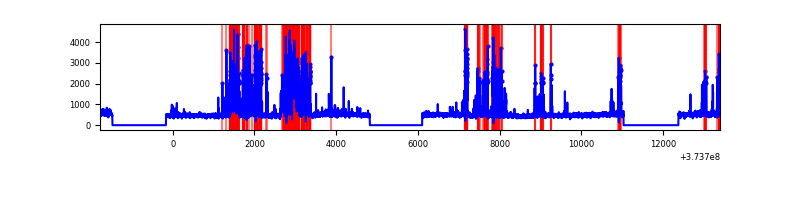 |
| C | 15172 | 11236 | 66 | 66 | 0.44% | 0.59% |  |
| D | 15172 | 11236 | 2443 | 2443 | 16.10% | 21.74% | 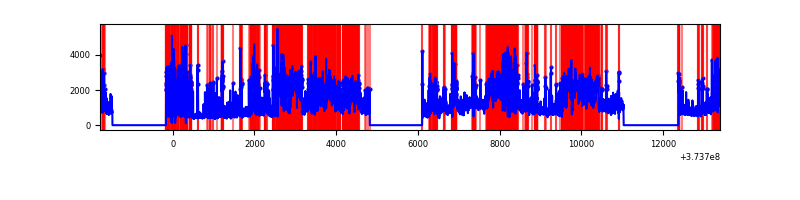 |
Top three noisy pixels from each quadrant. If the there are fewer than three noisy pixels in the level2.evt file, extra rows are filled as -1
| Pixel properties | Quadrant properties | ||||||
|---|---|---|---|---|---|---|---|
| Quadrant | DetID | PixID | Counts | Sigma | Mean | Median | Sigma |
| A | 15 | 47 | 37307 | 135.33 | 1327 | 1303 | 266.1 |
| A | 9 | 143 | 30484 | 109.68 | 1327 | 1303 | 266.1 |
| A | 13 | 254 | 21016 | 74.09 | 1327 | 1303 | 266.1 |
| B | 5 | 172 | 2171174 | 8821.48 | 1289 | 1258 | 246.0 |
| B | 0 | 219 | 118071 | 474.89 | 1289 | 1258 | 246.0 |
| B | 15 | 85 | 36402 | 142.87 | 1289 | 1258 | 246.0 |
| C | 0 | 10 | 377687 | 1268.96 | 1277 | 1293 | 296.6 |
| C | 3 | 233 | 73404 | 243.11 | 1277 | 1293 | 296.6 |
| C | 1 | 241 | 39489 | 128.77 | 1277 | 1293 | 296.6 |
| D | 8 | 230 | 2659010 | 8556.69 | 1187 | 1169 | 310.6 |
| D | 7 | 223 | 1913687 | 6157.19 | 1187 | 1169 | 310.6 |
| D | 8 | 195 | 1626753 | 5233.43 | 1187 | 1169 | 310.6 |
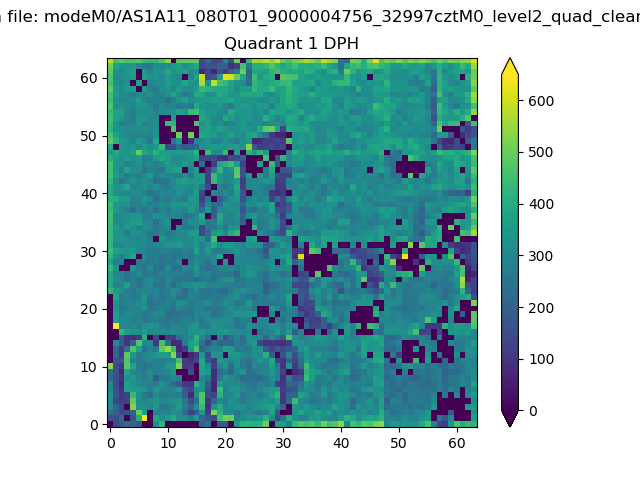
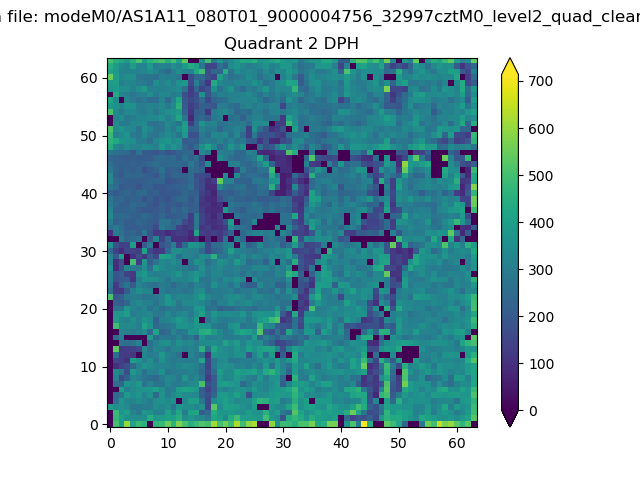
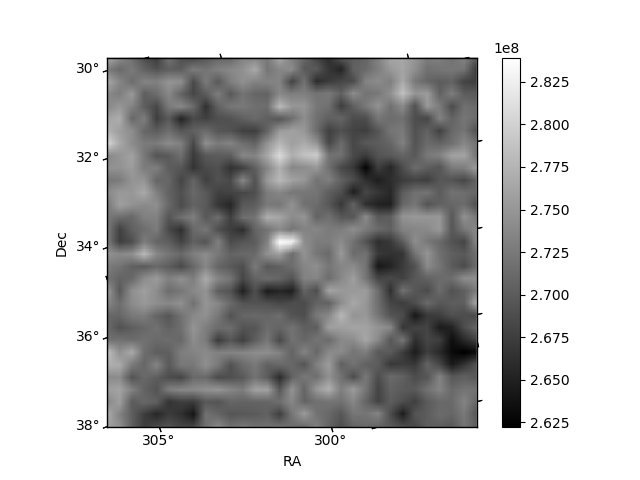
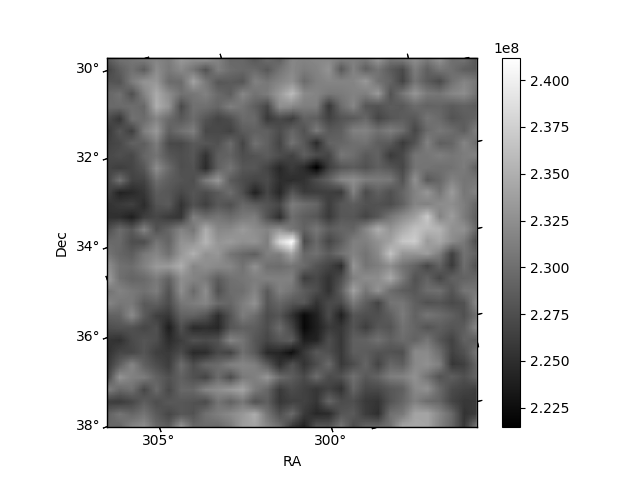
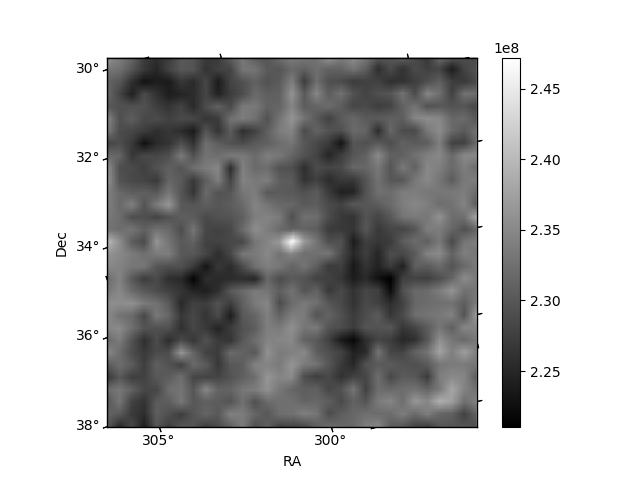
Histogram calculated using DETX and DETY for each event in the final _common_clean file
| Quadrant A | 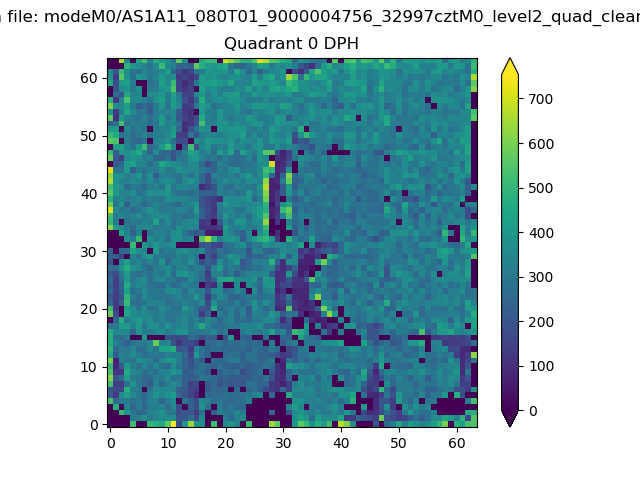 |
 |
Quadrant B |
|---|---|---|---|
| Quadrant D | 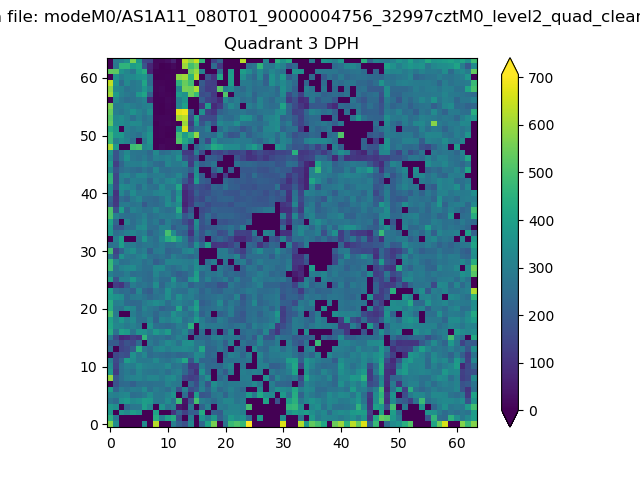 |
 |
Quadrant C |
| Plot type | Count rate plots | Images |
|---|---|---|
| Comparison with Poisson distribution Blue bars denote a histogram of data divided into 1 sec bins. Red curve is a Poisson curve with rate = median count rate of data. |
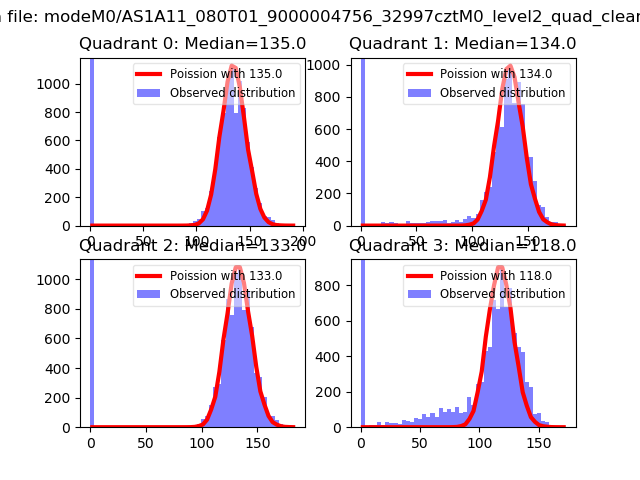 |
 |
| Quadrant-wise count rates Data is divided into 100 sec bins |
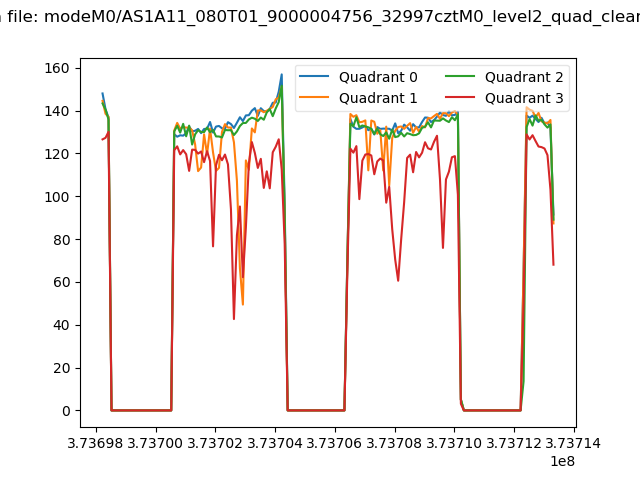 |
|
| Module-wise count rates for Quadrant A Data is divided into 100 sec bins |
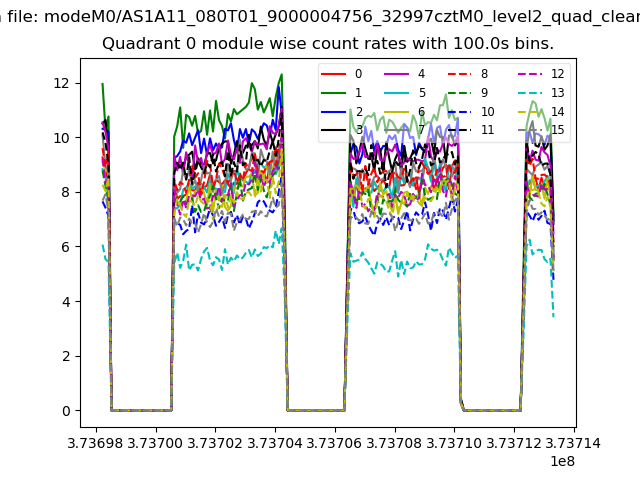 |
 |
| Module-wise count rates for Quadrant B Data is divided into 100 sec bins |
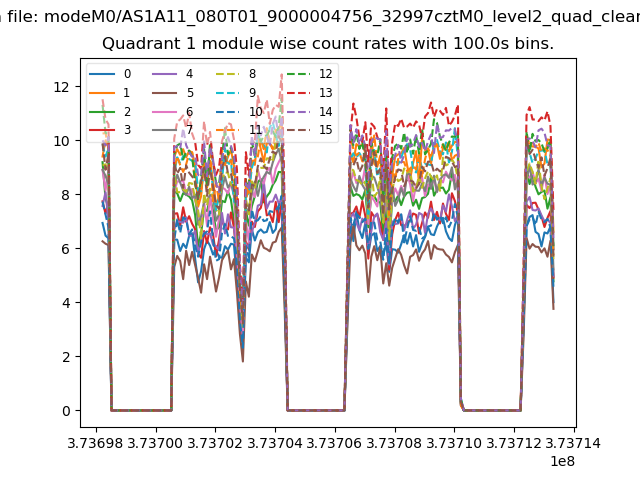 |
 |
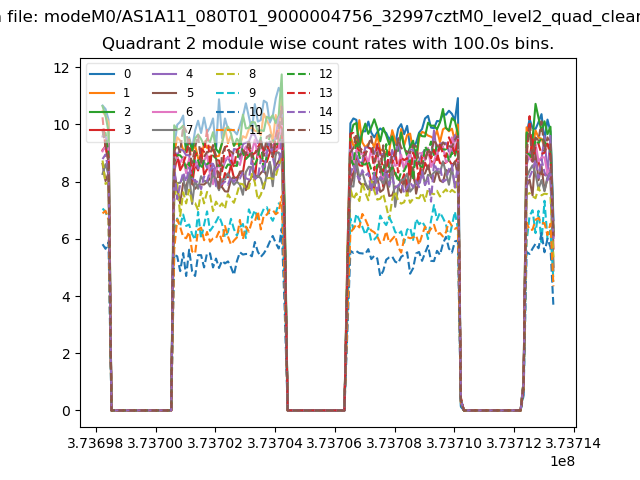
| Module-wise count rates for Quadrant C Data is divided into 100 sec bins |
 |
 |
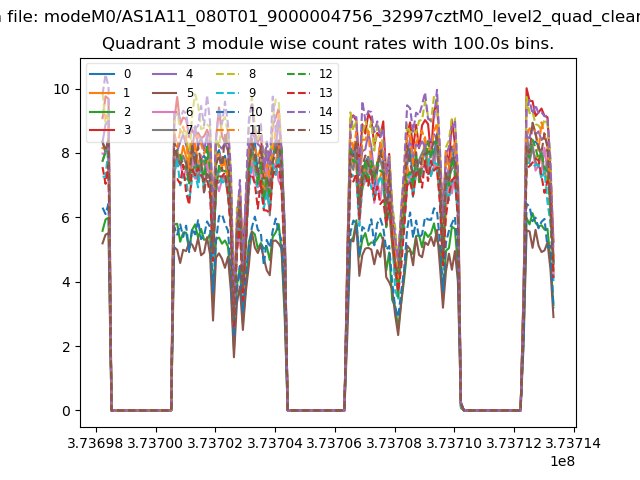
| Module-wise count rates for Quadrant D Data is divided into 100 sec bins |
 |
 |
| Parameter | Plot |
|---|---|
| CZT HV Monitor | 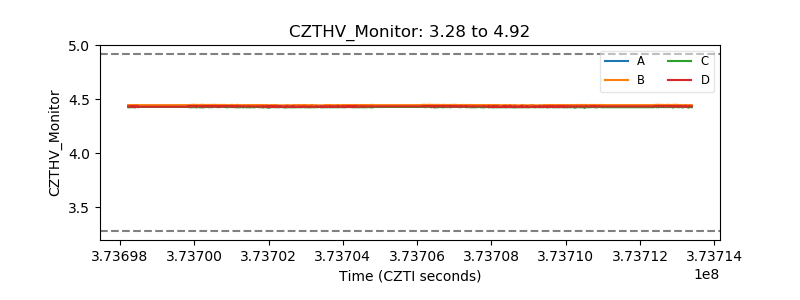 |
| D_VDD | 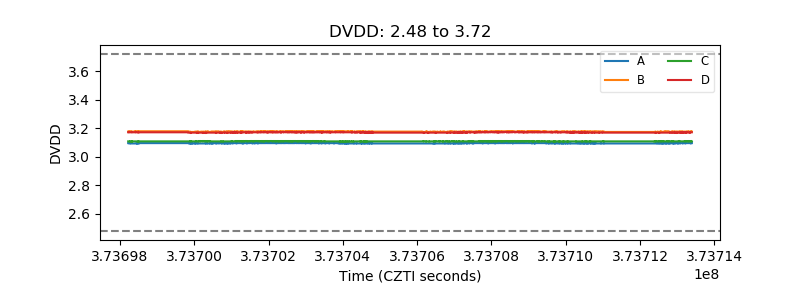 |
| Temperature 1 | 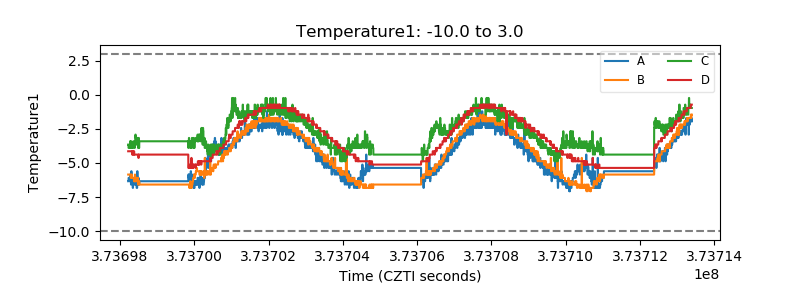 |
| Veto HV Monitor | 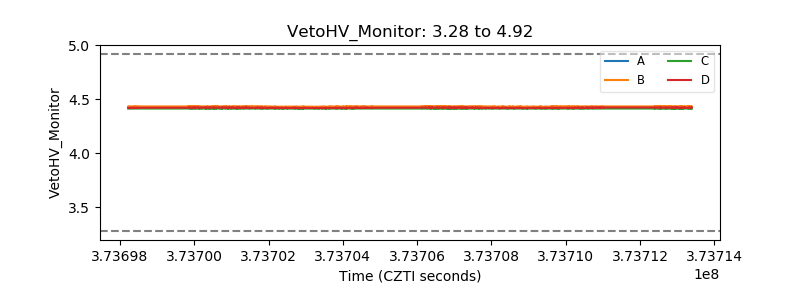 |
| Veto LLD | 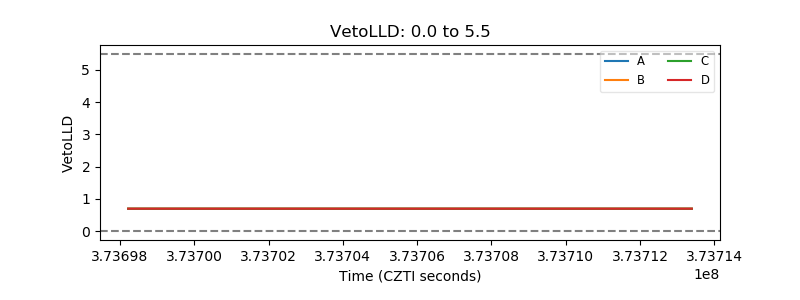 |
| Alpha Counter | 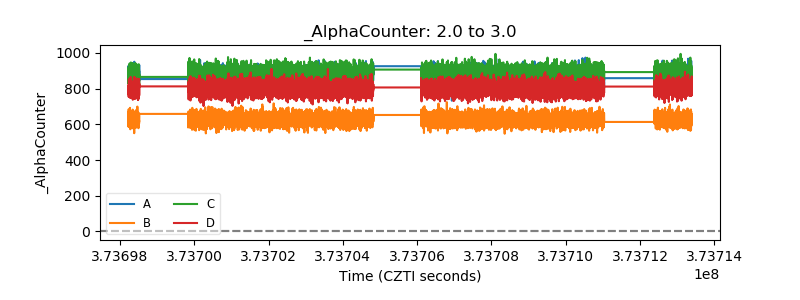 |
| _CPM_Rate | 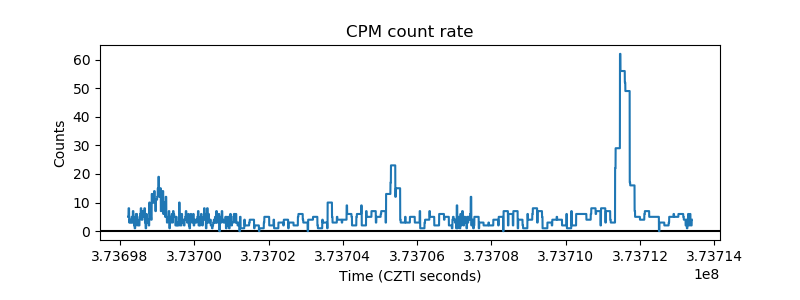 |
| CZT Counter | 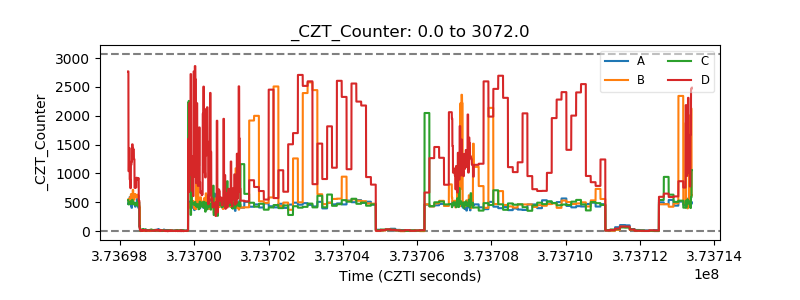 |
| +2.5 Volts monitor |  |
| +5 Volts monitor |  |
| _ROLL_ROT | 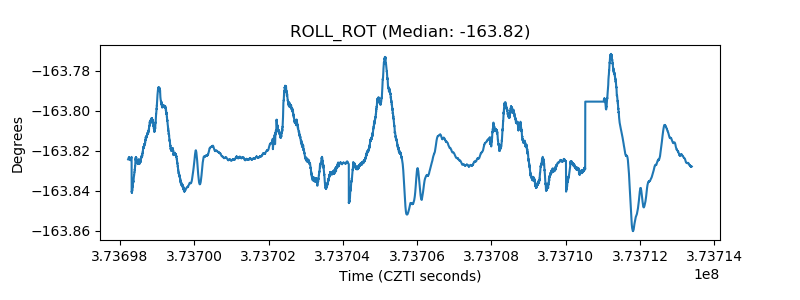 |
| _Roll_DEC | 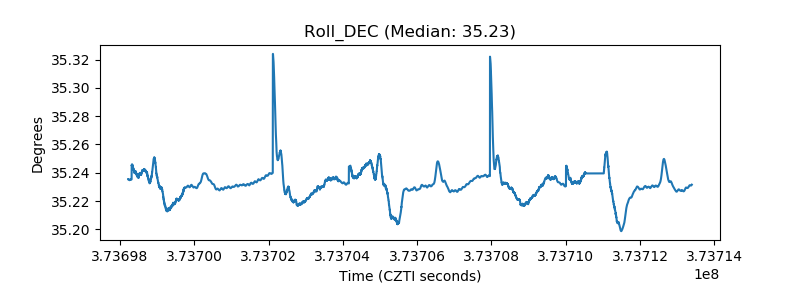 |
| _Roll_RA |  |
| Veto Counter | 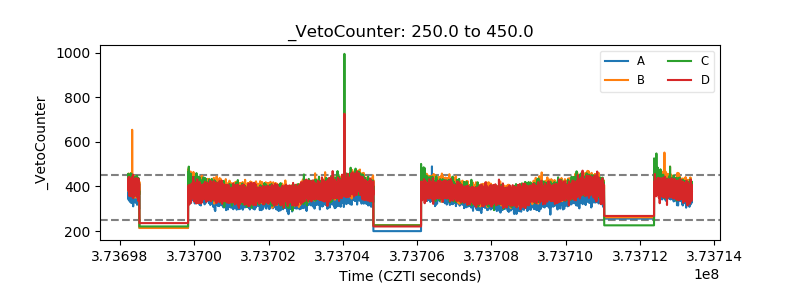 |