| Param | Original file | Final file |
|---|---|---|
| Filename | modeM0/AS1A11_080T01_9000004756_33009cztM0_level2.evt | modeM0/AS1A11_080T01_9000004756_33009cztM0_level2_quad_clean.evt |
| Size (bytes) | 525,525,120 | 83,759,040 |
| Size | 501.2 MB | 79.9 MB |
| Events in quadrant A | 2,717,099 | 547,865 |
| Events in quadrant B | 3,563,568 | 540,447 |
| Events in quadrant C | 3,425,655 | 541,015 |
| Events in quadrant D | 5,802,340 | 487,637 |
| Mode SS | |||
|---|---|---|---|
| Quadrant | BADHDUFLAG | Total packets | Discarded packets |
| A | 0 | 124 | 0 |
| B | 0 | 124 | 0 |
| C | 0 | 124 | 0 |
| D | 0 | 124 | 0 |
| Mode M9 | |||
|---|---|---|---|
| Quadrant | BADHDUFLAG | Total packets | Discarded packets |
| A | 0 | 26 | 0 |
| B | 0 | 26 | 0 |
| C | 0 | 26 | 0 |
| D | 0 | 26 | 0 |
| Mode M0 | |||
|---|---|---|---|
| Quadrant | BADHDUFLAG | Total packets | Discarded packets |
| A | 0 | 12042 | 3 |
| B | 0 | 14414 | 2 |
| C | 0 | 14033 | 2 |
| D | 0 | 21463 | 2 |
| Quadrant | Total seconds | Saturated seconds | Saturation percentage |
|---|---|---|---|
| A | 6001 | 4 | 0.066656% |
| B | 6001 | 260 | 4.332611% |
| C | 6001 | 174 | 2.899517% |
| D | 6001 | 469 | 7.815364% |
Noise dominated data is calculated using 1-second bins in cleaned event files. If a bin has >2000 counts, and if more than 50% of those come from <1% of pixels, then it is considered to be noise-dominated and hence unusable.
| Quadrant | # 1 sec bins | Bins with >0 counts | Bins with >2000 counts | High rate bins dominated by noise | Noise dominated (total time) | Noise dominated (detector-on time) | Marked lightcurve |
|---|---|---|---|---|---|---|---|
| A | 8657 | 6003 | 0 | 0 | 0.00% | 0.00% |  |
| B | 8657 | 6003 | 159 | 159 | 1.84% | 2.65% |  |
| C | 8657 | 6003 | 127 | 127 | 1.47% | 2.12% |  |
| D | 8657 | 6003 | 511 | 511 | 5.90% | 8.51% |  |
Top three noisy pixels from each quadrant. If the there are fewer than three noisy pixels in the level2.evt file, extra rows are filled as -1
| Pixel properties | Quadrant properties | ||||||
|---|---|---|---|---|---|---|---|
| Quadrant | DetID | PixID | Counts | Sigma | Mean | Median | Sigma |
| A | 13 | 6 | 14887 | 99.96 | 698 | 685 | 142.1 |
| A | 13 | 254 | 11042 | 72.9 | 698 | 685 | 142.1 |
| A | 3 | 137 | 6504 | 40.96 | 698 | 685 | 142.1 |
| B | 5 | 172 | 744241 | 5651.07 | 687 | 671 | 131.6 |
| B | 0 | 229 | 33437 | 249.02 | 687 | 671 | 131.6 |
| B | 5 | 200 | 19923 | 146.31 | 687 | 671 | 131.6 |
| C | 7 | 221 | 389439 | 2494.91 | 668 | 676 | 155.8 |
| C | 0 | 10 | 343288 | 2198.74 | 668 | 676 | 155.8 |
| C | 1 | 241 | 37103 | 233.77 | 668 | 676 | 155.8 |
| D | 7 | 223 | 1668843 | 9551.46 | 655 | 641 | 174.7 |
| D | 8 | 195 | 705213 | 4034.1 | 655 | 641 | 174.7 |
| D | 2 | 120 | 245166 | 1400.05 | 655 | 641 | 174.7 |
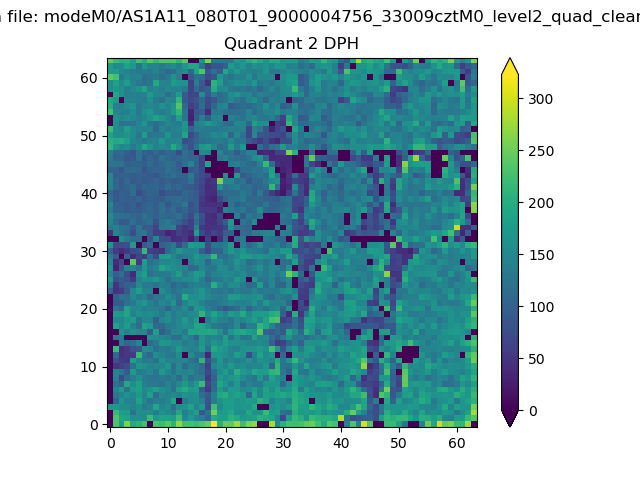
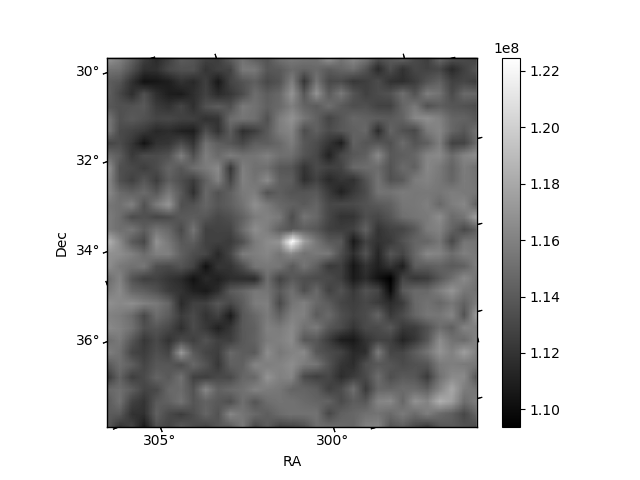
Histogram calculated using DETX and DETY for each event in the final _common_clean file
| Quadrant A | 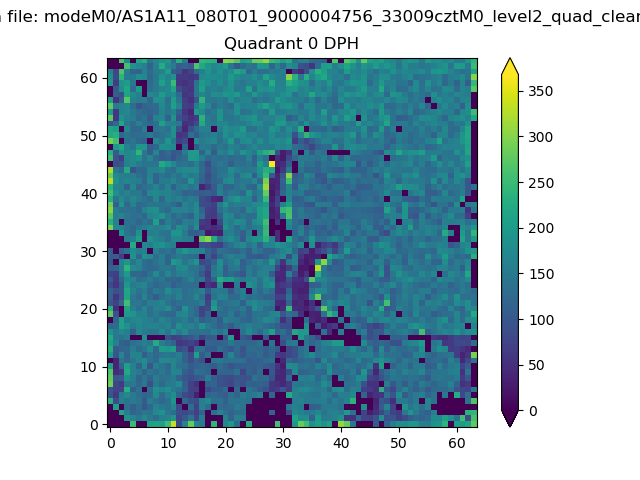 |
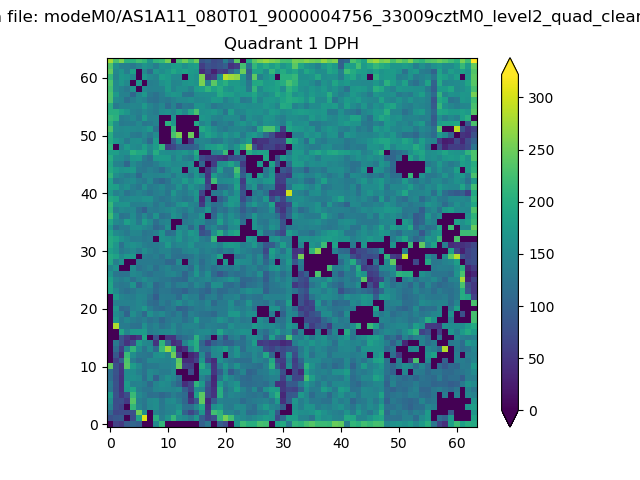 |
Quadrant B |
|---|---|---|---|
| Quadrant D | 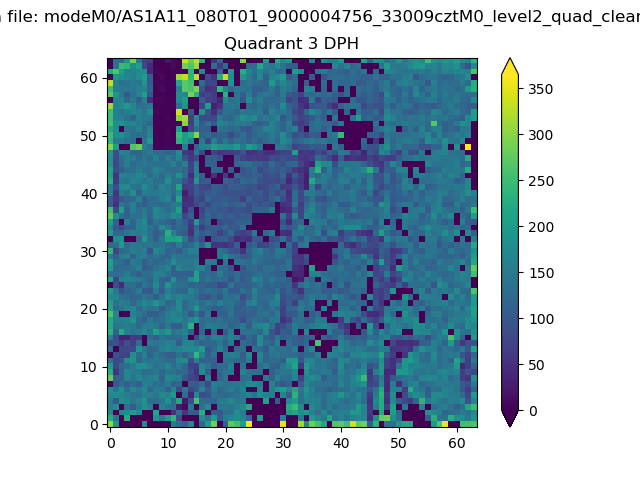 |
 |
Quadrant C |
| Plot type | Count rate plots | Images |
|---|---|---|
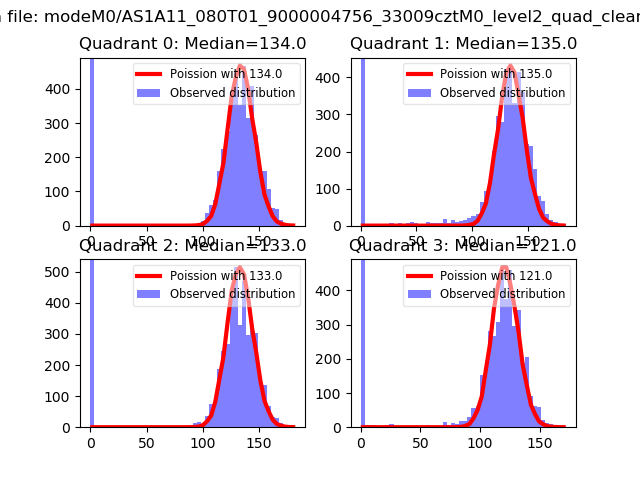
| Comparison with Poisson distribution Blue bars denote a histogram of data divided into 1 sec bins. Red curve is a Poisson curve with rate = median count rate of data. |
 |
 |
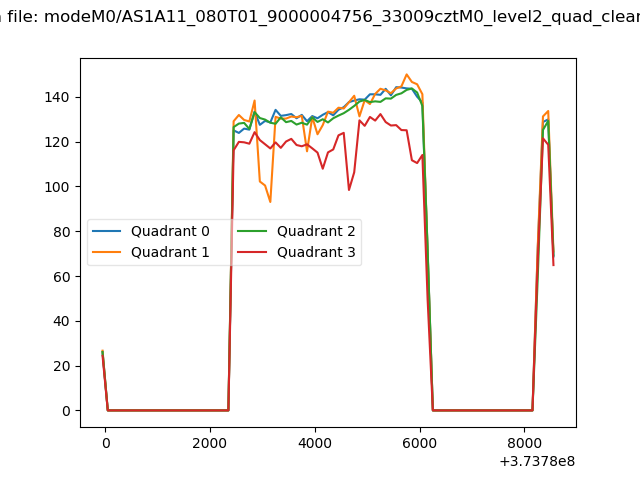
| Quadrant-wise count rates Data is divided into 100 sec bins |
 |
|
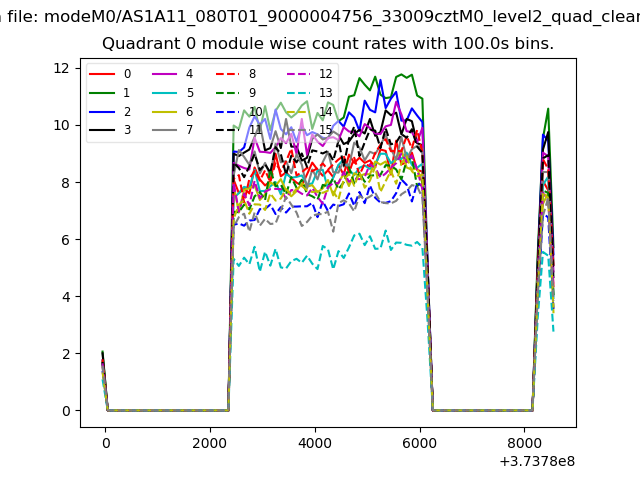
| Module-wise count rates for Quadrant A Data is divided into 100 sec bins |
 |
 |
| Module-wise count rates for Quadrant B Data is divided into 100 sec bins |
 |
 |
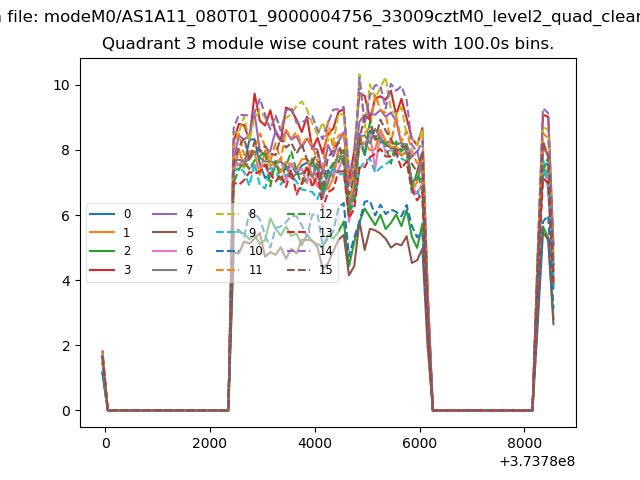
| Module-wise count rates for Quadrant C Data is divided into 100 sec bins |
 |
 |
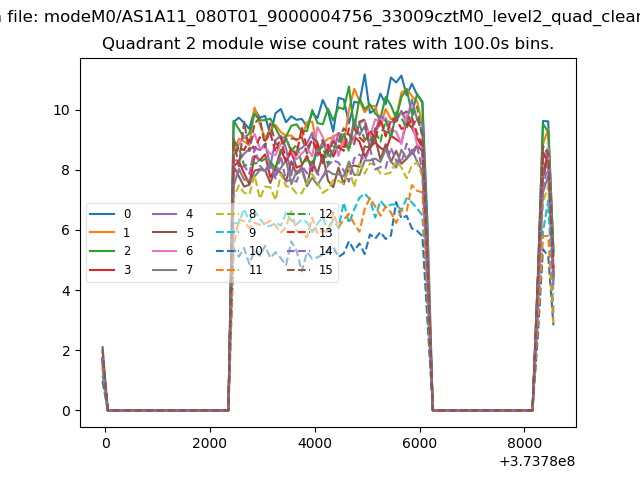
| Module-wise count rates for Quadrant D Data is divided into 100 sec bins |
 |
 |
| Parameter | Plot |
|---|---|
| CZT HV Monitor | 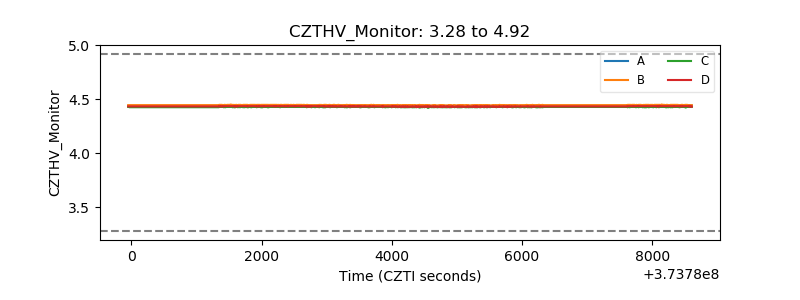 |
| D_VDD | 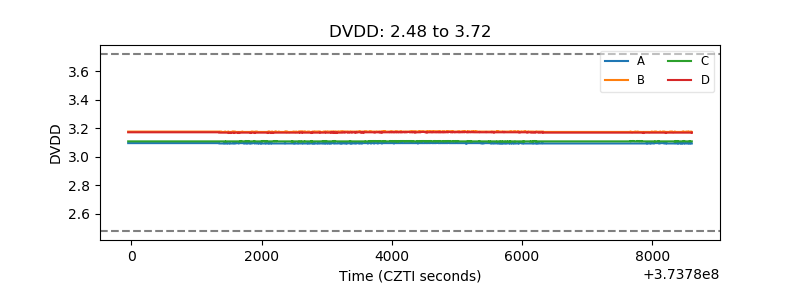 |
| Temperature 1 | 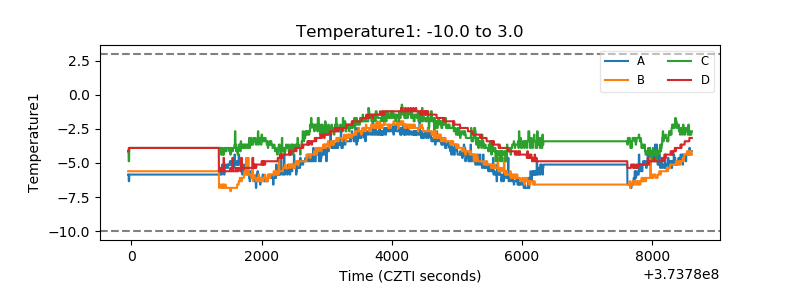 |
| Veto HV Monitor | 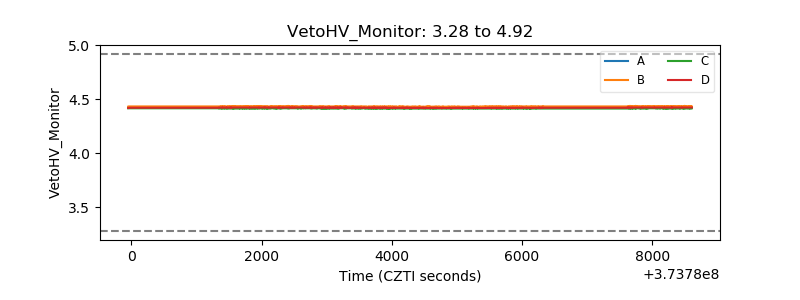 |
| Veto LLD | 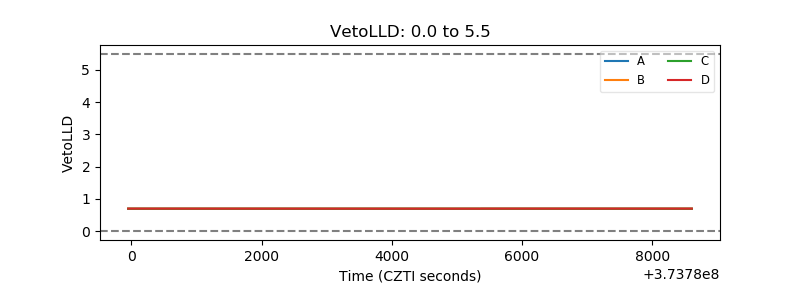 |
| Alpha Counter | 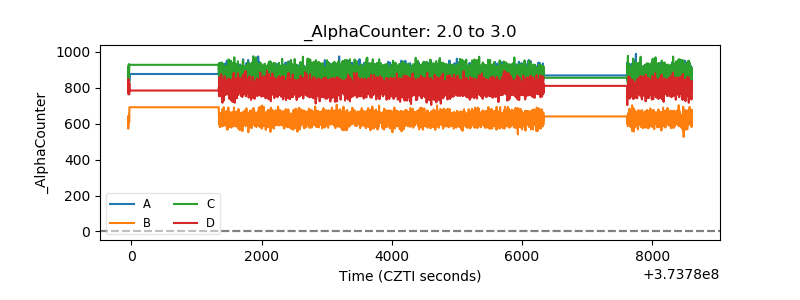 |
| _CPM_Rate | 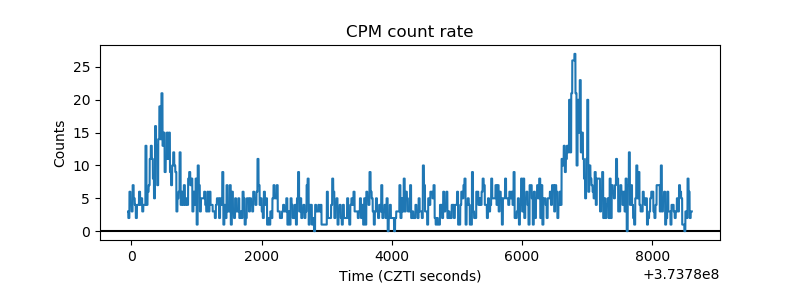 |
| CZT Counter | 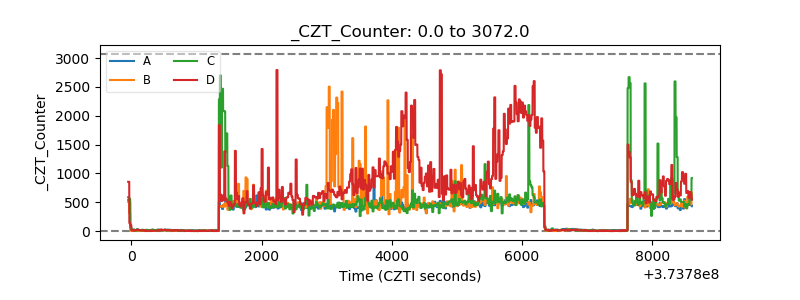 |
| +2.5 Volts monitor |  |
| +5 Volts monitor |  |
| _ROLL_ROT | 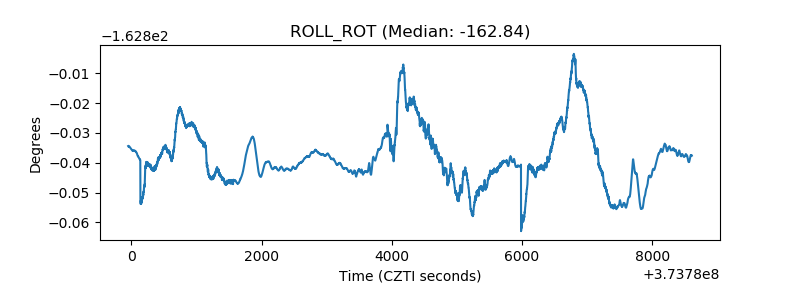 |
| _Roll_DEC | 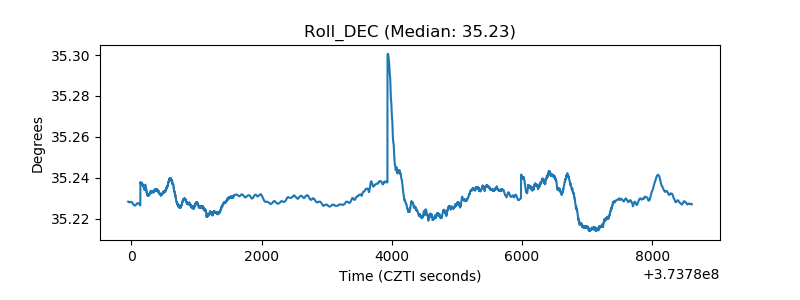 |
| _Roll_RA | 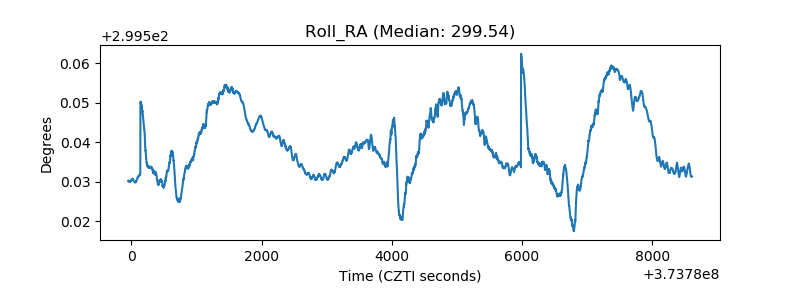 |
| Veto Counter | 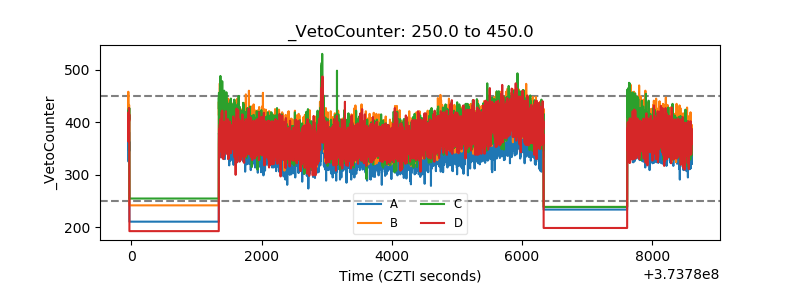 |