| Param | Original file | Final file |
|---|---|---|
| Filename | modeM0/AS1A11_080T01_9000004756_33027cztM0_level2.evt | modeM0/AS1A11_080T01_9000004756_33027cztM0_level2_quad_clean.evt |
| Size (bytes) | 725,996,160 | 88,848,000 |
| Size | 692.4 MB | 84.7 MB |
| Events in quadrant A | 2,621,866 | 630,218 |
| Events in quadrant B | 4,041,466 | 601,591 |
| Events in quadrant C | 5,940,403 | 545,274 |
| Events in quadrant D | 9,005,038 | 520,189 |
| Mode SS | |||
|---|---|---|---|
| Quadrant | BADHDUFLAG | Total packets | Discarded packets |
| A | 0 | 114 | 0 |
| B | 0 | 114 | 0 |
| C | 0 | 114 | 0 |
| D | 0 | 114 | 0 |
| Mode M9 | |||
|---|---|---|---|
| Quadrant | BADHDUFLAG | Total packets | Discarded packets |
| A | 0 | 28 | 0 |
| B | 0 | 28 | 0 |
| C | 0 | 28 | 0 |
| D | 0 | 29 | 0 |
| Mode M0 | |||
|---|---|---|---|
| Quadrant | BADHDUFLAG | Total packets | Discarded packets |
| A | 0 | 11346 | 3 |
| B | 0 | 15563 | 2 |
| C | 0 | 21388 | 2 |
| D | 0 | 30623 | 2 |
| Quadrant | Total seconds | Saturated seconds | Saturation percentage |
|---|---|---|---|
| A | 5610 | 5 | 0.089127% |
| B | 5610 | 387 | 6.898396% |
| C | 5610 | 985 | 17.557932% |
| D | 5610 | 1472 | 26.238859% |
Noise dominated data is calculated using 1-second bins in cleaned event files. If a bin has >2000 counts, and if more than 50% of those come from <1% of pixels, then it is considered to be noise-dominated and hence unusable.
| Quadrant | # 1 sec bins | Bins with >0 counts | Bins with >2000 counts | High rate bins dominated by noise | Noise dominated (total time) | Noise dominated (detector-on time) | Marked lightcurve |
|---|---|---|---|---|---|---|---|
| A | 7223 | 5611 | 0 | 0 | 0.00% | 0.00% | 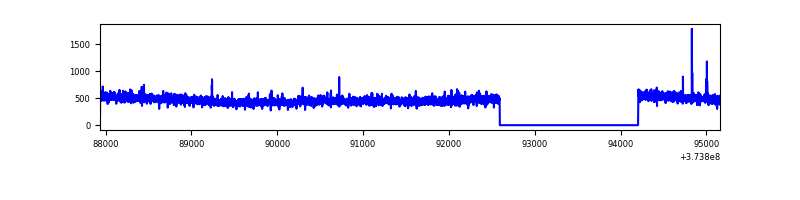 |
| B | 7222 | 5610 | 252 | 252 | 3.49% | 4.49% | 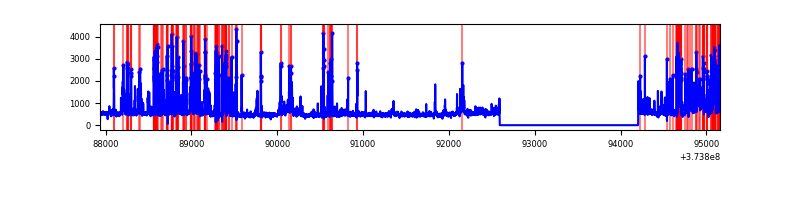 |
| C | 7223 | 5611 | 807 | 807 | 11.17% | 14.38% | 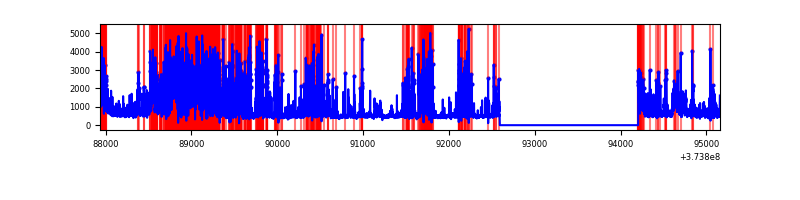 |
| D | 7223 | 5611 | 1590 | 1590 | 22.01% | 28.34% | 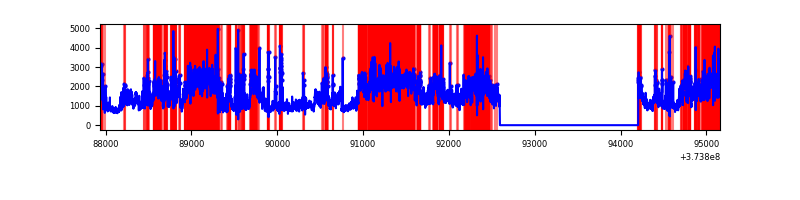 |
Top three noisy pixels from each quadrant. If the there are fewer than three noisy pixels in the level2.evt file, extra rows are filled as -1
| Pixel properties | Quadrant properties | ||||||
|---|---|---|---|---|---|---|---|
| Quadrant | DetID | PixID | Counts | Sigma | Mean | Median | Sigma |
| A | 13 | 6 | 16502 | 115.67 | 671 | 658 | 137.0 |
| A | 13 | 254 | 11413 | 78.52 | 671 | 658 | 137.0 |
| A | 15 | 169 | 7865 | 52.62 | 671 | 658 | 137.0 |
| B | 5 | 172 | 1158159 | 9287.33 | 646 | 632 | 124.6 |
| B | 0 | 219 | 83829 | 667.52 | 646 | 632 | 124.6 |
| B | 5 | 31 | 69277 | 550.77 | 646 | 632 | 124.6 |
| C | 7 | 221 | 3344943 | 24309.36 | 592 | 598 | 137.6 |
| C | 0 | 10 | 185027 | 1340.58 | 592 | 598 | 137.6 |
| C | 1 | 241 | 62343 | 448.81 | 592 | 598 | 137.6 |
| D | 7 | 223 | 3282017 | 20678.55 | 601 | 589 | 158.7 |
| D | 8 | 195 | 2154259 | 13571.76 | 601 | 589 | 158.7 |
| D | 2 | 250 | 437675 | 2754.38 | 601 | 589 | 158.7 |
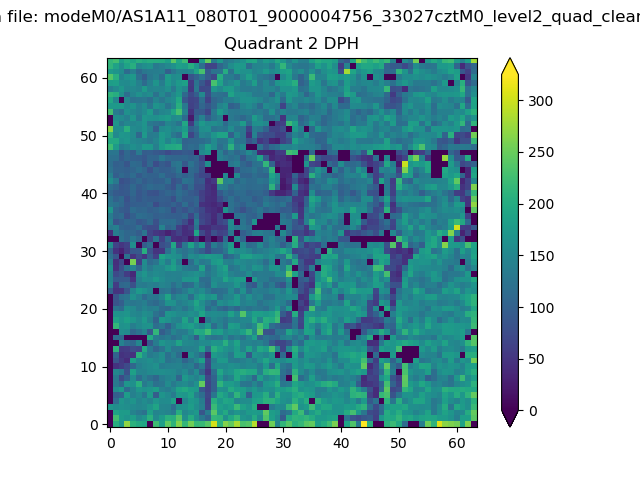
Histogram calculated using DETX and DETY for each event in the final _common_clean file
| Quadrant A | 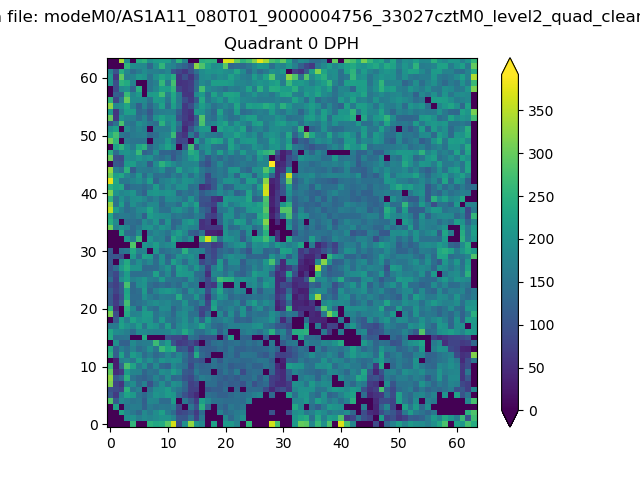 |
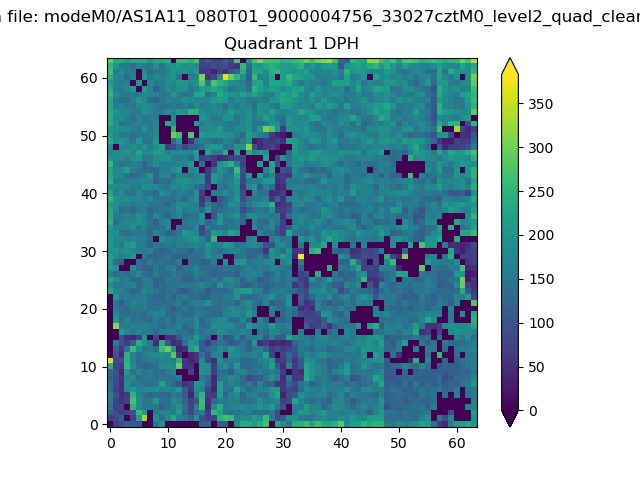 |
Quadrant B |
|---|---|---|---|
| Quadrant D | 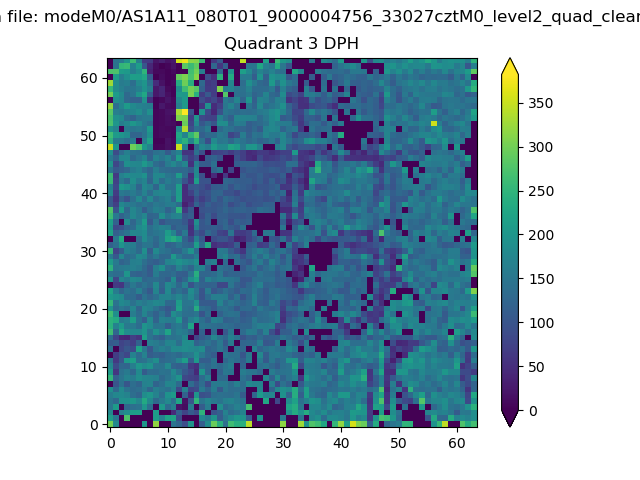 |
 |
Quadrant C |
| Plot type | Count rate plots | Images |
|---|---|---|
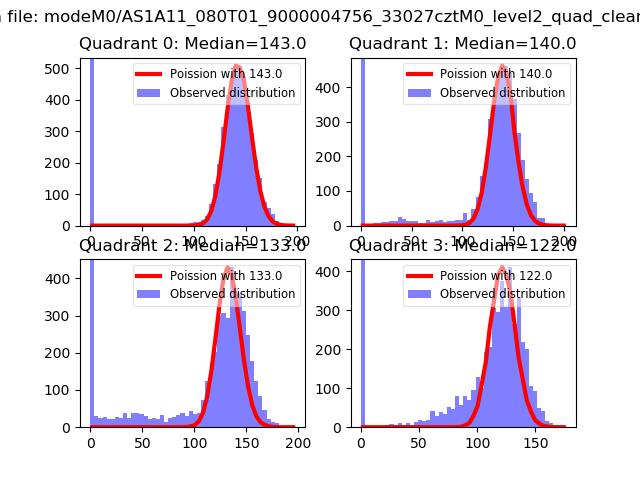
| Comparison with Poisson distribution Blue bars denote a histogram of data divided into 1 sec bins. Red curve is a Poisson curve with rate = median count rate of data. |
 |
 |
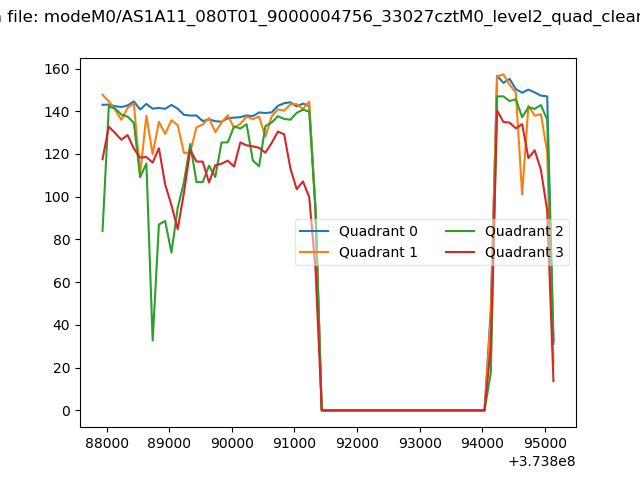
| Quadrant-wise count rates Data is divided into 100 sec bins |
 |
|
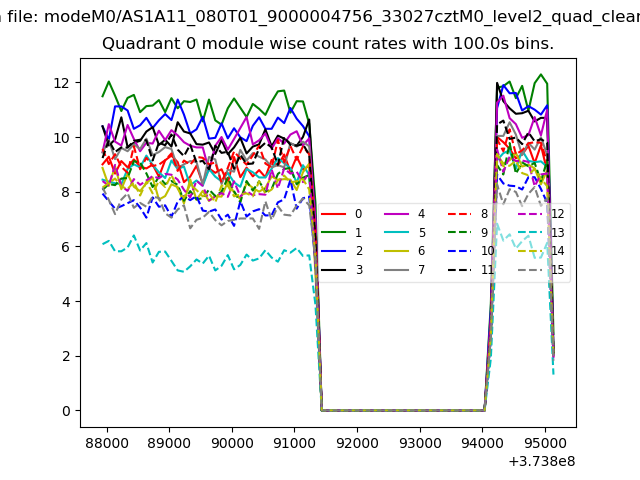
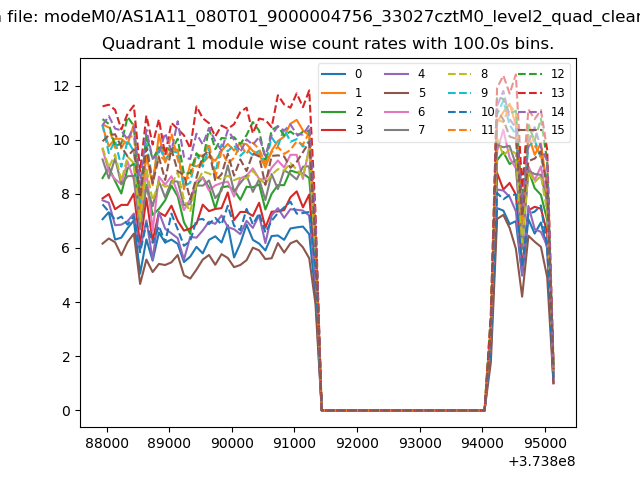
| Module-wise count rates for Quadrant A Data is divided into 100 sec bins |
 |
 |
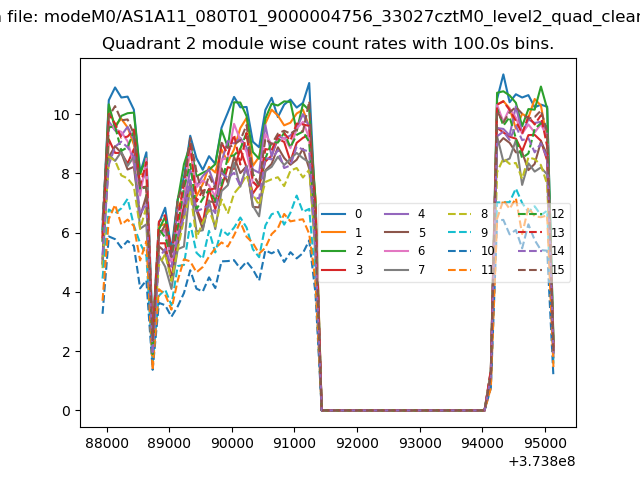
| Module-wise count rates for Quadrant B Data is divided into 100 sec bins |
 |
 |
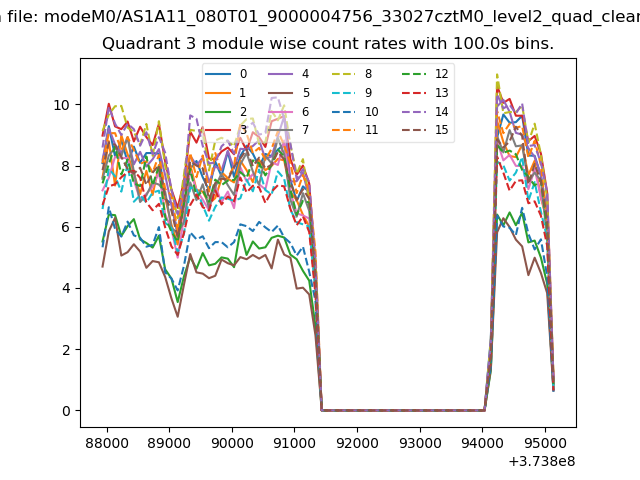
| Module-wise count rates for Quadrant C Data is divided into 100 sec bins |
 |
 |
| Module-wise count rates for Quadrant D Data is divided into 100 sec bins |
 |
 |
| Parameter | Plot |
|---|---|
| CZT HV Monitor | 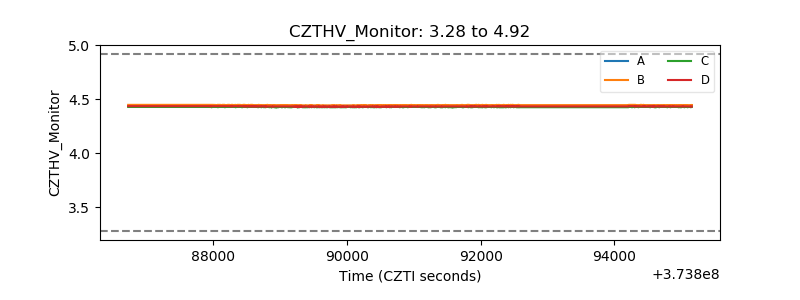 |
| D_VDD | 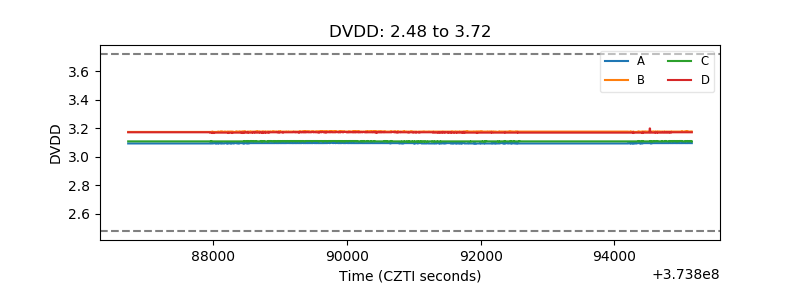 |
| Temperature 1 | 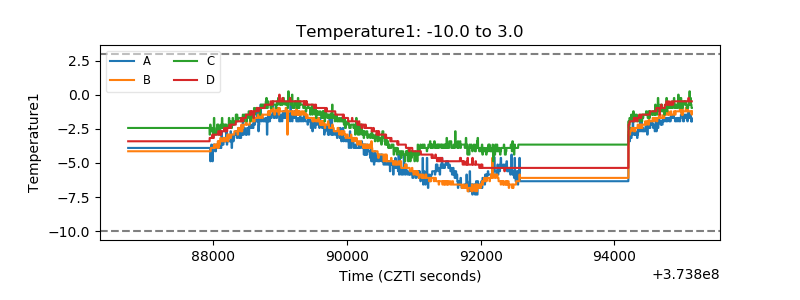 |
| Veto HV Monitor | 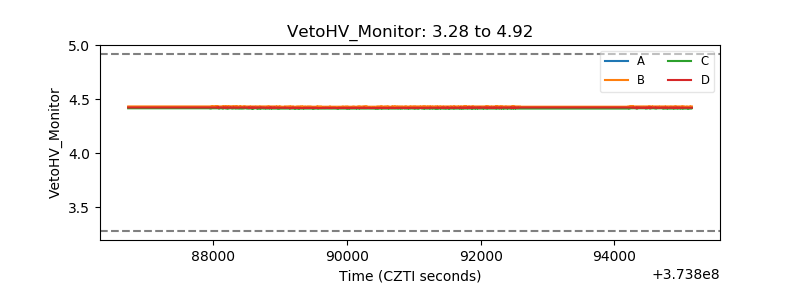 |
| Veto LLD | 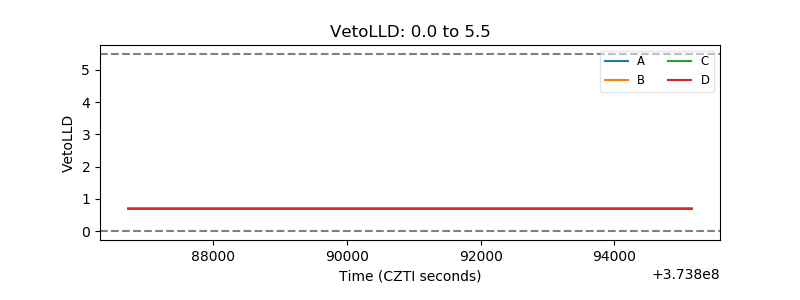 |
| Alpha Counter | 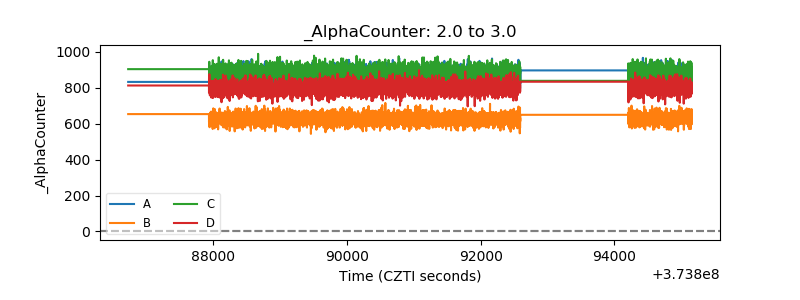 |
| _CPM_Rate | 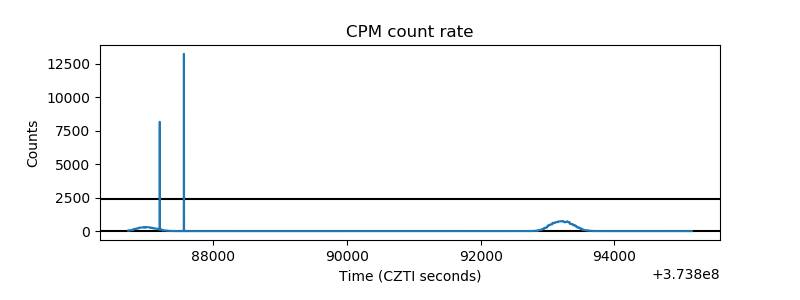 |
| CZT Counter |  |
| +2.5 Volts monitor |  |
| +5 Volts monitor |  |
| _ROLL_ROT | 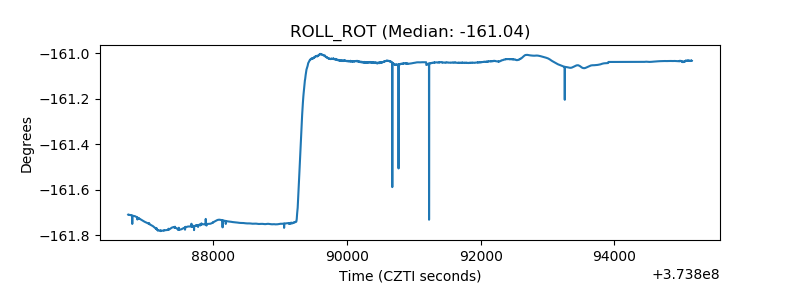 |
| _Roll_DEC | 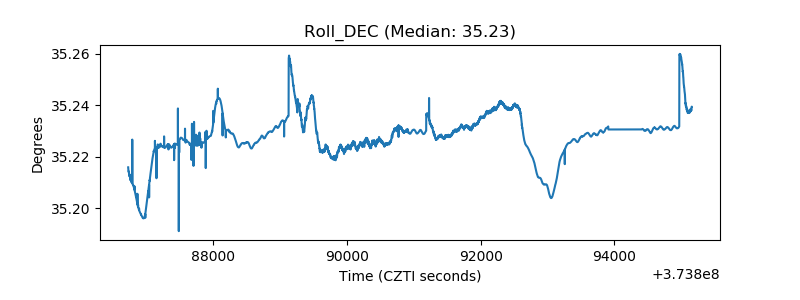 |
| _Roll_RA |  |
| Veto Counter | 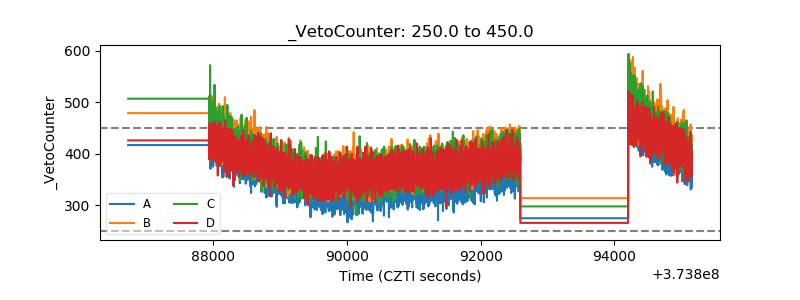 |