| Param | Original file | Final file |
|---|---|---|
| Filename | modeM0/AS1A11_080T01_9000004756_33029cztM0_level2.evt | modeM0/AS1A11_080T01_9000004756_33029cztM0_level2_quad_clean.evt |
| Size (bytes) | 679,069,440 | 81,244,800 |
| Size | 647.6 MB | 77.5 MB |
| Events in quadrant A | 2,683,232 | 573,881 |
| Events in quadrant B | 4,589,400 | 513,647 |
| Events in quadrant C | 3,984,408 | 538,837 |
| Events in quadrant D | 8,945,510 | 456,094 |
| Mode SS | |||
|---|---|---|---|
| Quadrant | BADHDUFLAG | Total packets | Discarded packets |
| A | 0 | 110 | 0 |
| B | 0 | 110 | 0 |
| C | 0 | 110 | 0 |
| D | 0 | 110 | 0 |
| Mode M9 | |||
|---|---|---|---|
| Quadrant | BADHDUFLAG | Total packets | Discarded packets |
| A | 0 | 17 | 0 |
| B | 0 | 17 | 0 |
| C | 0 | 17 | 0 |
| D | 0 | 17 | 0 |
| Mode M0 | |||
|---|---|---|---|
| Quadrant | BADHDUFLAG | Total packets | Discarded packets |
| A | 0 | 11344 | 2 |
| B | 0 | 17217 | 1 |
| C | 0 | 15377 | 1 |
| D | 0 | 30360 | 1 |
| Quadrant | Total seconds | Saturated seconds | Saturation percentage |
|---|---|---|---|
| A | 5381 | 11 | 0.204423% |
| B | 5381 | 744 | 13.826426% |
| C | 5381 | 229 | 4.255715% |
| D | 5381 | 1601 | 29.752834% |
Noise dominated data is calculated using 1-second bins in cleaned event files. If a bin has >2000 counts, and if more than 50% of those come from <1% of pixels, then it is considered to be noise-dominated and hence unusable.
| Quadrant | # 1 sec bins | Bins with >0 counts | Bins with >2000 counts | High rate bins dominated by noise | Noise dominated (total time) | Noise dominated (detector-on time) | Marked lightcurve |
|---|---|---|---|---|---|---|---|
| A | 7114 | 5382 | 8 | 8 | 0.11% | 0.15% | 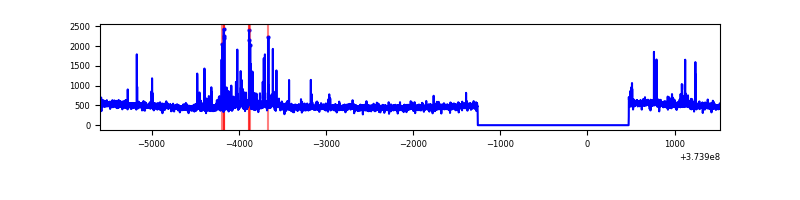 |
| B | 7114 | 5382 | 563 | 563 | 7.91% | 10.46% | 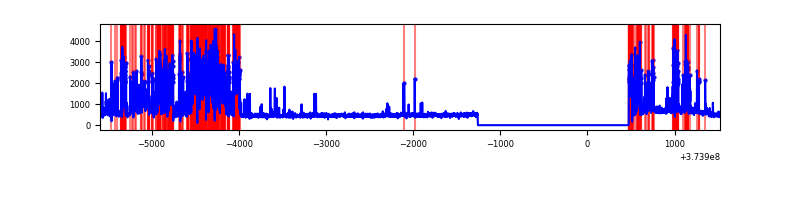 |
| C | 7114 | 5382 | 165 | 165 | 2.32% | 3.07% | 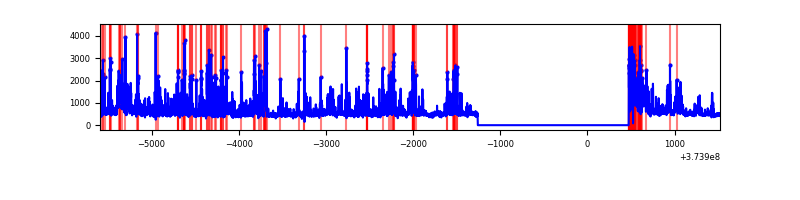 |
| D | 7114 | 5382 | 1692 | 1692 | 23.78% | 31.44% | 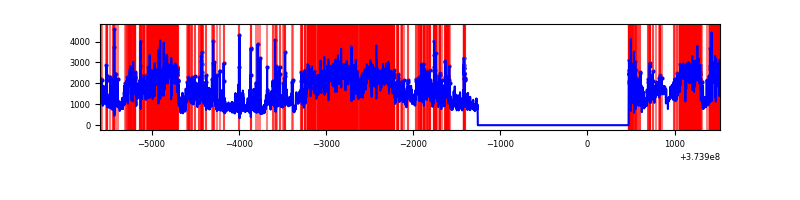 |
Top three noisy pixels from each quadrant. If the there are fewer than three noisy pixels in the level2.evt file, extra rows are filled as -1
| Pixel properties | Quadrant properties | ||||||
|---|---|---|---|---|---|---|---|
| Quadrant | DetID | PixID | Counts | Sigma | Mean | Median | Sigma |
| A | 15 | 169 | 173759 | 1321.71 | 643 | 632 | 131.0 |
| A | 13 | 6 | 12499 | 90.6 | 643 | 632 | 131.0 |
| A | 13 | 254 | 10550 | 75.72 | 643 | 632 | 131.0 |
| B | 5 | 172 | 1876893 | 16480.04 | 598 | 585 | 113.9 |
| B | 0 | 219 | 146842 | 1284.61 | 598 | 585 | 113.9 |
| B | 5 | 200 | 56034 | 487.02 | 598 | 585 | 113.9 |
| C | 7 | 221 | 1386091 | 9826.63 | 611 | 617 | 141.0 |
| C | 0 | 10 | 154767 | 1093.33 | 611 | 617 | 141.0 |
| C | 1 | 241 | 34845 | 242.77 | 611 | 617 | 141.0 |
| D | 7 | 223 | 3423988 | 23311.32 | 565 | 555 | 146.9 |
| D | 8 | 195 | 2068770 | 14083.18 | 565 | 555 | 146.9 |
| D | 2 | 250 | 490129 | 3333.68 | 565 | 555 | 146.9 |
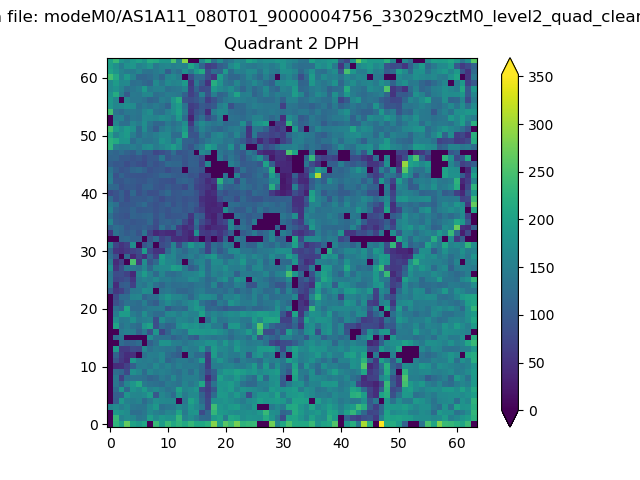
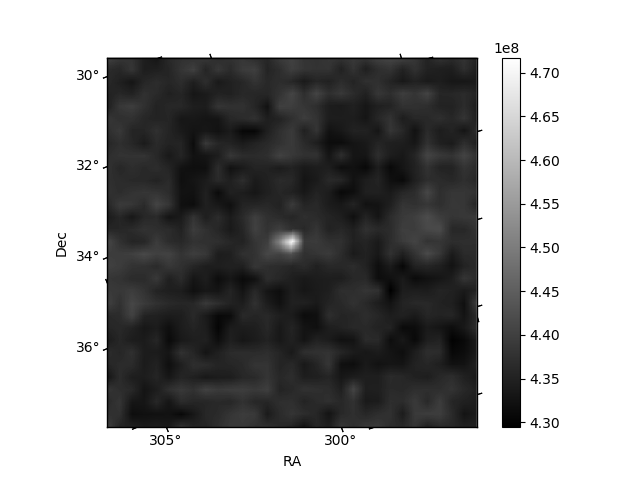
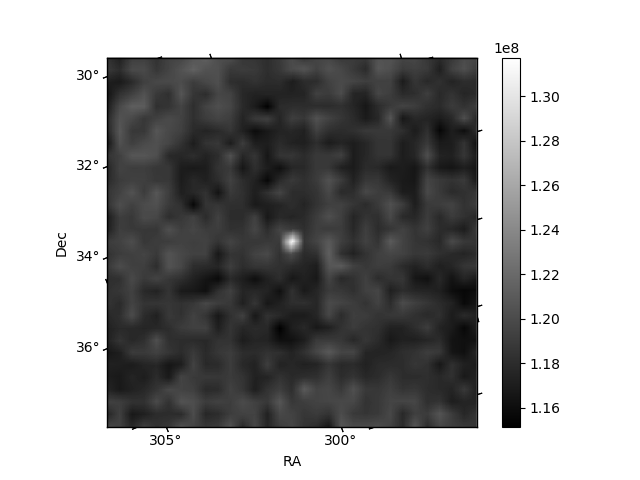
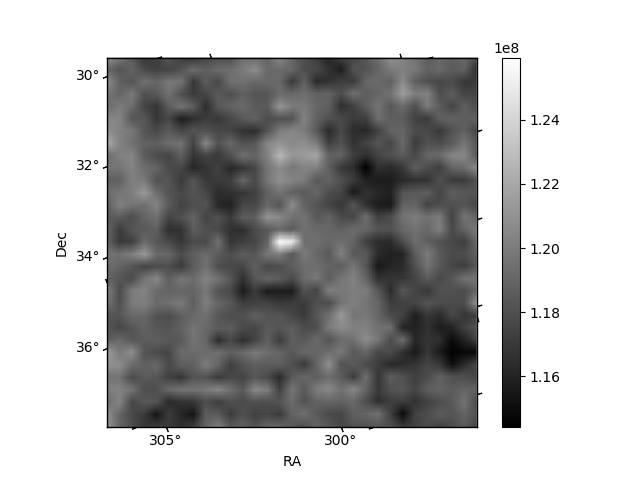
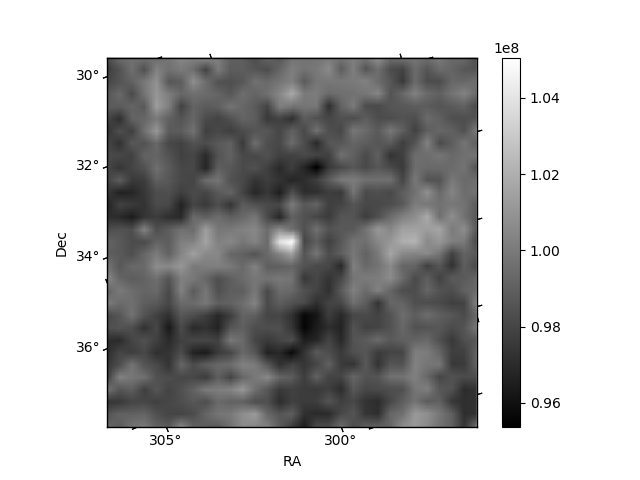
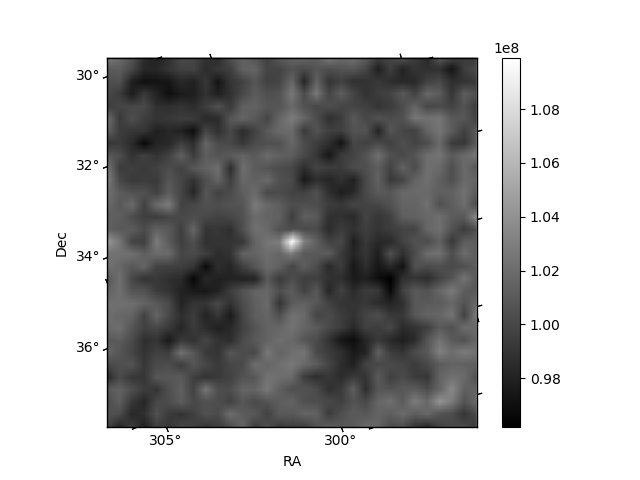
Histogram calculated using DETX and DETY for each event in the final _common_clean file
| Quadrant A | 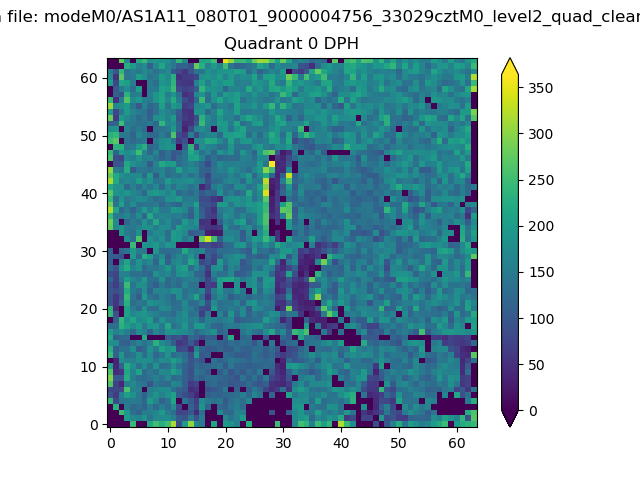 |
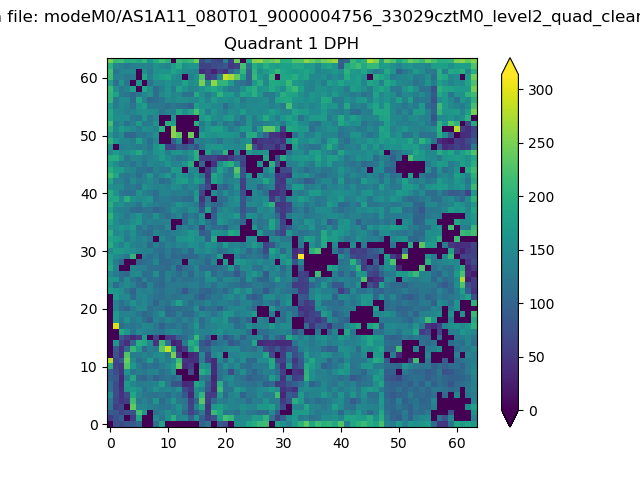 |
Quadrant B |
|---|---|---|---|
| Quadrant D | 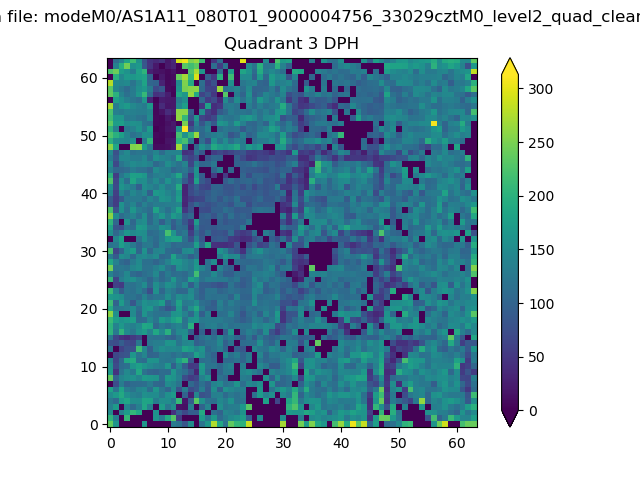 |
 |
Quadrant C |
| Plot type | Count rate plots | Images |
|---|---|---|
| Comparison with Poisson distribution Blue bars denote a histogram of data divided into 1 sec bins. Red curve is a Poisson curve with rate = median count rate of data. |
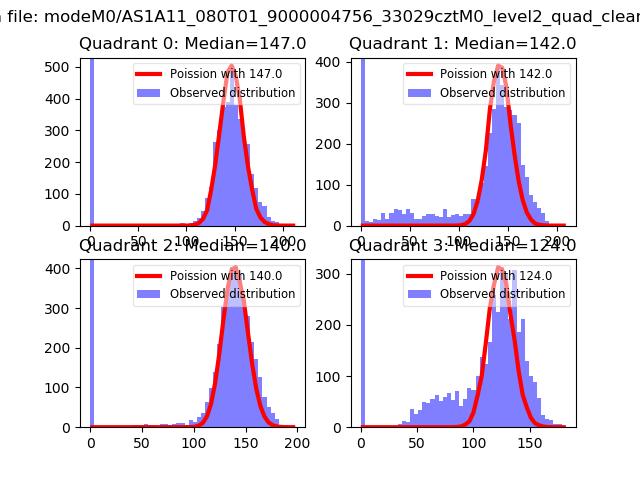 |
 |
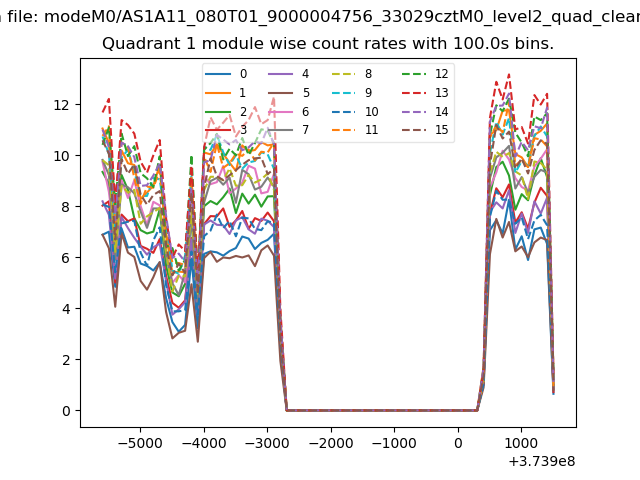
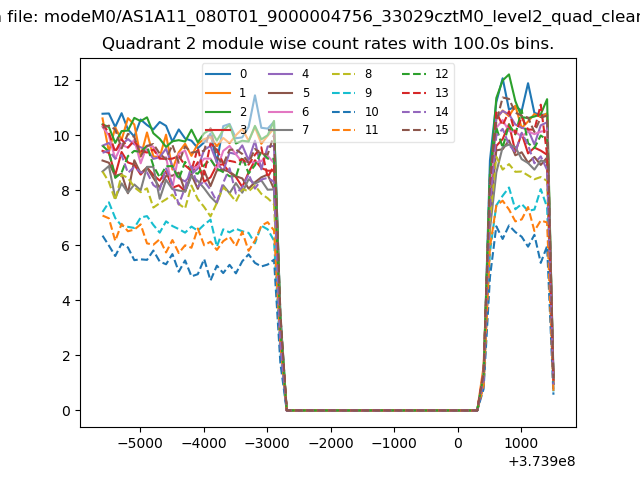
| Quadrant-wise count rates Data is divided into 100 sec bins |
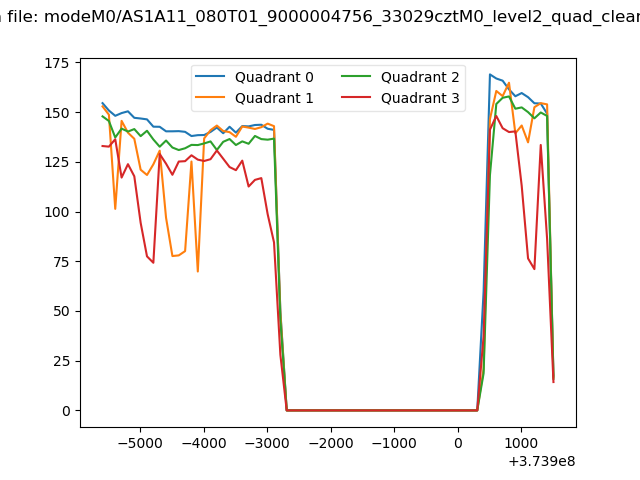 |
|
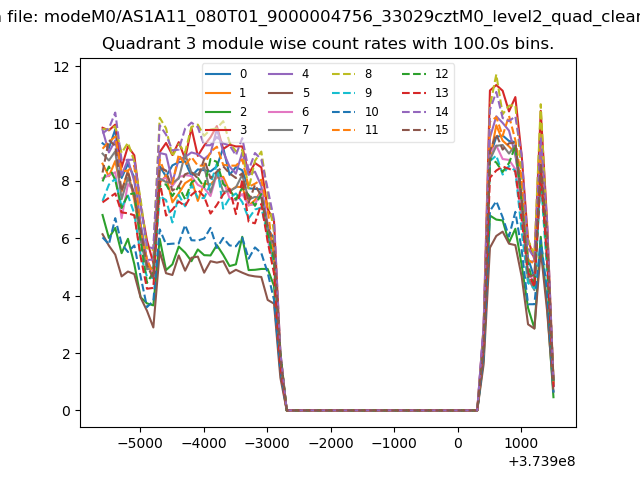
| Module-wise count rates for Quadrant A Data is divided into 100 sec bins |
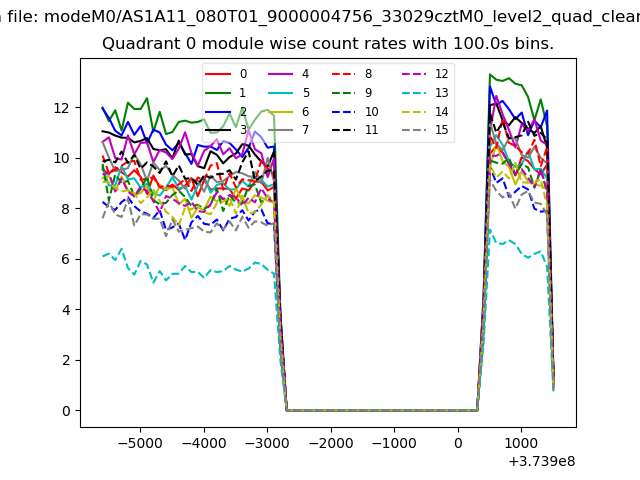 |
 |
| Module-wise count rates for Quadrant B Data is divided into 100 sec bins |
 |
 |
| Module-wise count rates for Quadrant C Data is divided into 100 sec bins |
 |
 |
| Module-wise count rates for Quadrant D Data is divided into 100 sec bins |
 |
 |
| Parameter | Plot |
|---|---|
| CZT HV Monitor | 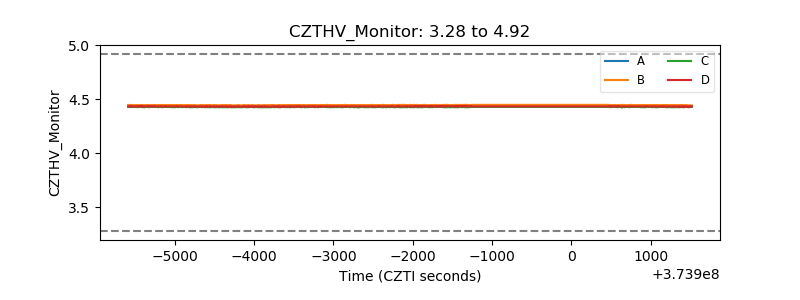 |
| D_VDD | 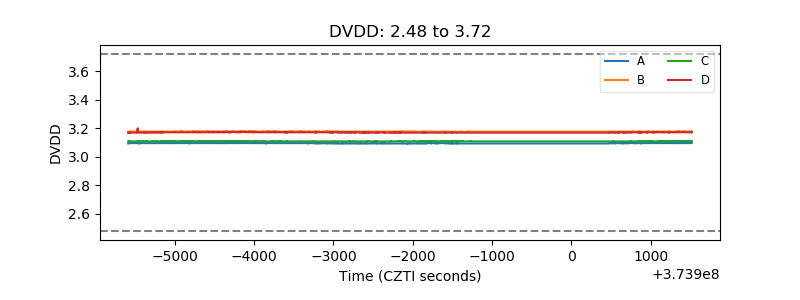 |
| Temperature 1 | 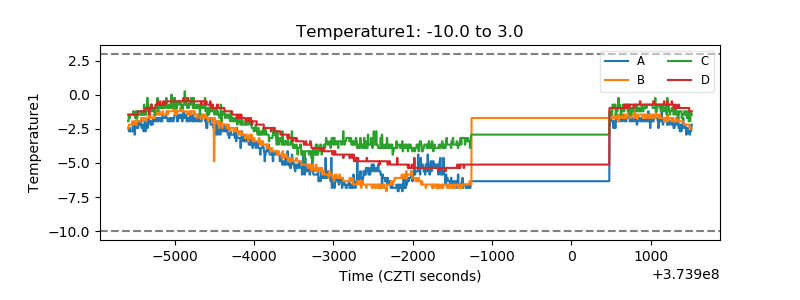 |
| Veto HV Monitor | 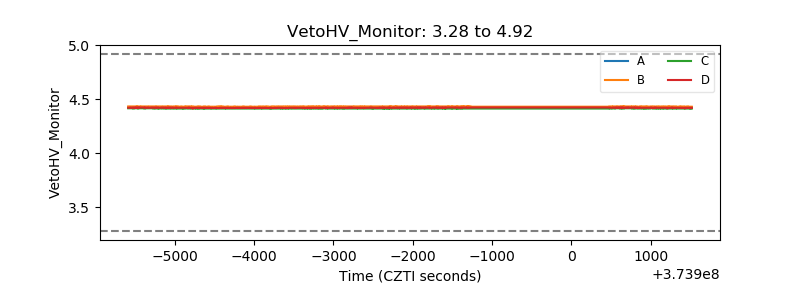 |
| Veto LLD | 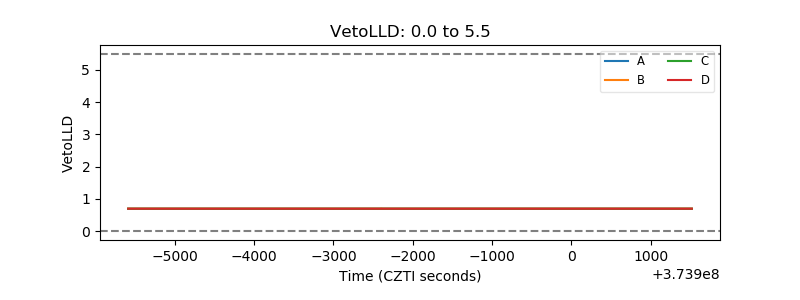 |
| Alpha Counter | 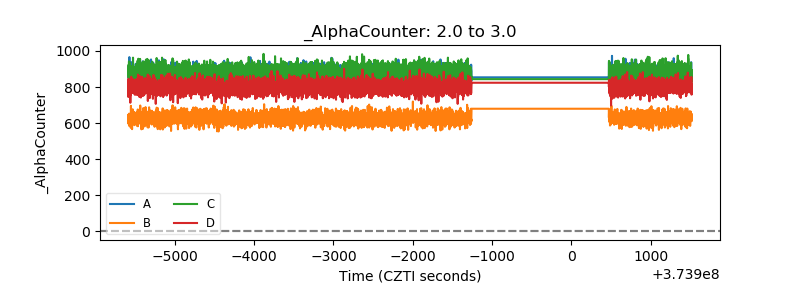 |
| _CPM_Rate | 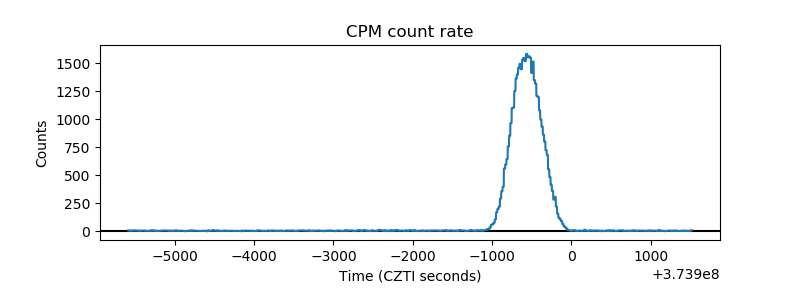 |
| CZT Counter | 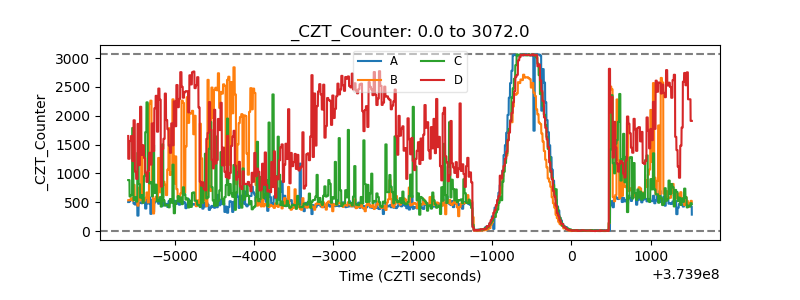 |
| +2.5 Volts monitor |  |
| +5 Volts monitor |  |
| _ROLL_ROT | 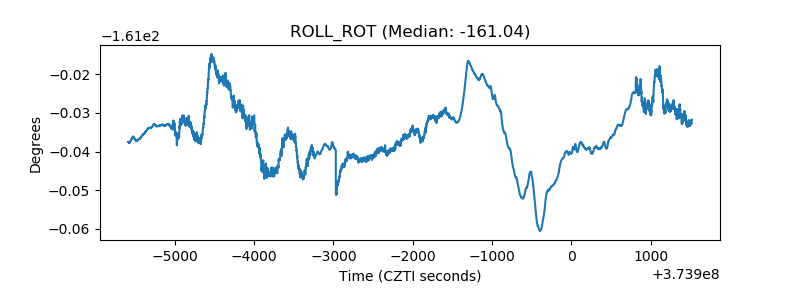 |
| _Roll_DEC | 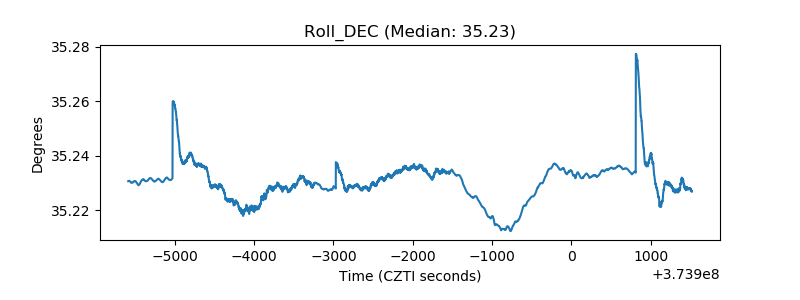 |
| _Roll_RA | 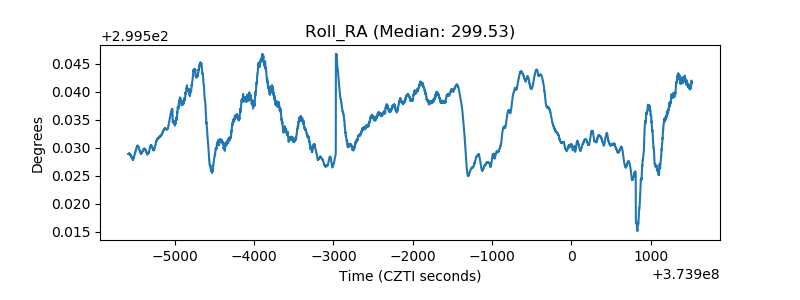 |
| Veto Counter | 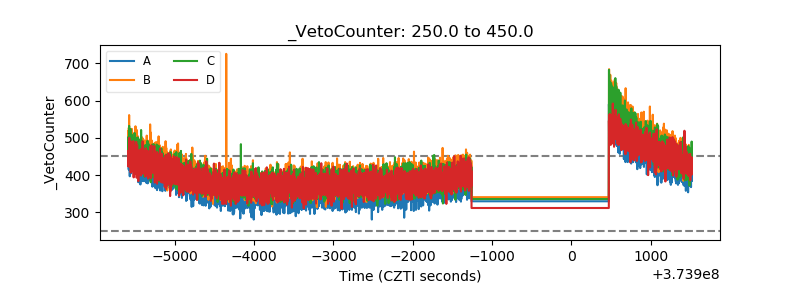 |