| Param | Original file | Final file |
|---|---|---|
| Filename | modeM0/AS1A11_080T01_9000004756_33056cztM0_level2.evt | modeM0/AS1A11_080T01_9000004756_33056cztM0_level2_quad_clean.evt |
| Size (bytes) | 660,919,680 | 89,665,920 |
| Size | 630.3 MB | 85.5 MB |
| Events in quadrant A | 2,632,664 | 635,064 |
| Events in quadrant B | 4,138,263 | 614,400 |
| Events in quadrant C | 2,884,818 | 615,933 |
| Events in quadrant D | 9,983,033 | 459,020 |
| Mode SS | |||
|---|---|---|---|
| Quadrant | BADHDUFLAG | Total packets | Discarded packets |
| A | 0 | 118 | 0 |
| B | 0 | 118 | 0 |
| C | 0 | 118 | 0 |
| D | 0 | 118 | 0 |
| Mode M9 | |||
|---|---|---|---|
| Quadrant | BADHDUFLAG | Total packets | Discarded packets |
| A | 0 | 30 | 0 |
| B | 0 | 30 | 0 |
| C | 0 | 30 | 0 |
| D | 0 | 30 | 0 |
| Mode M0 | |||
|---|---|---|---|
| Quadrant | BADHDUFLAG | Total packets | Discarded packets |
| A | 0 | 11282 | 3 |
| B | 0 | 15841 | 2 |
| C | 0 | 12114 | 2 |
| D | 0 | 33574 | 2 |
| Quadrant | Total seconds | Saturated seconds | Saturation percentage |
|---|---|---|---|
| A | 5569 | 5 | 0.089783% |
| B | 5569 | 361 | 6.482313% |
| C | 5569 | 67 | 1.203089% |
| D | 5569 | 2514 | 45.142755% |
Noise dominated data is calculated using 1-second bins in cleaned event files. If a bin has >2000 counts, and if more than 50% of those come from <1% of pixels, then it is considered to be noise-dominated and hence unusable.
| Quadrant | # 1 sec bins | Bins with >0 counts | Bins with >2000 counts | High rate bins dominated by noise | Noise dominated (total time) | Noise dominated (detector-on time) | Marked lightcurve |
|---|---|---|---|---|---|---|---|
| A | 8645 | 5571 | 0 | 0 | 0.00% | 0.00% | 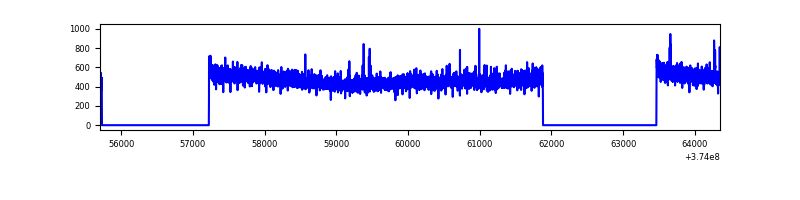 |
| B | 8645 | 5571 | 215 | 215 | 2.49% | 3.86% | 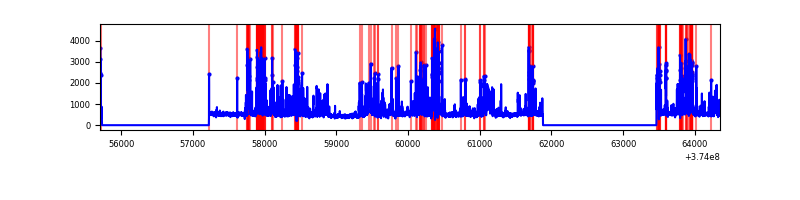 |
| C | 8645 | 5571 | 54 | 54 | 0.62% | 0.97% | 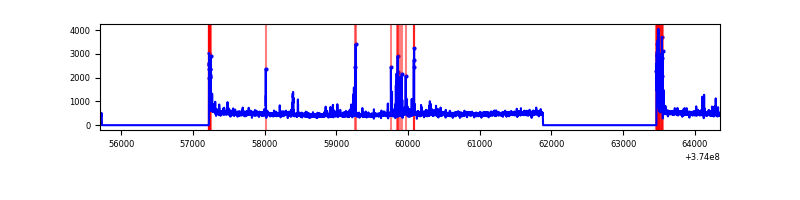 |
| D | 8645 | 5570 | 2367 | 2367 | 27.38% | 42.50% | 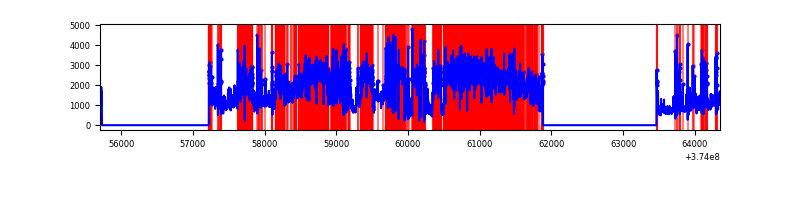 |
Top three noisy pixels from each quadrant. If the there are fewer than three noisy pixels in the level2.evt file, extra rows are filled as -1
| Pixel properties | Quadrant properties | ||||||
|---|---|---|---|---|---|---|---|
| Quadrant | DetID | PixID | Counts | Sigma | Mean | Median | Sigma |
| A | 13 | 6 | 36646 | 264.56 | 669 | 657 | 136.0 |
| A | 13 | 254 | 9254 | 63.2 | 669 | 657 | 136.0 |
| A | 7 | 16 | 7030 | 46.85 | 669 | 657 | 136.0 |
| B | 5 | 172 | 827189 | 6632.39 | 649 | 634 | 124.6 |
| B | 5 | 200 | 214663 | 1717.4 | 649 | 634 | 124.6 |
| B | 5 | 31 | 151646 | 1211.74 | 649 | 634 | 124.6 |
| C | 0 | 10 | 200031 | 1334.59 | 642 | 650 | 149.4 |
| C | 7 | 221 | 97964 | 651.39 | 642 | 650 | 149.4 |
| C | 6 | 247 | 17789 | 114.72 | 642 | 650 | 149.4 |
| D | 7 | 223 | 4490549 | 31926.52 | 529 | 520 | 140.6 |
| D | 7 | 204 | 1179116 | 8380.45 | 529 | 520 | 140.6 |
| D | 8 | 195 | 1157126 | 8224.09 | 529 | 520 | 140.6 |
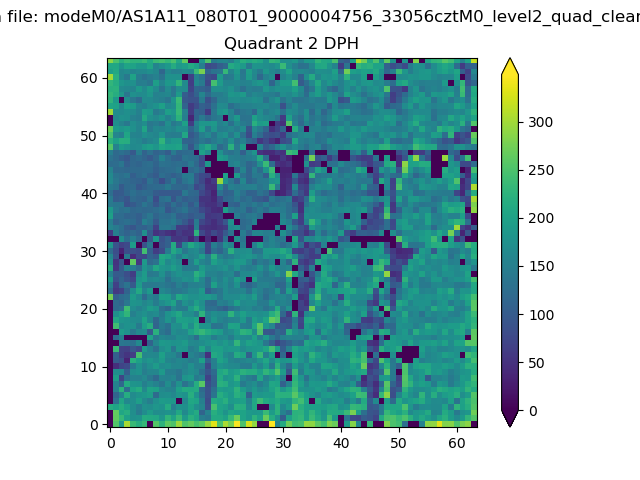
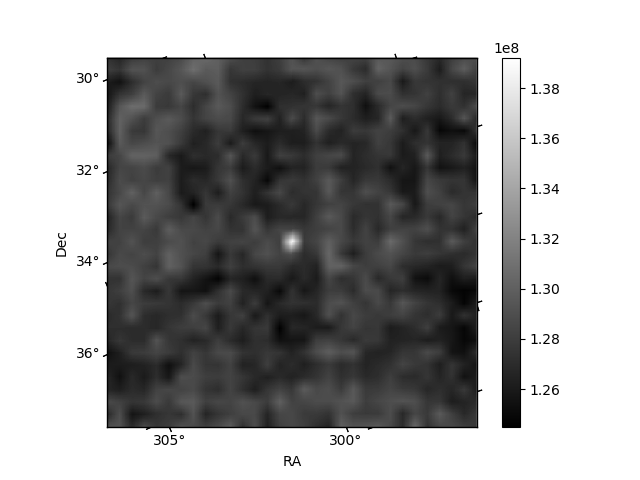
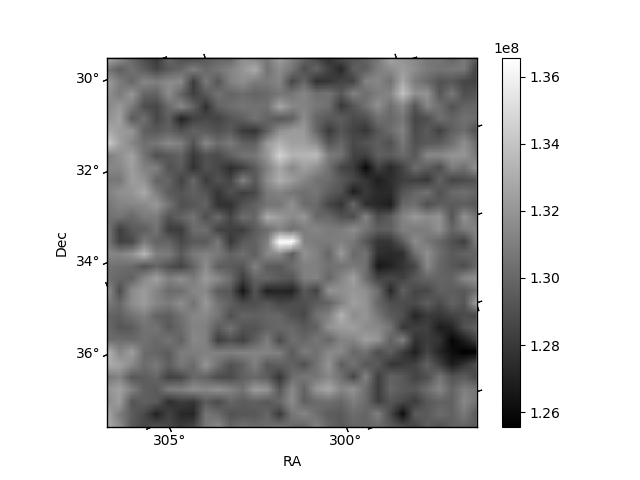
Histogram calculated using DETX and DETY for each event in the final _common_clean file
| Quadrant A | 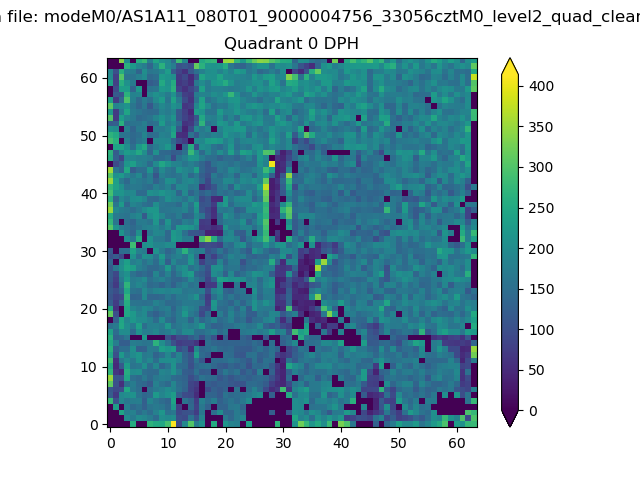 |
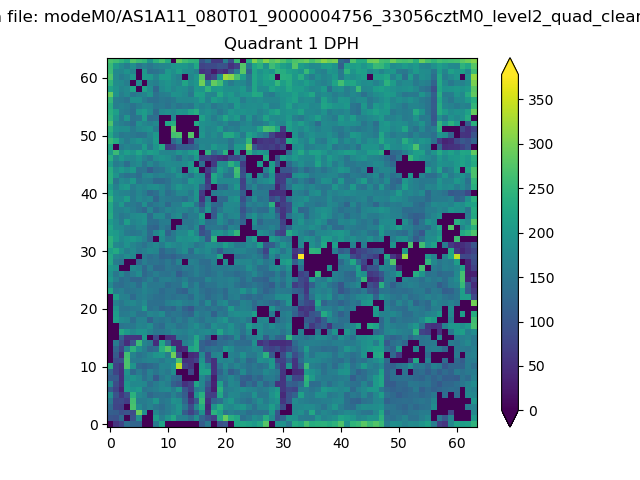 |
Quadrant B |
|---|---|---|---|
| Quadrant D | 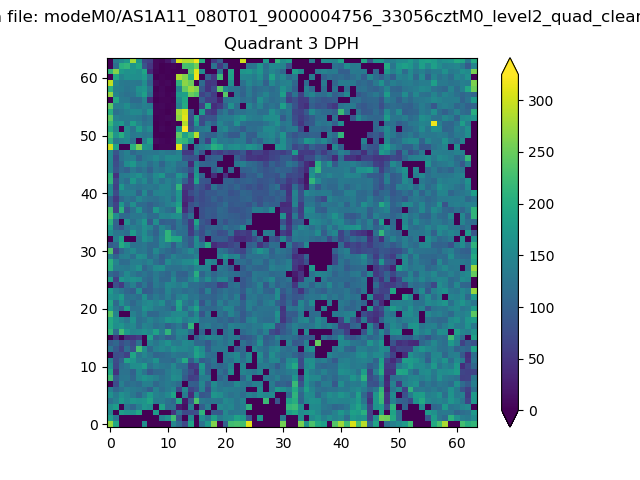 |
 |
Quadrant C |
| Plot type | Count rate plots | Images |
|---|---|---|
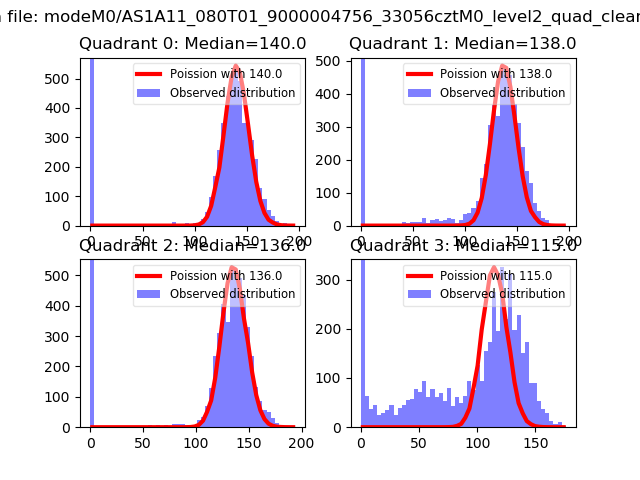
| Comparison with Poisson distribution Blue bars denote a histogram of data divided into 1 sec bins. Red curve is a Poisson curve with rate = median count rate of data. |
 |
 |
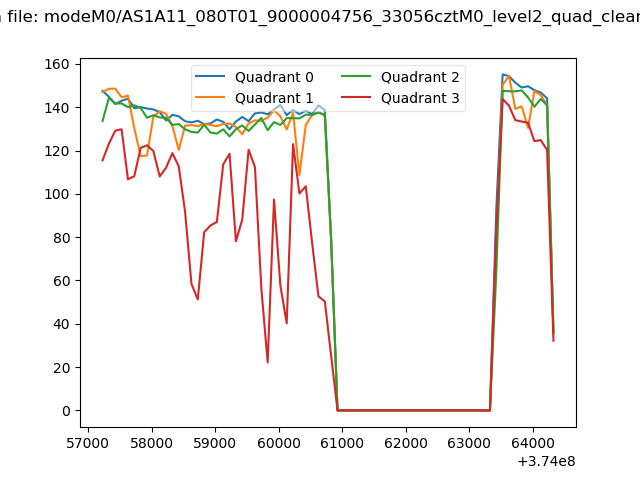
| Quadrant-wise count rates Data is divided into 100 sec bins |
 |
|
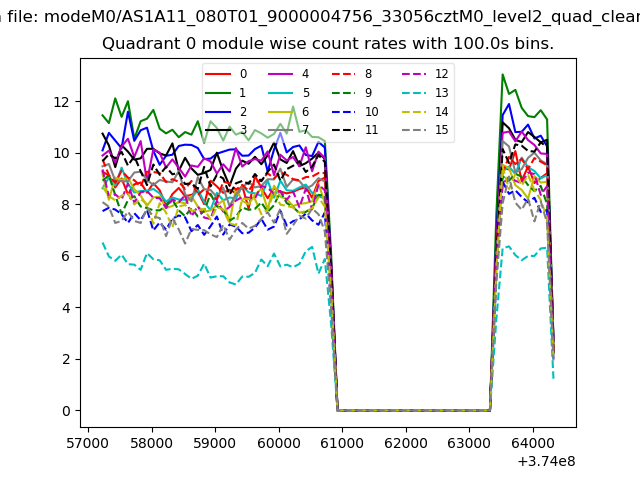
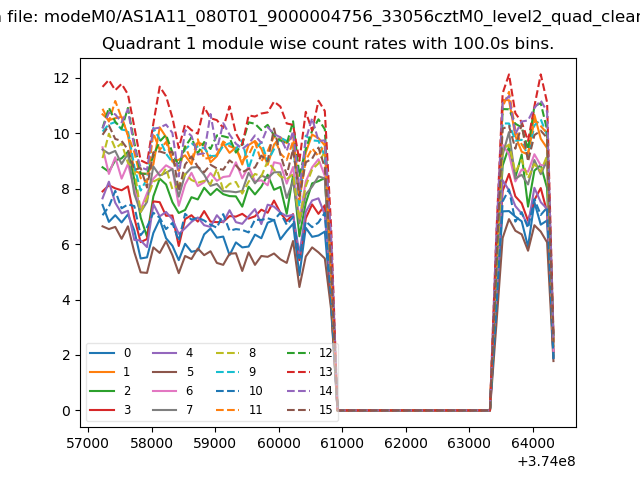
| Module-wise count rates for Quadrant A Data is divided into 100 sec bins |
 |
 |
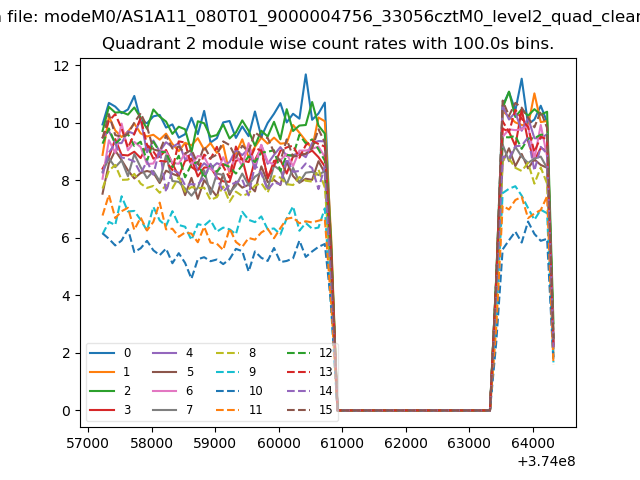
| Module-wise count rates for Quadrant B Data is divided into 100 sec bins |
 |
 |
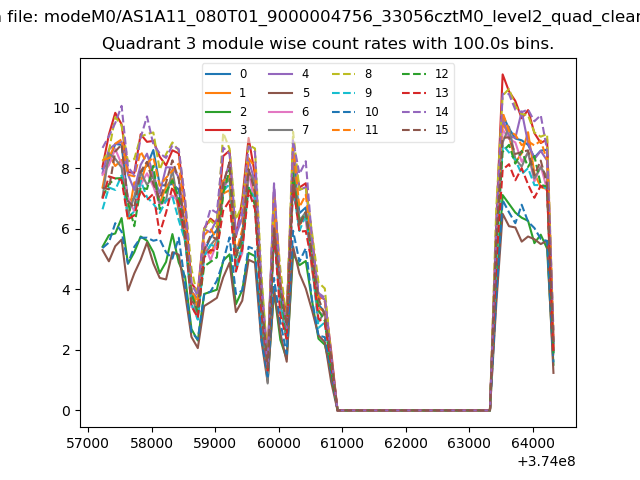
| Module-wise count rates for Quadrant C Data is divided into 100 sec bins |
 |
 |
| Module-wise count rates for Quadrant D Data is divided into 100 sec bins |
 |
 |
| Parameter | Plot |
|---|---|
| CZT HV Monitor | 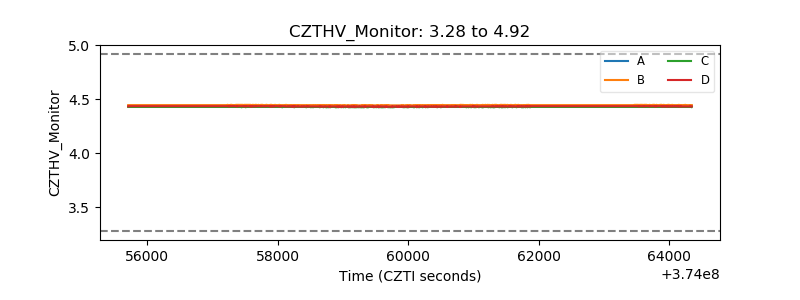 |
| D_VDD | 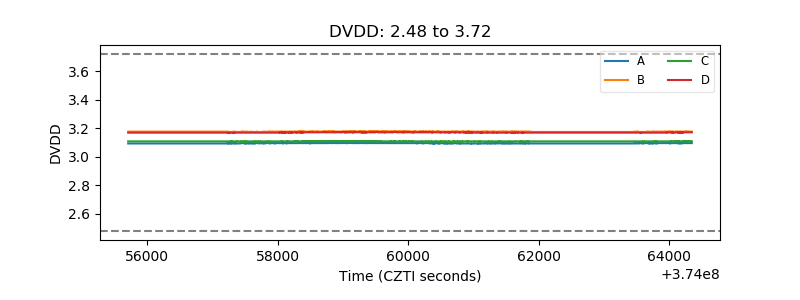 |
| Temperature 1 | 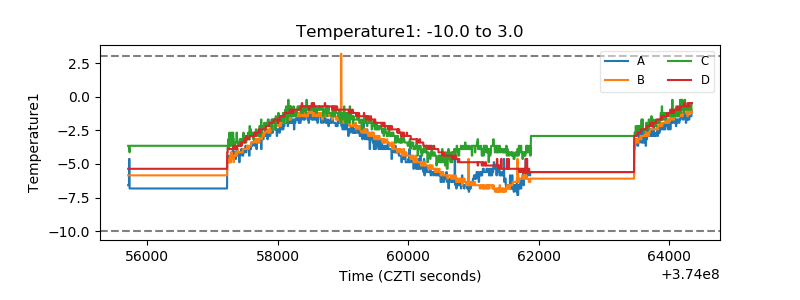 |
| Veto HV Monitor |  |
| Veto LLD | 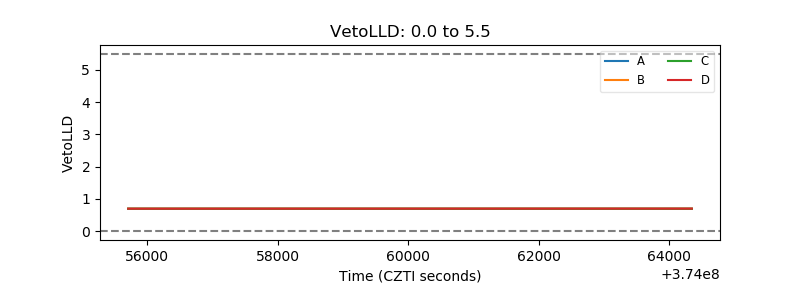 |
| Alpha Counter | 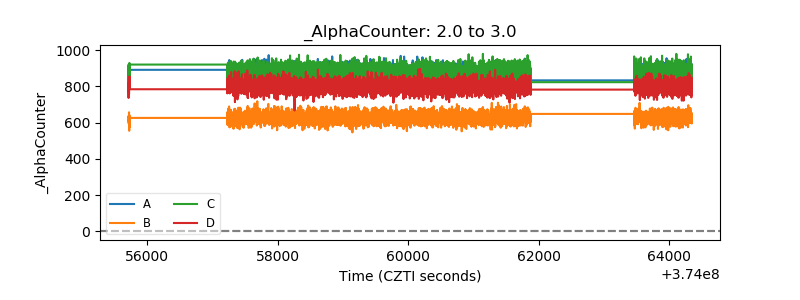 |
| _CPM_Rate | 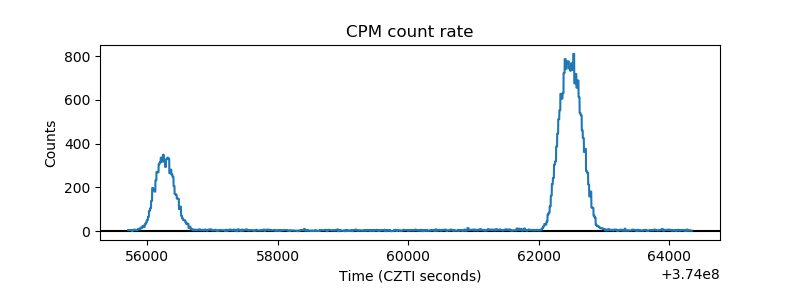 |
| CZT Counter | 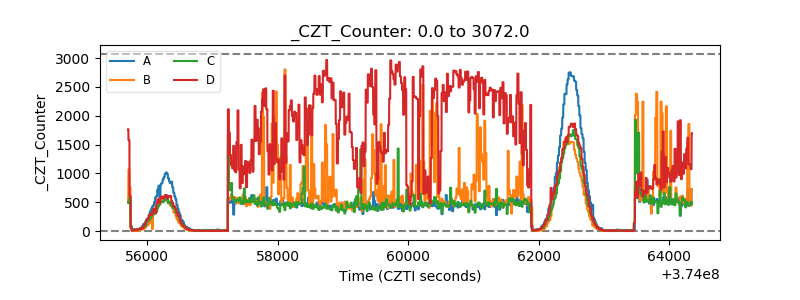 |
| +2.5 Volts monitor | 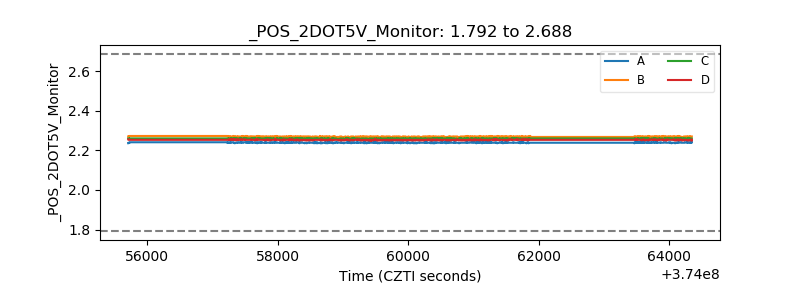 |
| +5 Volts monitor | 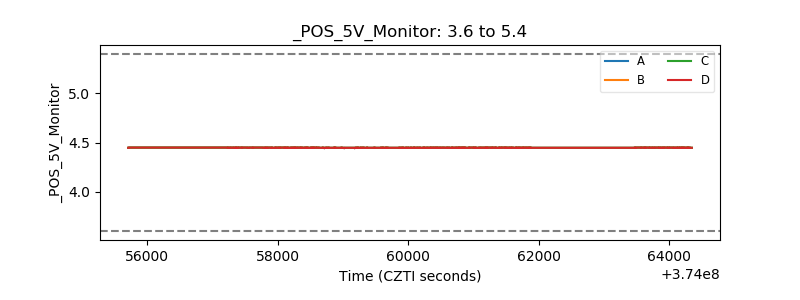 |
| _ROLL_ROT | 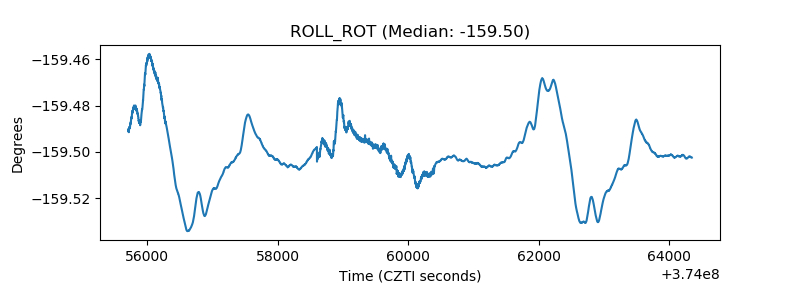 |
| _Roll_DEC | 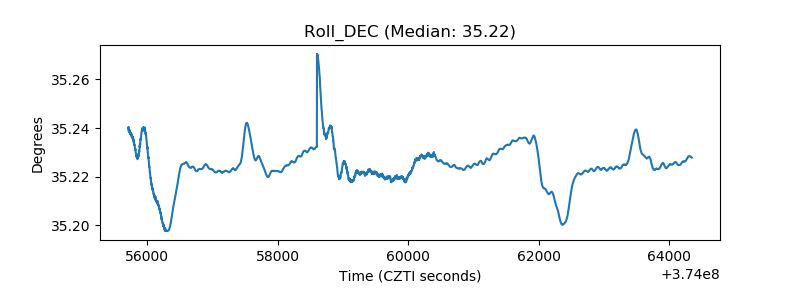 |
| _Roll_RA | 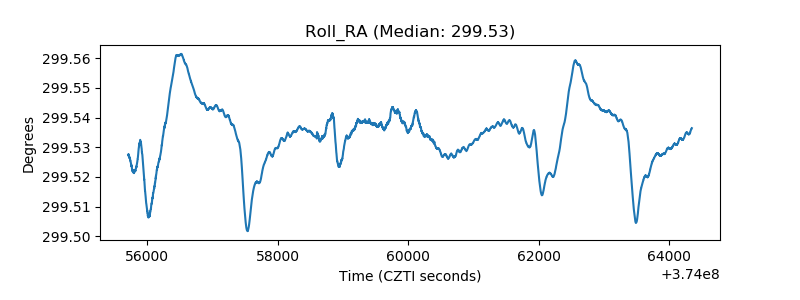 |
| Veto Counter | 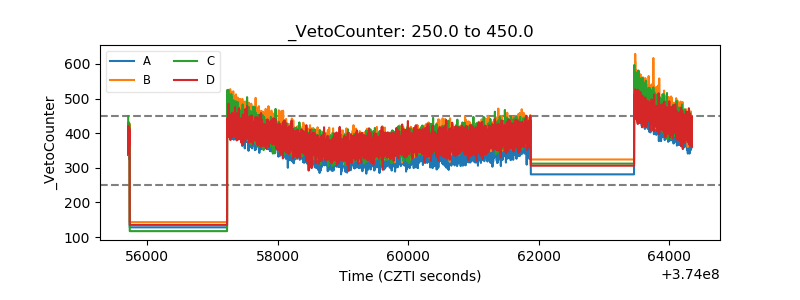 |