| Param | Original file | Final file |
|---|---|---|
| Filename | modeM0/AS1A11_080T01_9000004756_33058cztM0_level2.evt | modeM0/AS1A11_080T01_9000004756_33058cztM0_level2_quad_clean.evt |
| Size (bytes) | 668,223,360 | 84,735,360 |
| Size | 637.3 MB | 80.8 MB |
| Events in quadrant A | 2,600,270 | 606,138 |
| Events in quadrant B | 4,351,112 | 581,809 |
| Events in quadrant C | 3,930,623 | 530,790 |
| Events in quadrant D | 8,987,868 | 466,198 |
| Mode SS | |||
|---|---|---|---|
| Quadrant | BADHDUFLAG | Total packets | Discarded packets |
| A | 0 | 110 | 0 |
| B | 0 | 110 | 0 |
| C | 0 | 110 | 0 |
| D | 0 | 110 | 0 |
| Mode M9 | |||
|---|---|---|---|
| Quadrant | BADHDUFLAG | Total packets | Discarded packets |
| A | 0 | 27 | 0 |
| B | 0 | 27 | 0 |
| C | 0 | 27 | 0 |
| D | 0 | 28 | 0 |
| Mode M0 | |||
|---|---|---|---|
| Quadrant | BADHDUFLAG | Total packets | Discarded packets |
| A | 0 | 11149 | 3 |
| B | 0 | 16394 | 2 |
| C | 0 | 15204 | 2 |
| D | 0 | 30478 | 2 |
| Quadrant | Total seconds | Saturated seconds | Saturation percentage |
|---|---|---|---|
| A | 5432 | 7 | 0.128866% |
| B | 5432 | 506 | 9.315169% |
| C | 5432 | 540 | 9.941090% |
| D | 5432 | 2286 | 42.083947% |
Noise dominated data is calculated using 1-second bins in cleaned event files. If a bin has >2000 counts, and if more than 50% of those come from <1% of pixels, then it is considered to be noise-dominated and hence unusable.
| Quadrant | # 1 sec bins | Bins with >0 counts | Bins with >2000 counts | High rate bins dominated by noise | Noise dominated (total time) | Noise dominated (detector-on time) | Marked lightcurve |
|---|---|---|---|---|---|---|---|
| A | 7165 | 5433 | 0 | 0 | 0.00% | 0.00% | 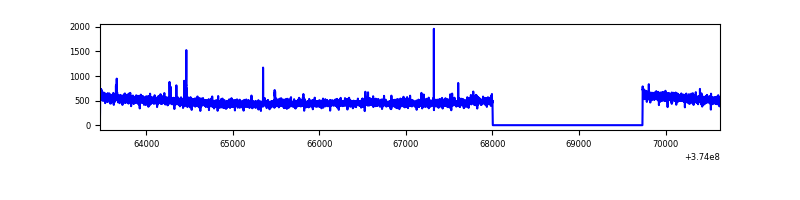 |
| B | 7165 | 5433 | 351 | 351 | 4.90% | 6.46% | 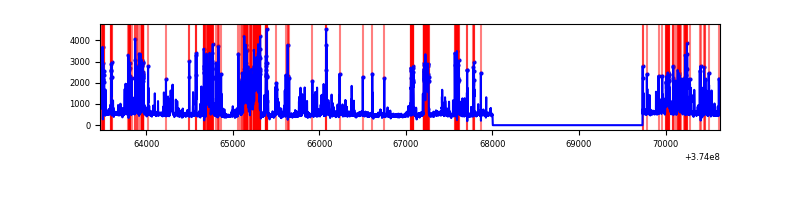 |
| C | 7165 | 5433 | 481 | 481 | 6.71% | 8.85% | 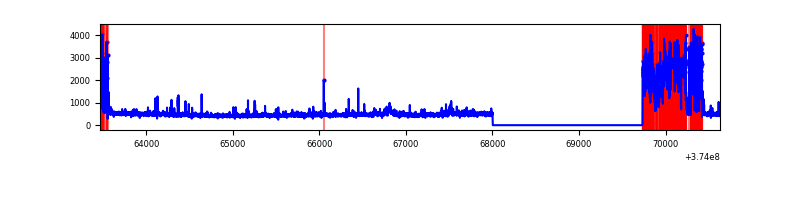 |
| D | 7164 | 5432 | 2232 | 2232 | 31.16% | 41.09% | 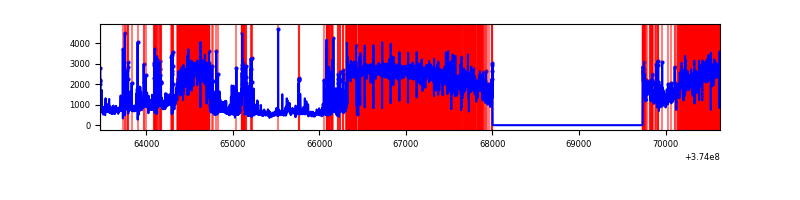 |
Top three noisy pixels from each quadrant. If the there are fewer than three noisy pixels in the level2.evt file, extra rows are filled as -1
| Pixel properties | Quadrant properties | ||||||
|---|---|---|---|---|---|---|---|
| Quadrant | DetID | PixID | Counts | Sigma | Mean | Median | Sigma |
| A | 15 | 169 | 17667 | 128.52 | 659 | 646 | 132.4 |
| A | 13 | 6 | 17025 | 123.67 | 659 | 646 | 132.4 |
| A | 14 | 4 | 10546 | 74.75 | 659 | 646 | 132.4 |
| B | 5 | 172 | 1155929 | 9603.51 | 633 | 620 | 120.3 |
| B | 5 | 200 | 241737 | 2004.29 | 633 | 620 | 120.3 |
| B | 5 | 31 | 162558 | 1346.11 | 633 | 620 | 120.3 |
| C | 1 | 23 | 1312938 | 9439.9 | 594 | 601 | 139.0 |
| C | 0 | 10 | 210255 | 1508.08 | 594 | 601 | 139.0 |
| C | 7 | 221 | 39169 | 277.43 | 594 | 601 | 139.0 |
| D | 7 | 223 | 5463181 | 39700.14 | 526 | 517 | 137.6 |
| D | 8 | 195 | 532779 | 3868.24 | 526 | 517 | 137.6 |
| D | 2 | 250 | 383947 | 2786.59 | 526 | 517 | 137.6 |
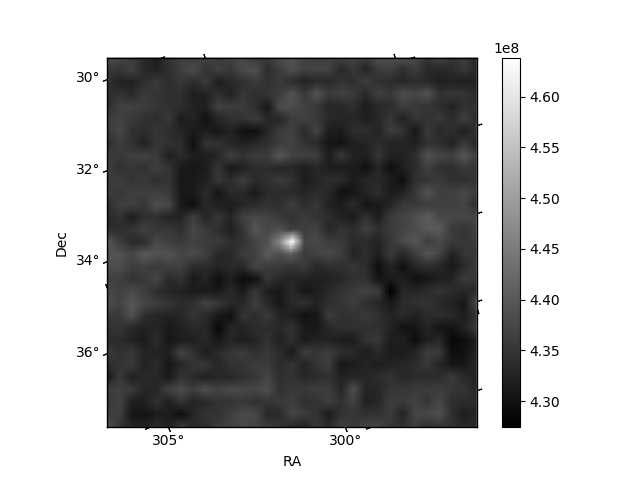
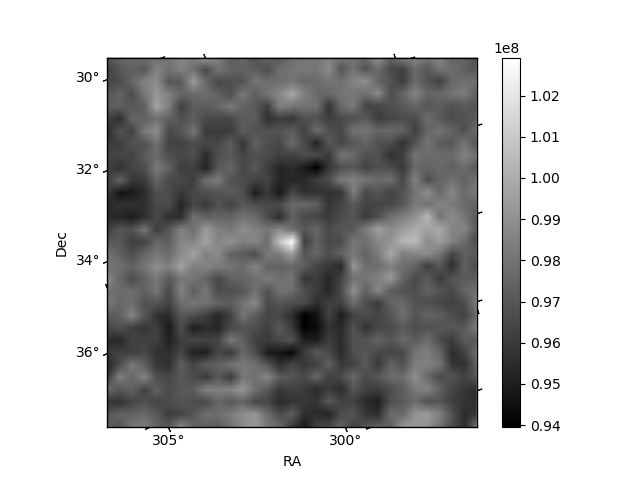
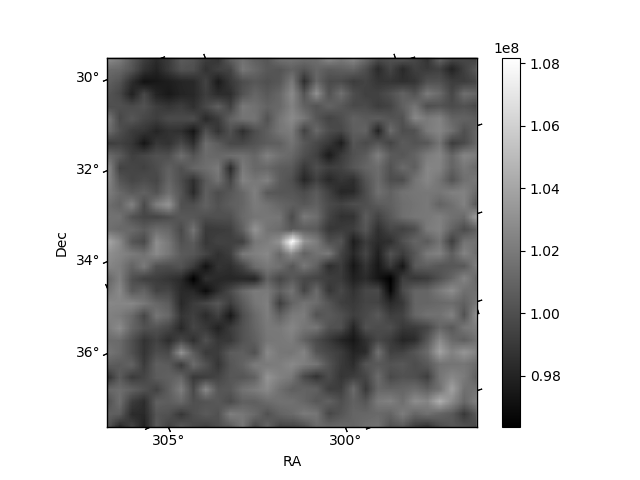
Histogram calculated using DETX and DETY for each event in the final _common_clean file
| Quadrant A | 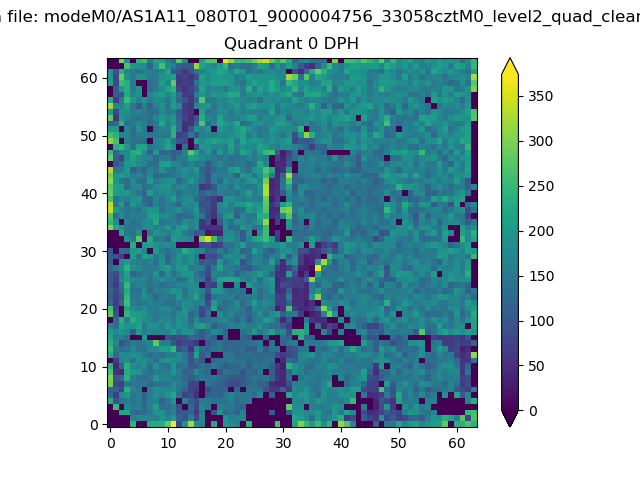 |
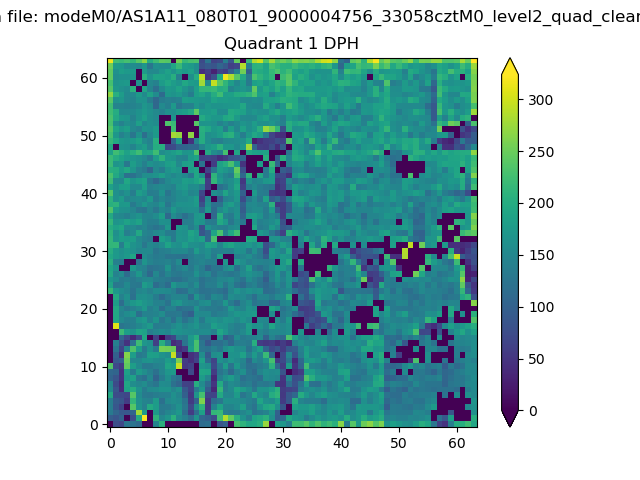 |
Quadrant B |
|---|---|---|---|
| Quadrant D | 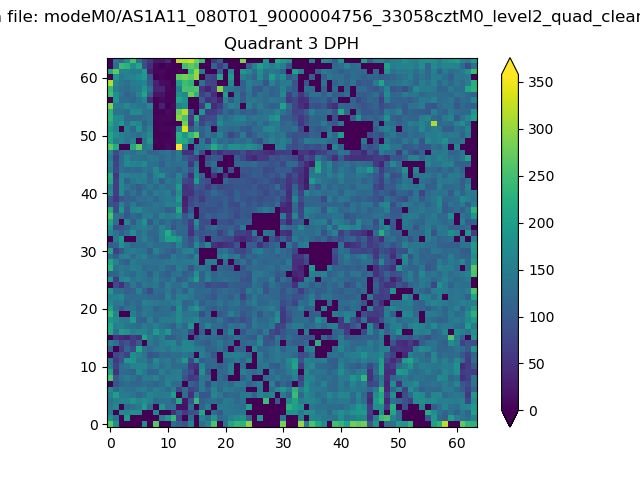 |
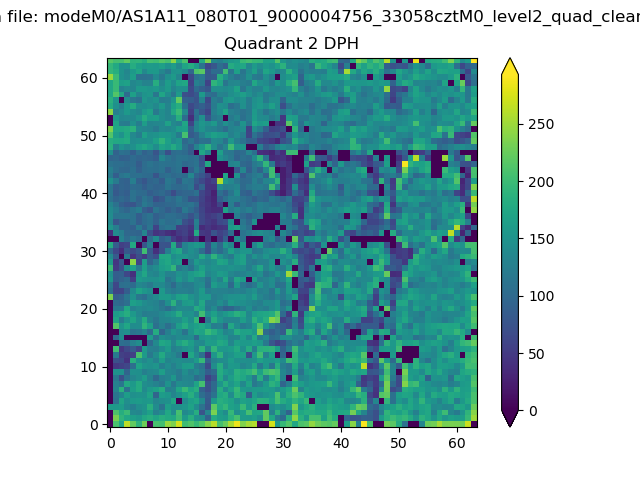 |
Quadrant C |
| Plot type | Count rate plots | Images |
|---|---|---|
| Comparison with Poisson distribution Blue bars denote a histogram of data divided into 1 sec bins. Red curve is a Poisson curve with rate = median count rate of data. |
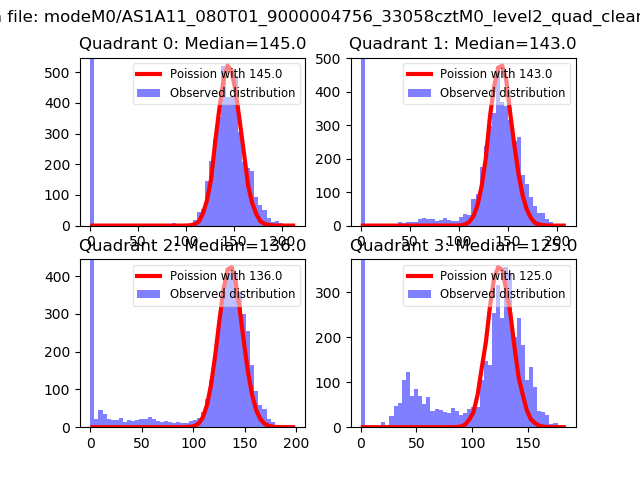 |
 |
| Quadrant-wise count rates Data is divided into 100 sec bins |
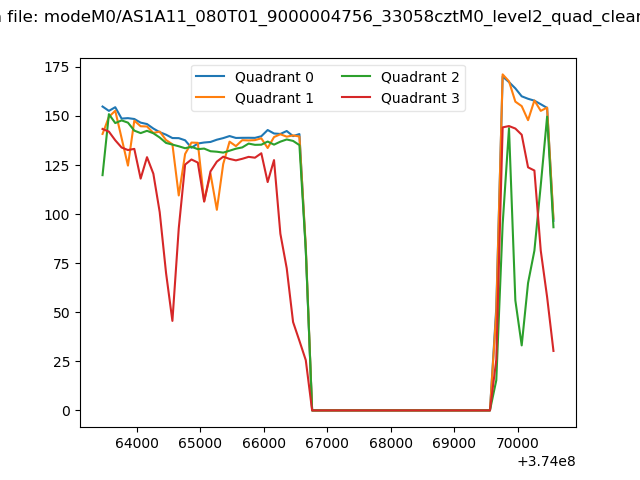 |
|
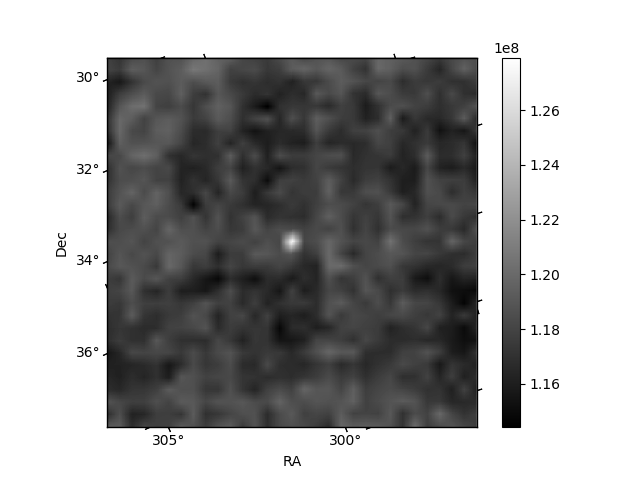
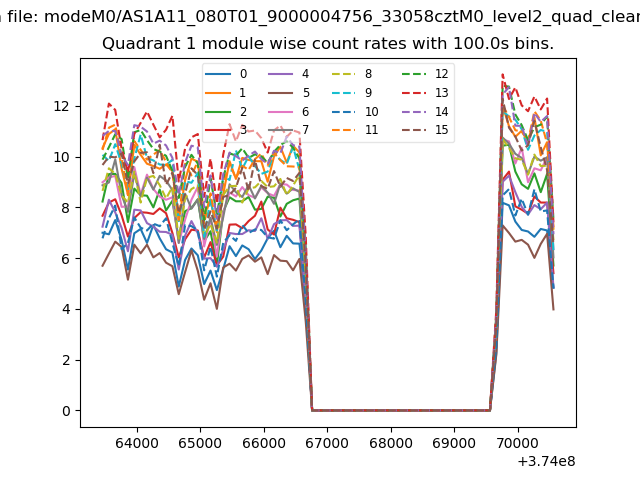
| Module-wise count rates for Quadrant A Data is divided into 100 sec bins |
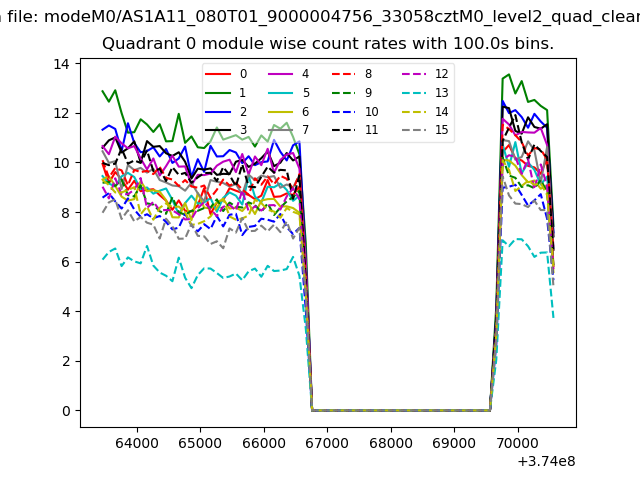 |
 |
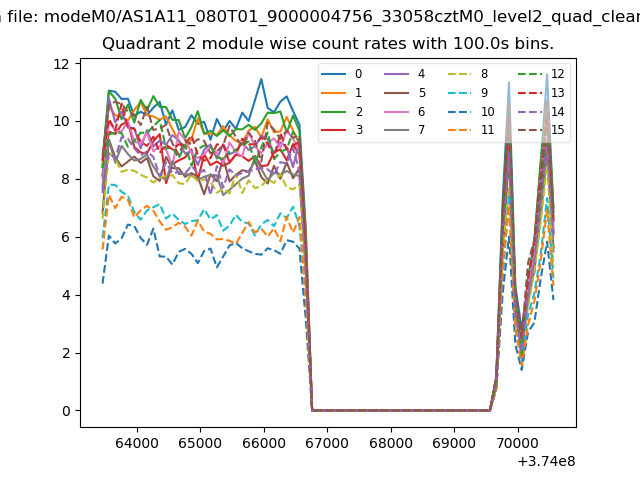
| Module-wise count rates for Quadrant B Data is divided into 100 sec bins |
 |
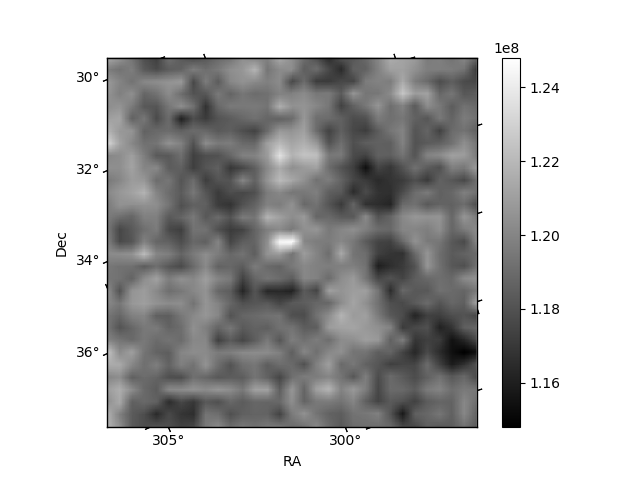 |
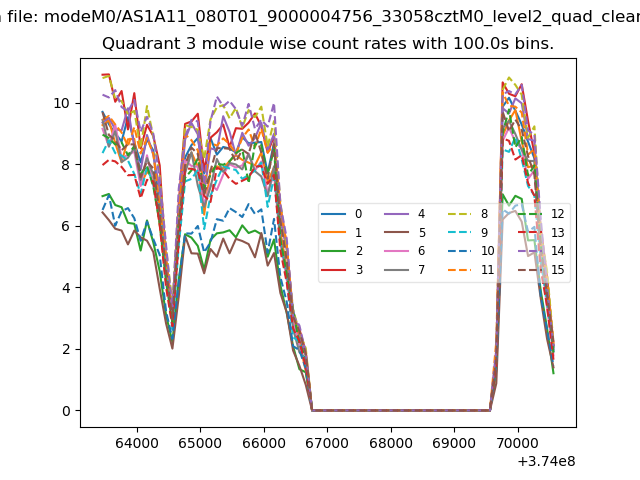
| Module-wise count rates for Quadrant C Data is divided into 100 sec bins |
 |
 |
| Module-wise count rates for Quadrant D Data is divided into 100 sec bins |
 |
 |
| Parameter | Plot |
|---|---|
| CZT HV Monitor | 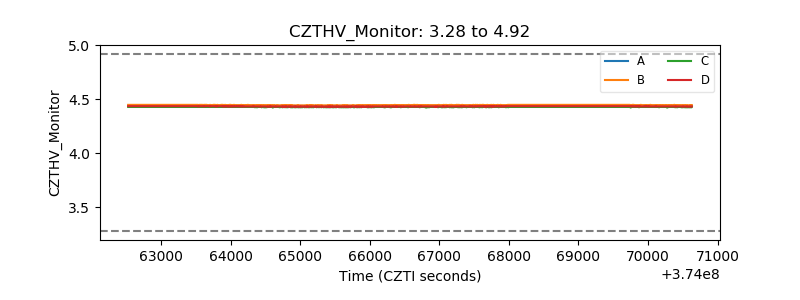 |
| D_VDD | 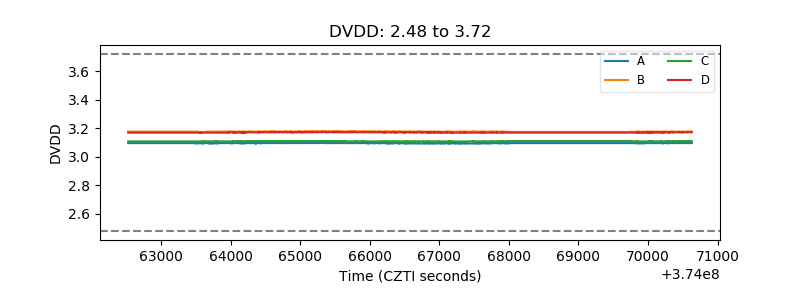 |
| Temperature 1 | 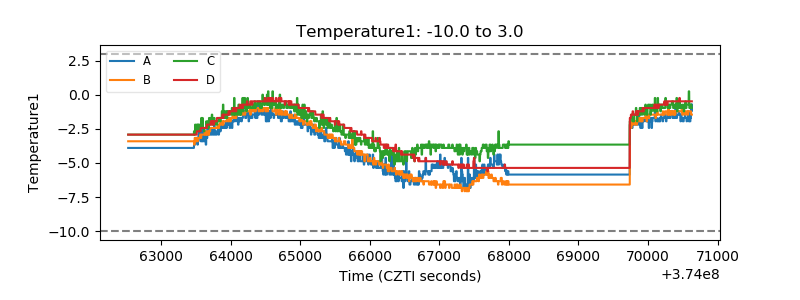 |
| Veto HV Monitor | 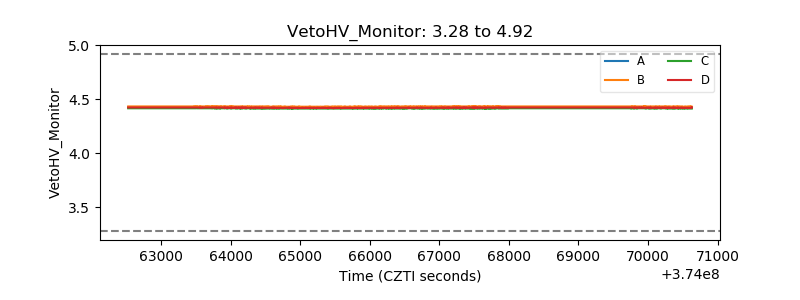 |
| Veto LLD | 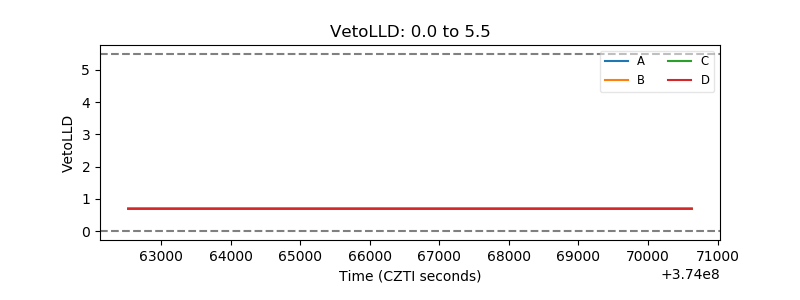 |
| Alpha Counter | 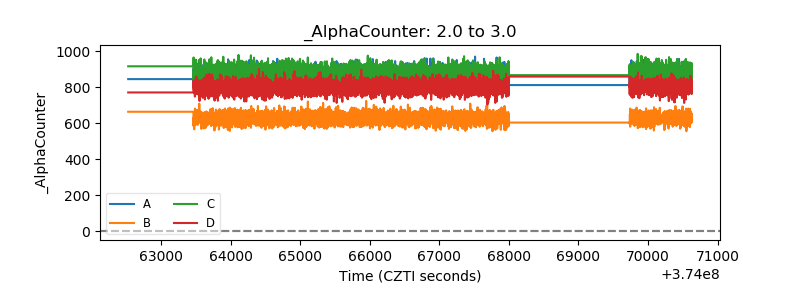 |
| _CPM_Rate | 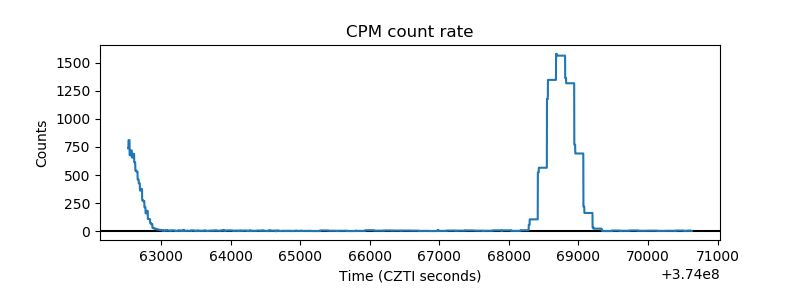 |
| CZT Counter | 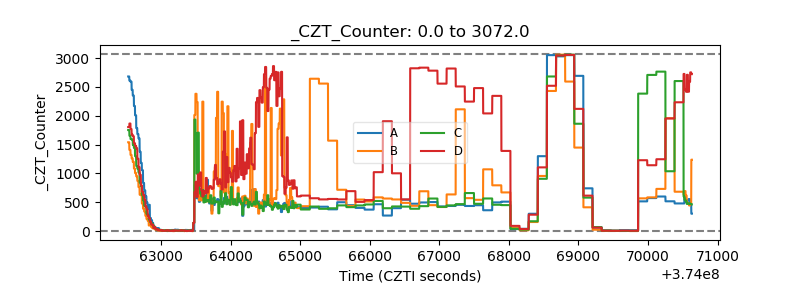 |
| +2.5 Volts monitor | 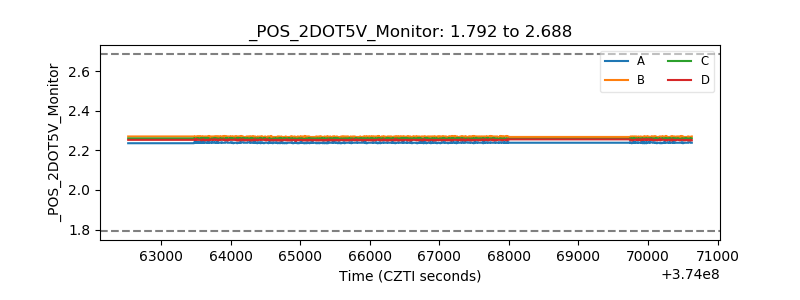 |
| +5 Volts monitor | 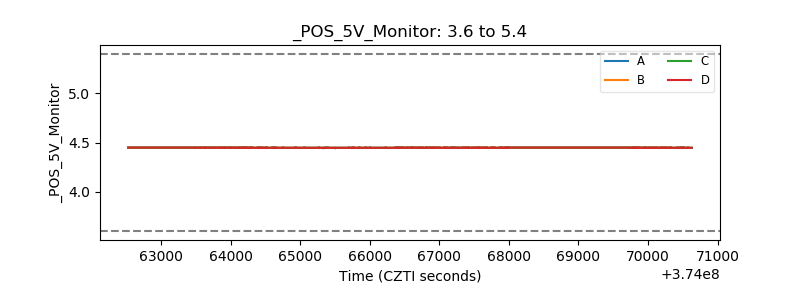 |
| _ROLL_ROT | 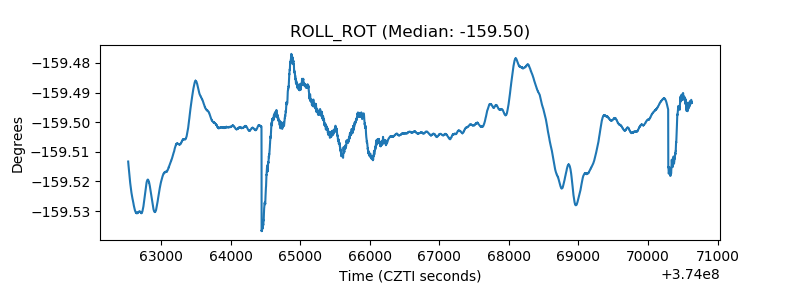 |
| _Roll_DEC | 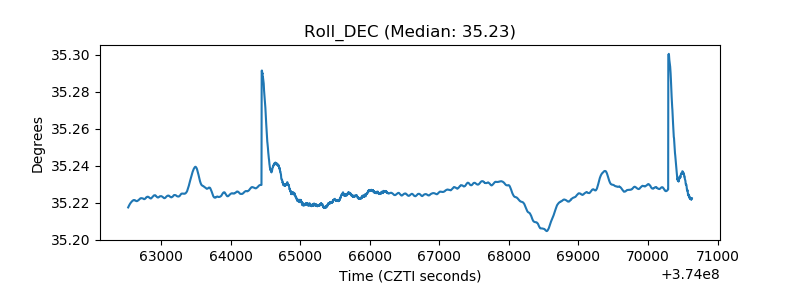 |
| _Roll_RA | 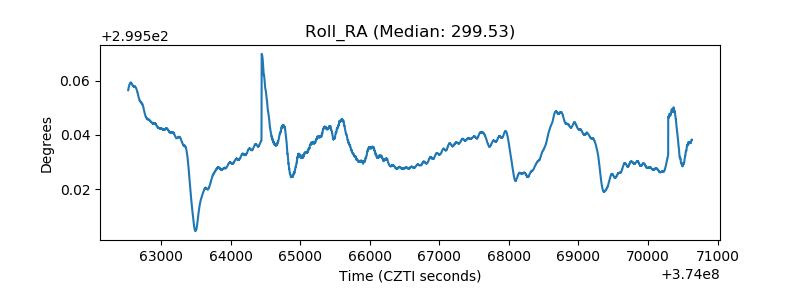 |
| Veto Counter | 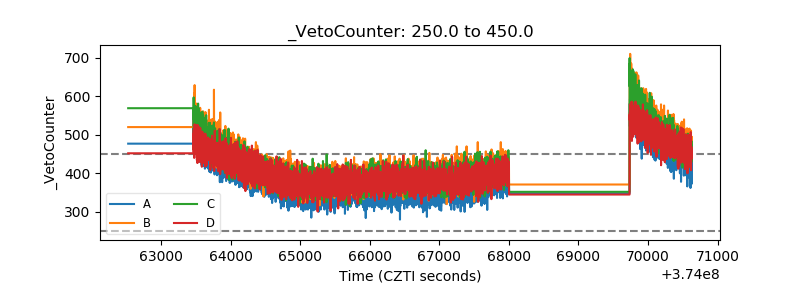 |