| Param | Original file | Final file |
|---|---|---|
| Filename | modeM0/AS1A11_080T01_9000004756_33059cztM0_level2.evt | modeM0/AS1A11_080T01_9000004756_33059cztM0_level2_quad_clean.evt |
| Size (bytes) | 695,427,840 | 85,394,880 |
| Size | 663.2 MB | 81.4 MB |
| Events in quadrant A | 2,759,796 | 611,299 |
| Events in quadrant B | 3,661,576 | 596,789 |
| Events in quadrant C | 4,063,138 | 532,974 |
| Events in quadrant D | 10,203,726 | 457,965 |
| Mode SS | |||
|---|---|---|---|
| Quadrant | BADHDUFLAG | Total packets | Discarded packets |
| A | 0 | 112 | 0 |
| B | 0 | 112 | 0 |
| C | 0 | 112 | 0 |
| D | 0 | 112 | 0 |
| Mode M9 | |||
|---|---|---|---|
| Quadrant | BADHDUFLAG | Total packets | Discarded packets |
| A | 0 | 19 | 0 |
| B | 0 | 19 | 0 |
| C | 0 | 19 | 0 |
| D | 0 | 20 | 0 |
| Mode M0 | |||
|---|---|---|---|
| Quadrant | BADHDUFLAG | Total packets | Discarded packets |
| A | 0 | 11523 | 3 |
| B | 0 | 14327 | 2 |
| C | 0 | 15465 | 2 |
| D | 0 | 34178 | 2 |
| Quadrant | Total seconds | Saturated seconds | Saturation percentage |
|---|---|---|---|
| A | 5517 | 5 | 0.090629% |
| B | 5517 | 217 | 3.933297% |
| C | 5517 | 544 | 9.860431% |
| D | 5517 | 2828 | 51.259743% |
Noise dominated data is calculated using 1-second bins in cleaned event files. If a bin has >2000 counts, and if more than 50% of those come from <1% of pixels, then it is considered to be noise-dominated and hence unusable.
| Quadrant | # 1 sec bins | Bins with >0 counts | Bins with >2000 counts | High rate bins dominated by noise | Noise dominated (total time) | Noise dominated (detector-on time) | Marked lightcurve |
|---|---|---|---|---|---|---|---|
| A | 7370 | 5518 | 0 | 0 | 0.00% | 0.00% | 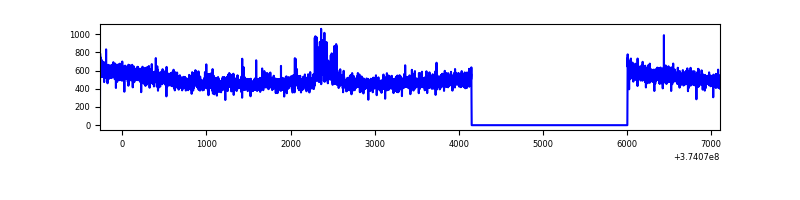 |
| B | 7370 | 5518 | 171 | 171 | 2.32% | 3.10% | 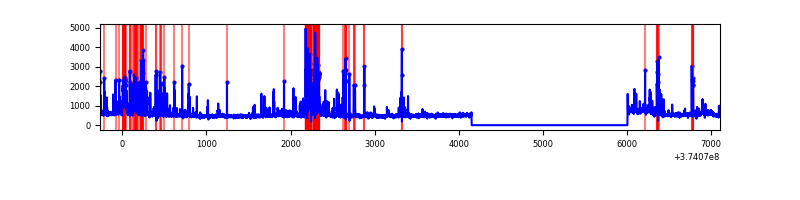 |
| C | 7370 | 5518 | 493 | 493 | 6.69% | 8.93% | 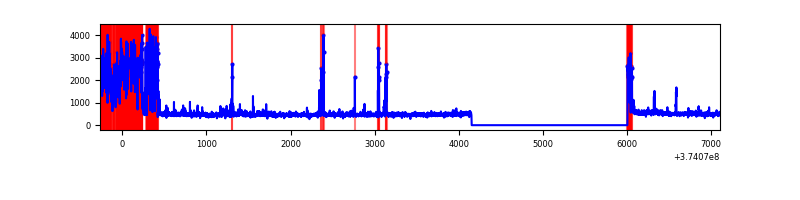 |
| D | 7370 | 5518 | 2783 | 2783 | 37.76% | 50.43% | 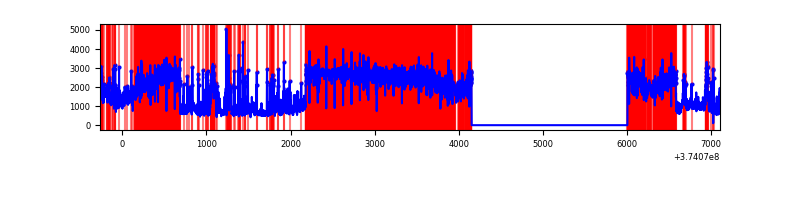 |
Top three noisy pixels from each quadrant. If the there are fewer than three noisy pixels in the level2.evt file, extra rows are filled as -1
| Pixel properties | Quadrant properties | ||||||
|---|---|---|---|---|---|---|---|
| Quadrant | DetID | PixID | Counts | Sigma | Mean | Median | Sigma |
| A | 15 | 169 | 81371 | 591.41 | 683 | 671 | 136.5 |
| A | 13 | 6 | 21267 | 150.94 | 683 | 671 | 136.5 |
| A | 14 | 4 | 14127 | 98.61 | 683 | 671 | 136.5 |
| B | 5 | 200 | 419507 | 3360.72 | 668 | 655 | 124.6 |
| B | 5 | 172 | 229200 | 1833.76 | 668 | 655 | 124.6 |
| B | 5 | 31 | 91740 | 730.83 | 668 | 655 | 124.6 |
| C | 1 | 23 | 1351642 | 9410.88 | 619 | 626 | 143.6 |
| C | 0 | 10 | 188377 | 1307.83 | 619 | 626 | 143.6 |
| C | 7 | 221 | 60696 | 418.43 | 619 | 626 | 143.6 |
| D | 7 | 223 | 6359375 | 45334.08 | 528 | 517 | 140.3 |
| D | 8 | 195 | 943770 | 6724.71 | 528 | 517 | 140.3 |
| D | 2 | 250 | 307490 | 2188.5 | 528 | 517 | 140.3 |
Histogram calculated using DETX and DETY for each event in the final _common_clean file
| Quadrant A |  |
 |
Quadrant B |
|---|---|---|---|
| Quadrant D |  |
 |
Quadrant C |
| Plot type | Count rate plots | Images |
|---|---|---|
| Comparison with Poisson distribution Blue bars denote a histogram of data divided into 1 sec bins. Red curve is a Poisson curve with rate = median count rate of data. |
 |
 |
| Quadrant-wise count rates Data is divided into 100 sec bins |
 |
|
| Module-wise count rates for Quadrant A Data is divided into 100 sec bins |
 |
 |
| Module-wise count rates for Quadrant B Data is divided into 100 sec bins |
 |
 |
| Module-wise count rates for Quadrant C Data is divided into 100 sec bins |
 |
 |
| Module-wise count rates for Quadrant D Data is divided into 100 sec bins |
 |
 |
| Parameter | Plot |
|---|---|
| CZT HV Monitor |  |
| D_VDD | 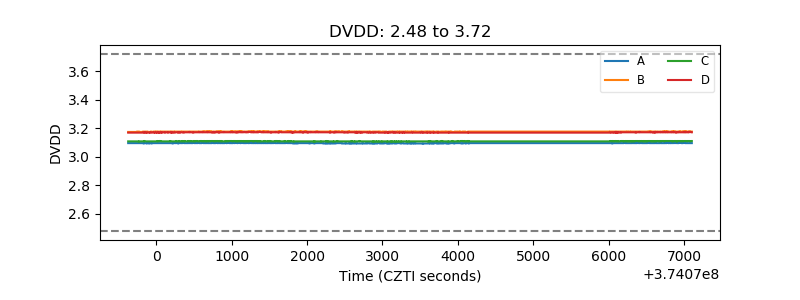 |
| Temperature 1 |  |
| Veto HV Monitor |  |
| Veto LLD |  |
| Alpha Counter |  |
| _CPM_Rate |  |
| CZT Counter |  |
| +2.5 Volts monitor |  |
| +5 Volts monitor |  |
| _ROLL_ROT |  |
| _Roll_DEC |  |
| _Roll_RA |  |
| Veto Counter |  |