| Param | Original file | Final file |
|---|---|---|
| Filename | modeM0/AS1A11_080T01_9000004756_33060cztM0_level2.evt | modeM0/AS1A11_080T01_9000004756_33060cztM0_level2_quad_clean.evt |
| Size (bytes) | 617,425,920 | 77,676,480 |
| Size | 588.8 MB | 74.1 MB |
| Events in quadrant A | 2,569,685 | 540,423 |
| Events in quadrant B | 3,289,169 | 539,222 |
| Events in quadrant C | 2,882,089 | 518,402 |
| Events in quadrant D | 9,604,243 | 387,526 |
| Mode SS | |||
|---|---|---|---|
| Quadrant | BADHDUFLAG | Total packets | Discarded packets |
| A | 0 | 106 | 0 |
| B | 0 | 106 | 0 |
| C | 0 | 106 | 0 |
| D | 0 | 106 | 0 |
| Mode M9 | |||
|---|---|---|---|
| Quadrant | BADHDUFLAG | Total packets | Discarded packets |
| A | 0 | 20 | 0 |
| B | 0 | 20 | 0 |
| C | 0 | 20 | 0 |
| D | 0 | 20 | 0 |
| Mode M0 | |||
|---|---|---|---|
| Quadrant | BADHDUFLAG | Total packets | Discarded packets |
| A | 0 | 10702 | 2 |
| B | 0 | 12962 | 1 |
| C | 0 | 11695 | 1 |
| D | 0 | 32221 | 1 |
| Quadrant | Total seconds | Saturated seconds | Saturation percentage |
|---|---|---|---|
| A | 5226 | 4 | 0.076540% |
| B | 5226 | 165 | 3.157290% |
| C | 5226 | 67 | 1.282051% |
| D | 5226 | 2523 | 48.277842% |
Noise dominated data is calculated using 1-second bins in cleaned event files. If a bin has >2000 counts, and if more than 50% of those come from <1% of pixels, then it is considered to be noise-dominated and hence unusable.
| Quadrant | # 1 sec bins | Bins with >0 counts | Bins with >2000 counts | High rate bins dominated by noise | Noise dominated (total time) | Noise dominated (detector-on time) | Marked lightcurve |
|---|---|---|---|---|---|---|---|
| A | 7199 | 5227 | 0 | 0 | 0.00% | 0.00% | 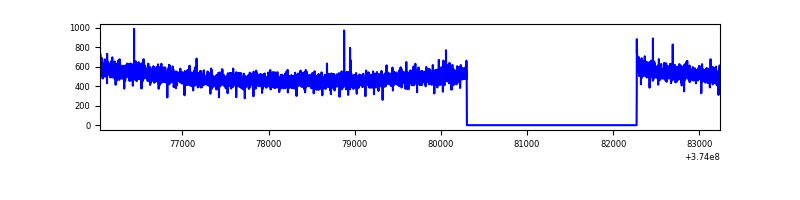 |
| B | 7199 | 5226 | 113 | 113 | 1.57% | 2.16% | 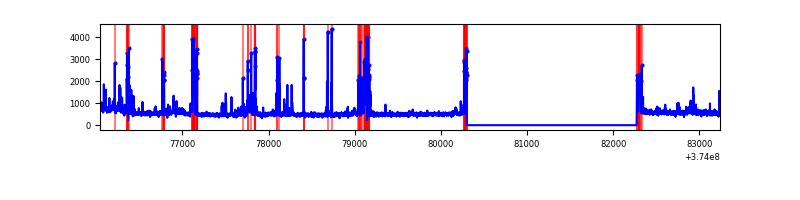 |
| C | 7199 | 5227 | 50 | 50 | 0.69% | 0.96% | 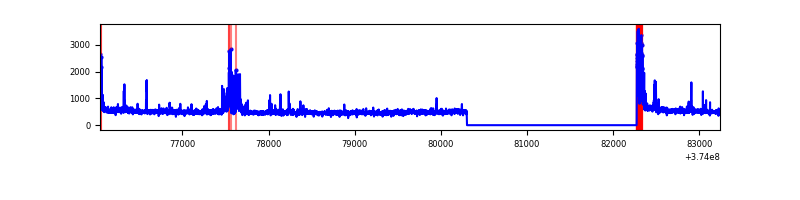 |
| D | 7199 | 5227 | 2496 | 2496 | 34.67% | 47.75% | 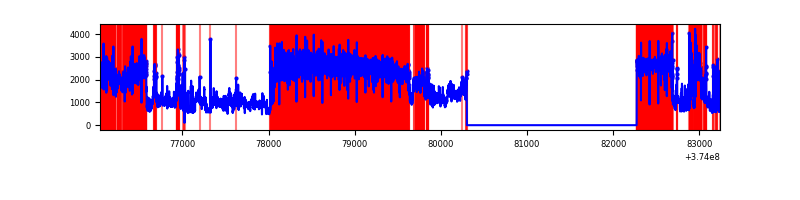 |
Top three noisy pixels from each quadrant. If the there are fewer than three noisy pixels in the level2.evt file, extra rows are filled as -1
| Pixel properties | Quadrant properties | ||||||
|---|---|---|---|---|---|---|---|
| Quadrant | DetID | PixID | Counts | Sigma | Mean | Median | Sigma |
| A | 13 | 6 | 12084 | 87.3 | 658 | 648 | 131.0 |
| A | 13 | 254 | 10421 | 74.6 | 658 | 648 | 131.0 |
| A | 0 | 226 | 5698 | 38.55 | 658 | 648 | 131.0 |
| B | 5 | 172 | 311196 | 2542.92 | 653 | 641 | 122.1 |
| B | 10 | 246 | 90549 | 736.2 | 653 | 641 | 122.1 |
| B | 0 | 190 | 53511 | 432.92 | 653 | 641 | 122.1 |
| C | 0 | 10 | 182272 | 1248.22 | 635 | 644 | 145.5 |
| C | 7 | 221 | 176636 | 1209.49 | 635 | 644 | 145.5 |
| C | 1 | 23 | 16189 | 106.83 | 635 | 644 | 145.5 |
| D | 7 | 223 | 6095292 | 45036.27 | 513 | 502 | 135.3 |
| D | 8 | 195 | 1064013 | 7858.61 | 513 | 502 | 135.3 |
| D | 2 | 249 | 165601 | 1219.97 | 513 | 502 | 135.3 |
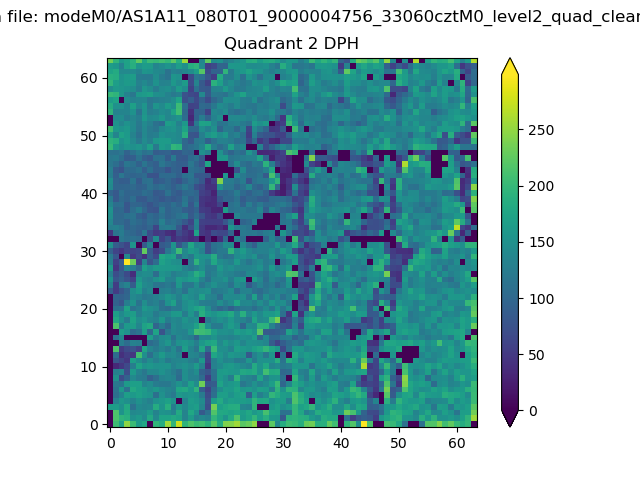
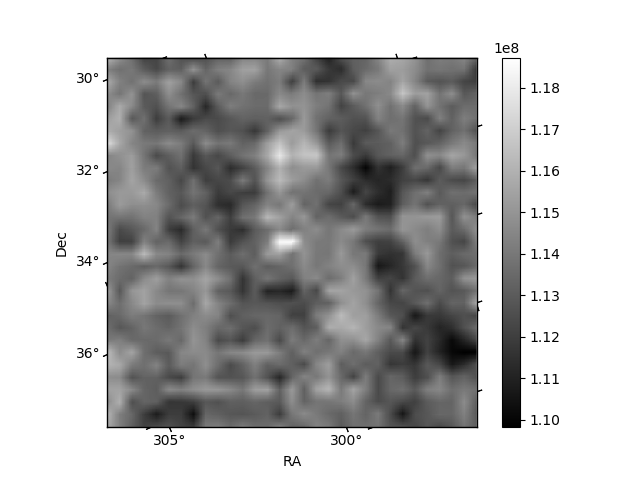
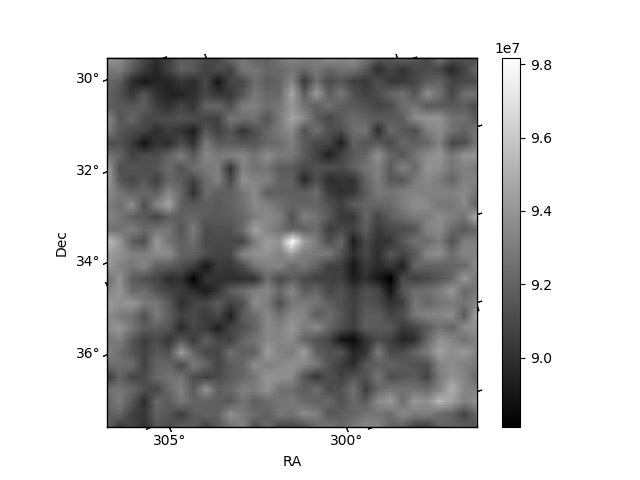
Histogram calculated using DETX and DETY for each event in the final _common_clean file
| Quadrant A | 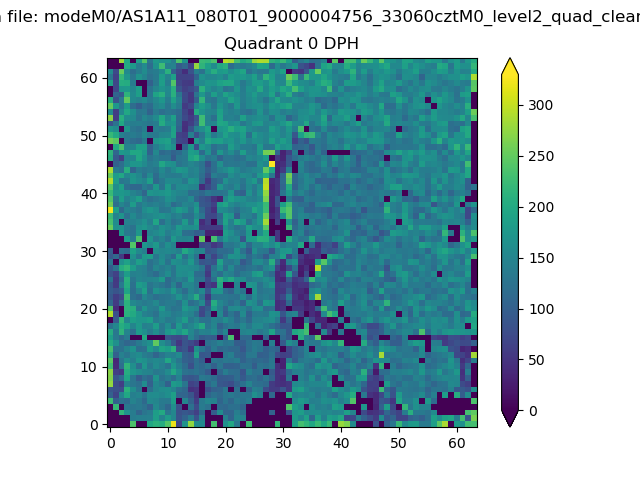 |
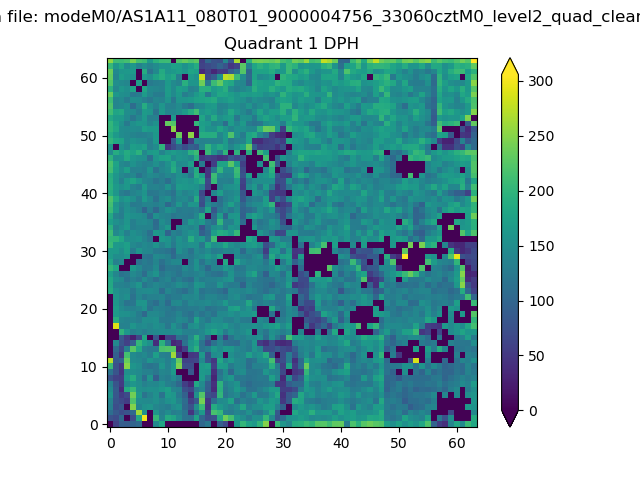 |
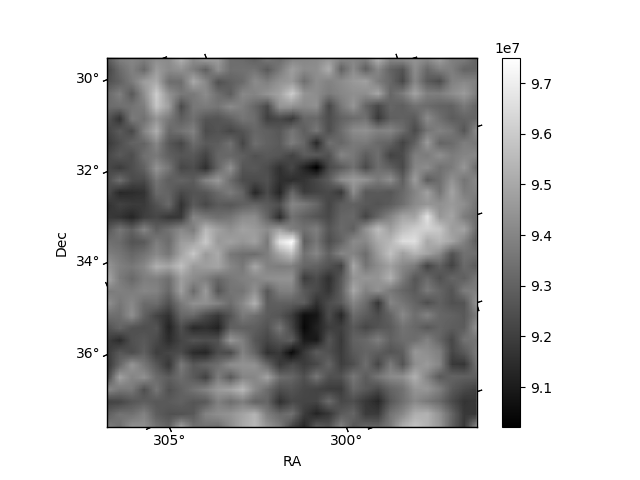
Quadrant B |
|---|---|---|---|
| Quadrant D | 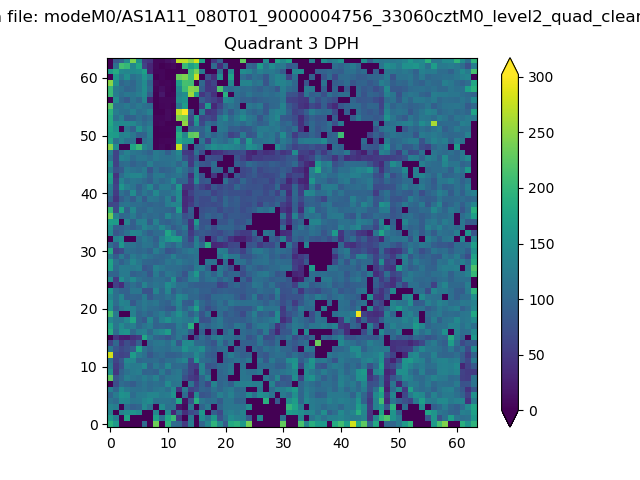 |
 |
Quadrant C |
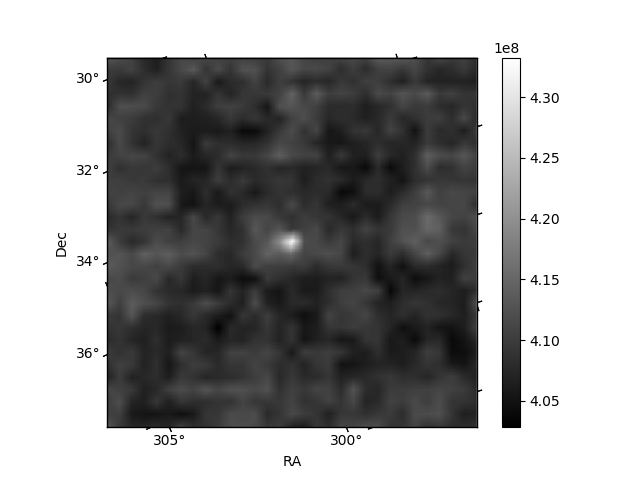
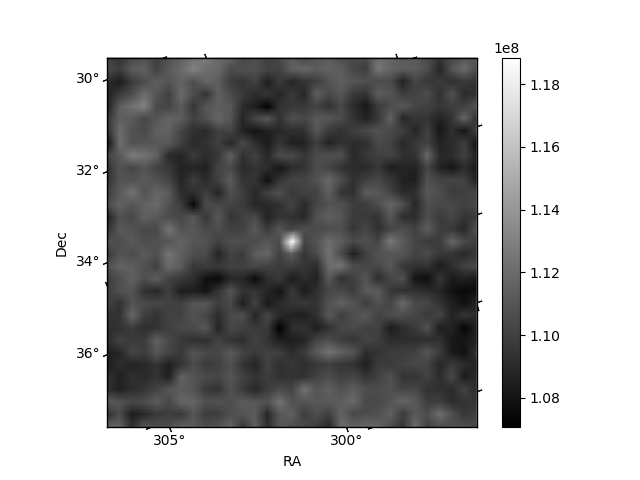
| Plot type | Count rate plots | Images |
|---|---|---|
| Comparison with Poisson distribution Blue bars denote a histogram of data divided into 1 sec bins. Red curve is a Poisson curve with rate = median count rate of data. |
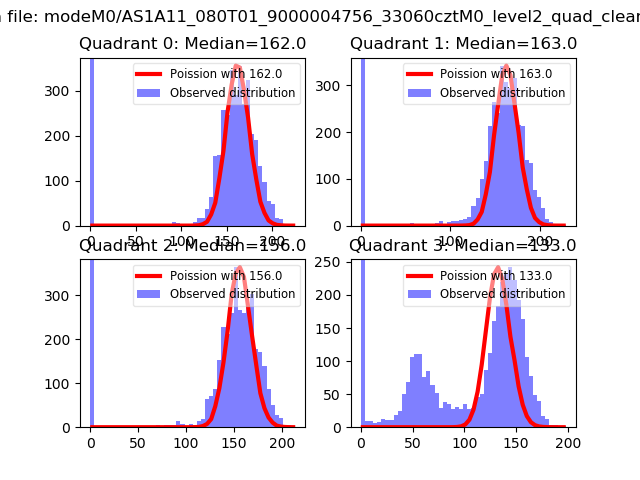 |
 |
| Quadrant-wise count rates Data is divided into 100 sec bins |
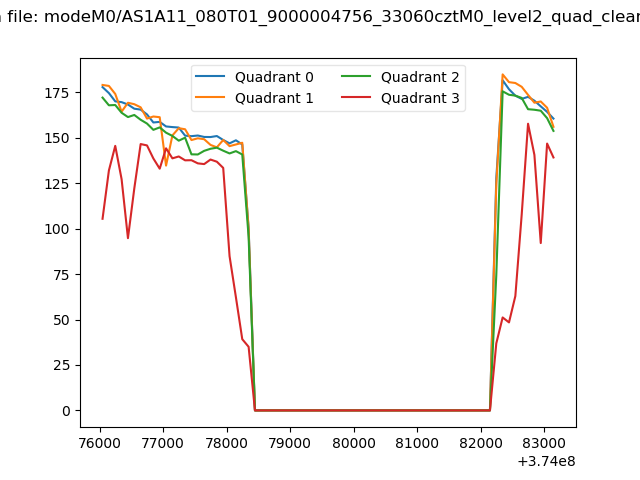 |
|
| Module-wise count rates for Quadrant A Data is divided into 100 sec bins |
 |
 |
| Module-wise count rates for Quadrant B Data is divided into 100 sec bins |
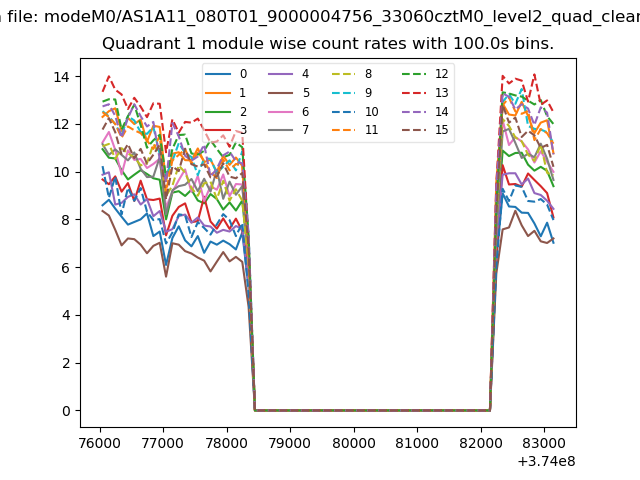 |
 |
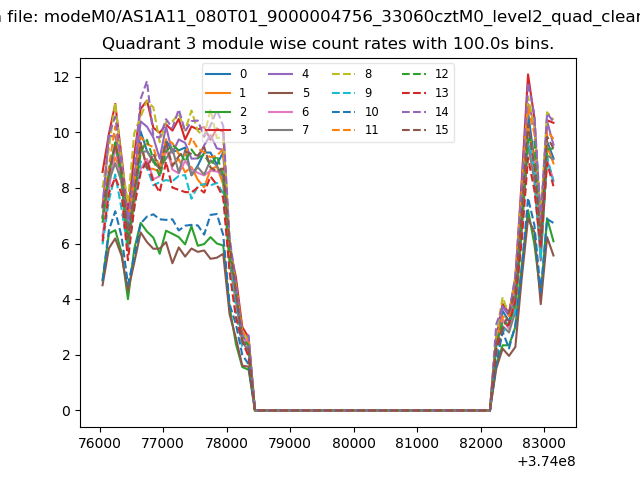
| Module-wise count rates for Quadrant C Data is divided into 100 sec bins |
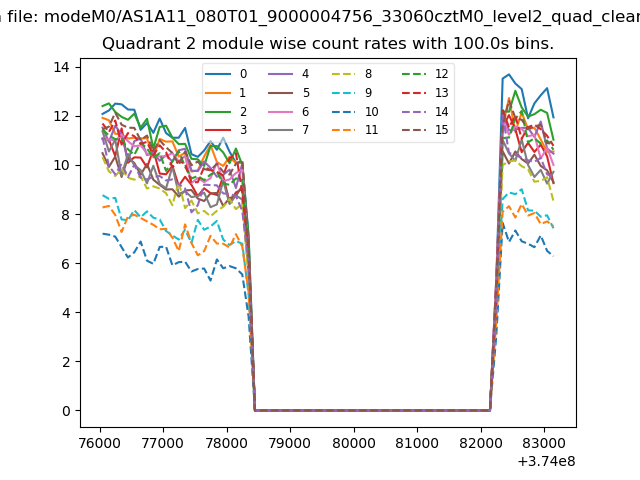 |
 |
| Module-wise count rates for Quadrant D Data is divided into 100 sec bins |
 |
 |
| Parameter | Plot |
|---|---|
| CZT HV Monitor | 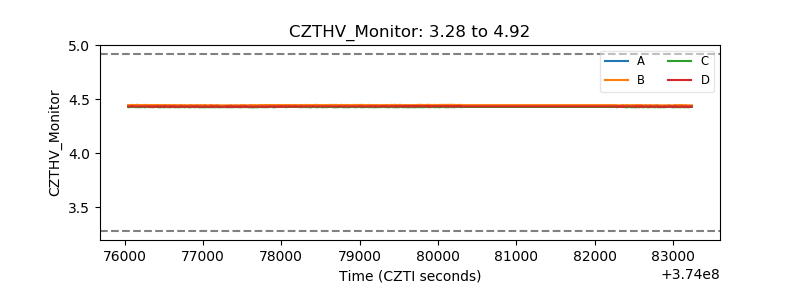 |
| D_VDD | 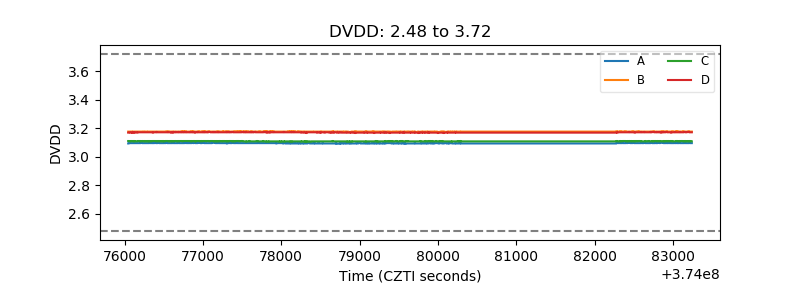 |
| Temperature 1 | 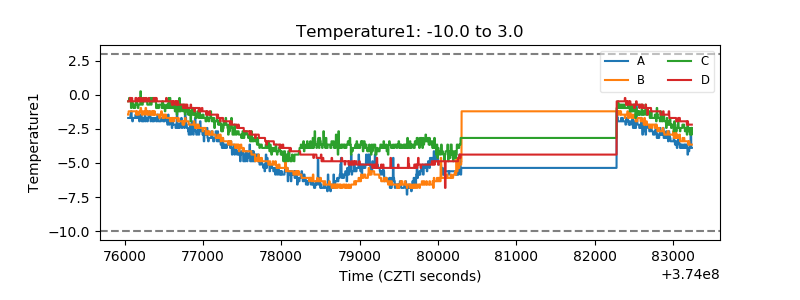 |
| Veto HV Monitor | 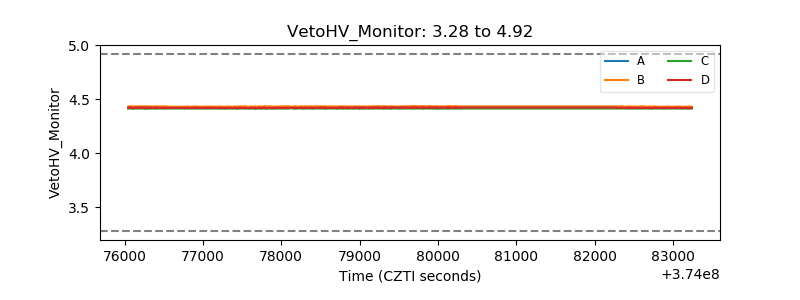 |
| Veto LLD | 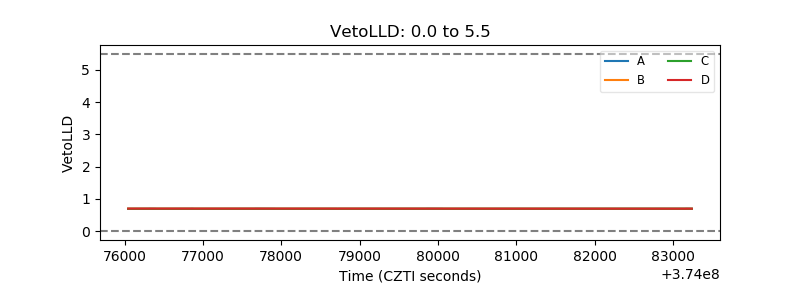 |
| Alpha Counter | 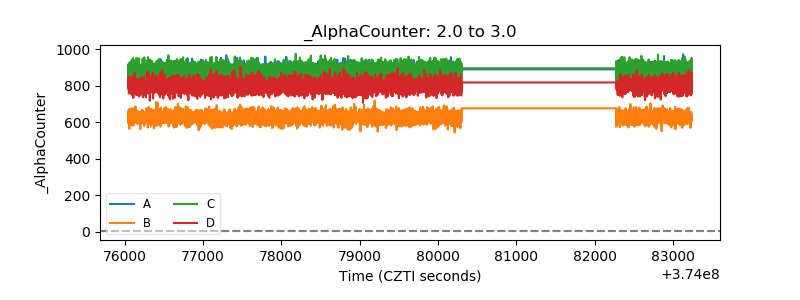 |
| _CPM_Rate | 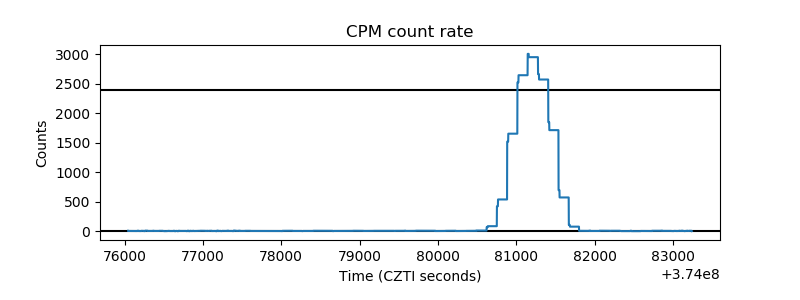 |
| CZT Counter | 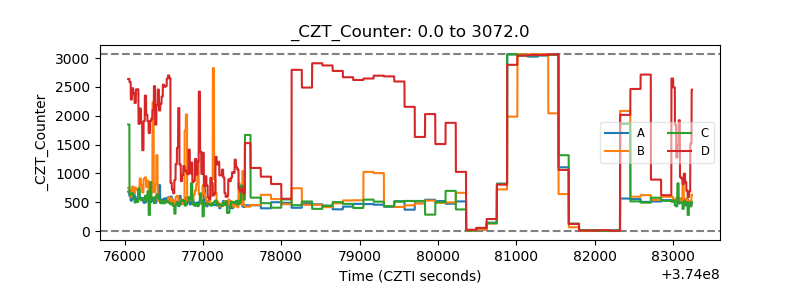 |
| +2.5 Volts monitor |  |
| +5 Volts monitor |  |
| _ROLL_ROT | 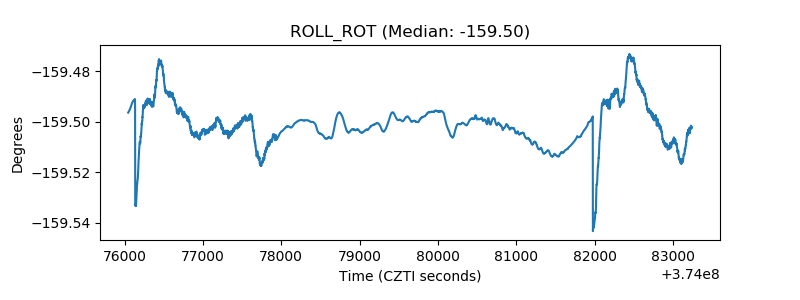 |
| _Roll_DEC |  |
| _Roll_RA | 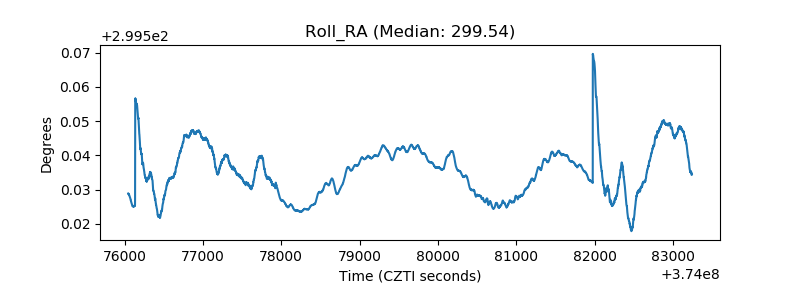 |
| Veto Counter |  |