| Param | Original file | Final file |
|---|---|---|
| Filename | modeM0/AS1A11_080T01_9000004756_33062cztM0_level2.evt | modeM0/AS1A11_080T01_9000004756_33062cztM0_level2_quad_clean.evt |
| Size (bytes) | 662,696,640 | 62,087,040 |
| Size | 632.0 MB | 59.2 MB |
| Events in quadrant A | 2,374,002 | 441,858 |
| Events in quadrant B | 2,946,588 | 445,404 |
| Events in quadrant C | 2,749,395 | 432,111 |
| Events in quadrant D | 11,669,385 | 217,095 |
| Mode SS | |||
|---|---|---|---|
| Quadrant | BADHDUFLAG | Total packets | Discarded packets |
| A | 0 | 100 | 0 |
| B | 0 | 100 | 0 |
| C | 0 | 100 | 0 |
| D | 0 | 100 | 0 |
| Mode M9 | |||
|---|---|---|---|
| Quadrant | BADHDUFLAG | Total packets | Discarded packets |
| A | 0 | 22 | 0 |
| B | 0 | 22 | 0 |
| C | 0 | 22 | 0 |
| D | 0 | 23 | 0 |
| Mode M0 | |||
|---|---|---|---|
| Quadrant | BADHDUFLAG | Total packets | Discarded packets |
| A | 0 | 9966 | 3 |
| B | 0 | 11843 | 2 |
| C | 0 | 10925 | 2 |
| D | 0 | 38025 | 2 |
| Quadrant | Total seconds | Saturated seconds | Saturation percentage |
|---|---|---|---|
| A | 4878 | 6 | 0.123001% |
| B | 4878 | 75 | 1.537515% |
| C | 4878 | 79 | 1.619516% |
| D | 4878 | 3992 | 81.836818% |
Noise dominated data is calculated using 1-second bins in cleaned event files. If a bin has >2000 counts, and if more than 50% of those come from <1% of pixels, then it is considered to be noise-dominated and hence unusable.
| Quadrant | # 1 sec bins | Bins with >0 counts | Bins with >2000 counts | High rate bins dominated by noise | Noise dominated (total time) | Noise dominated (detector-on time) | Marked lightcurve |
|---|---|---|---|---|---|---|---|
| A | 7002 | 4879 | 0 | 0 | 0.00% | 0.00% | 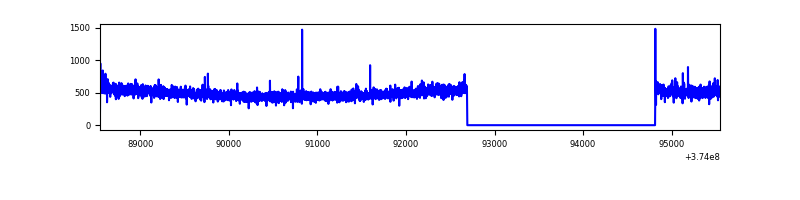 |
| B | 7002 | 4879 | 50 | 50 | 0.71% | 1.02% | 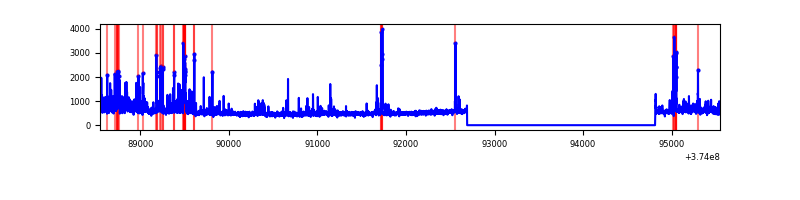 |
| C | 7002 | 4879 | 54 | 54 | 0.77% | 1.11% |  |
| D | 7002 | 4879 | 4044 | 4044 | 57.75% | 82.89% | 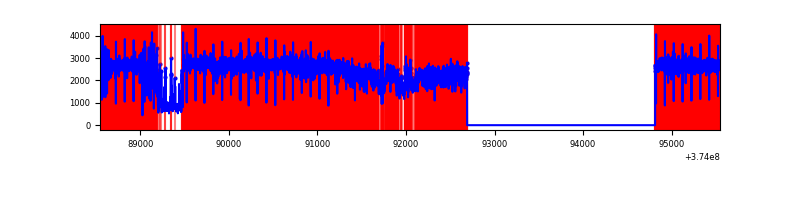 |
Top three noisy pixels from each quadrant. If the there are fewer than three noisy pixels in the level2.evt file, extra rows are filled as -1
| Pixel properties | Quadrant properties | ||||||
|---|---|---|---|---|---|---|---|
| Quadrant | DetID | PixID | Counts | Sigma | Mean | Median | Sigma |
| A | 12 | 227 | 10304 | 79.77 | 607 | 597 | 121.7 |
| A | 13 | 6 | 9831 | 75.88 | 607 | 597 | 121.7 |
| A | 13 | 254 | 8414 | 64.23 | 607 | 597 | 121.7 |
| B | 5 | 172 | 163139 | 1404.43 | 610 | 596 | 115.7 |
| B | 5 | 31 | 97740 | 839.36 | 610 | 596 | 115.7 |
| B | 0 | 189 | 75013 | 642.99 | 610 | 596 | 115.7 |
| C | 0 | 10 | 317302 | 2304.02 | 594 | 603 | 137.5 |
| C | 7 | 221 | 80707 | 582.77 | 594 | 603 | 137.5 |
| C | 14 | 67 | 8163 | 55.0 | 594 | 603 | 137.5 |
| D | 7 | 223 | 8538585 | 84406.54 | 382 | 375 | 101.2 |
| D | 8 | 195 | 1048389 | 10360.39 | 382 | 375 | 101.2 |
| D | 2 | 249 | 383832 | 3790.75 | 382 | 375 | 101.2 |
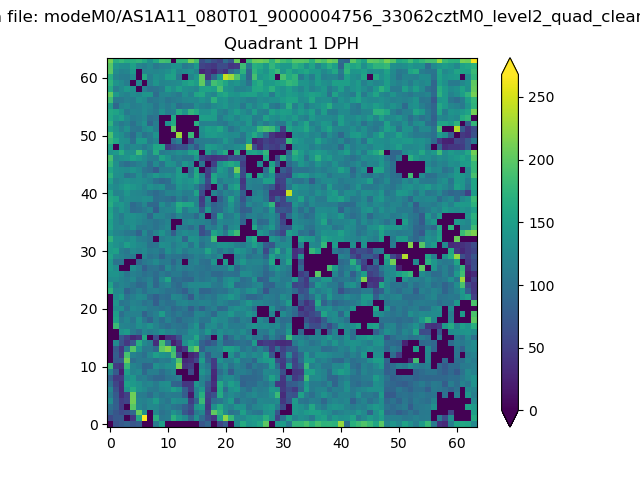
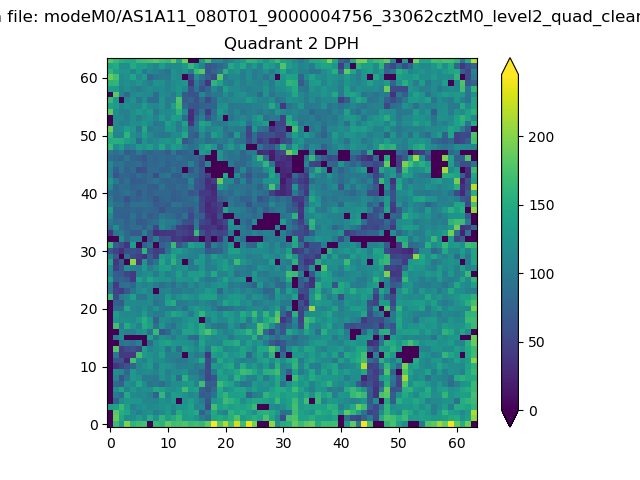
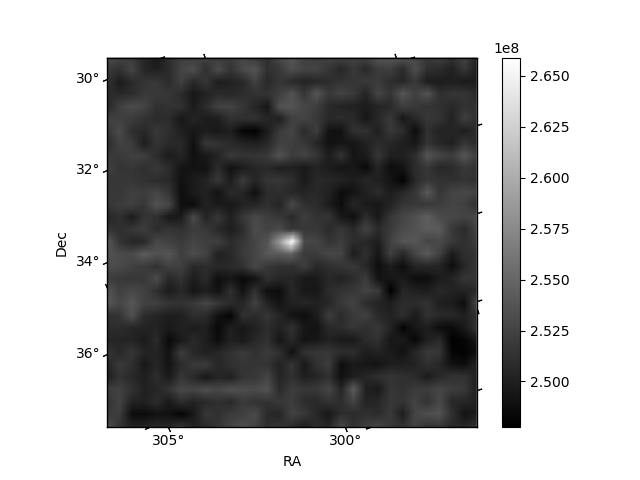
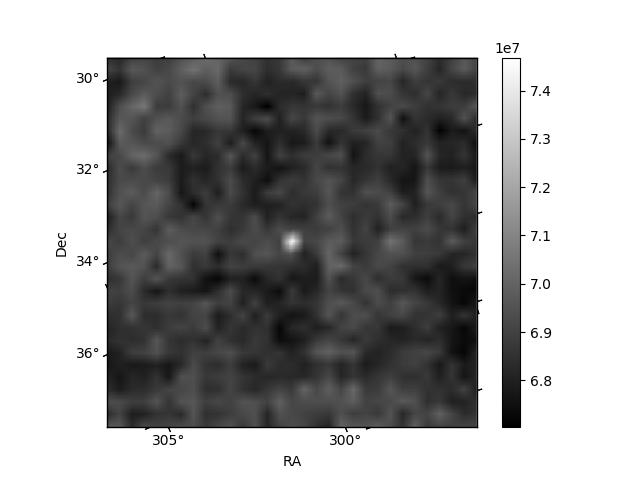
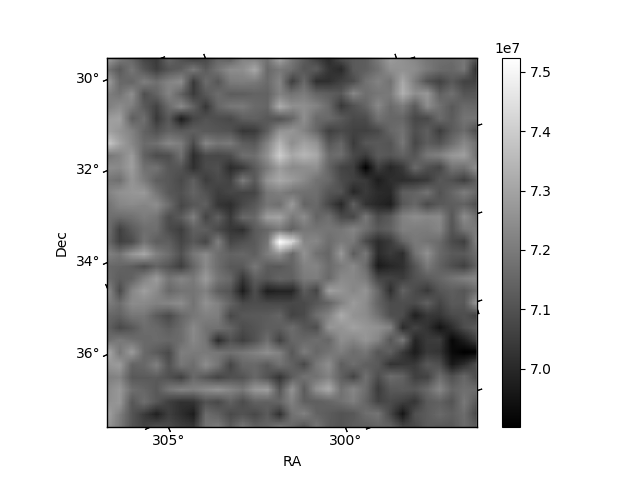
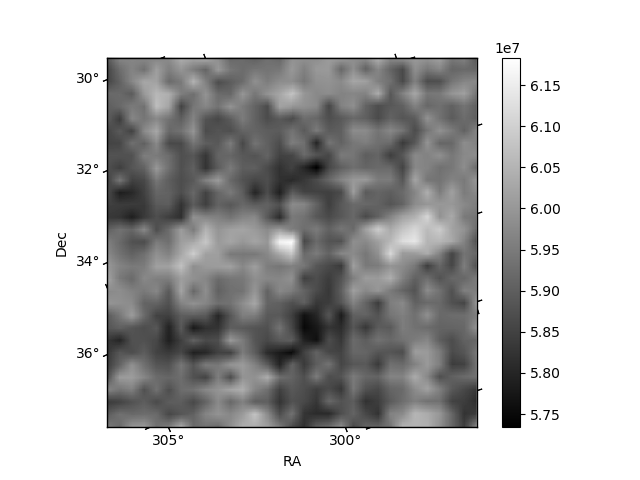
Histogram calculated using DETX and DETY for each event in the final _common_clean file
| Quadrant A | 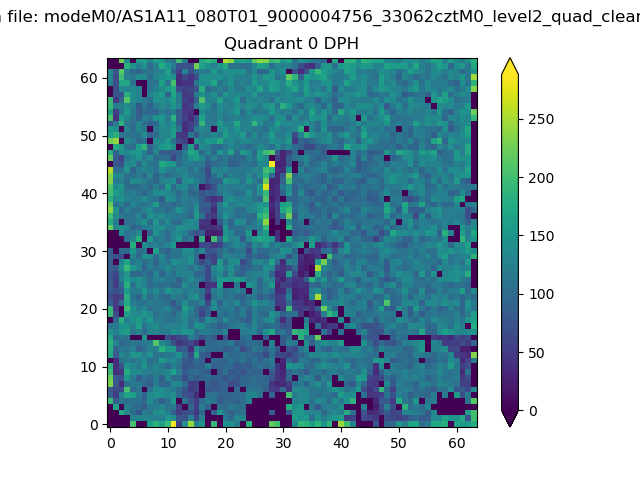 |
 |
Quadrant B |
|---|---|---|---|
| Quadrant D | 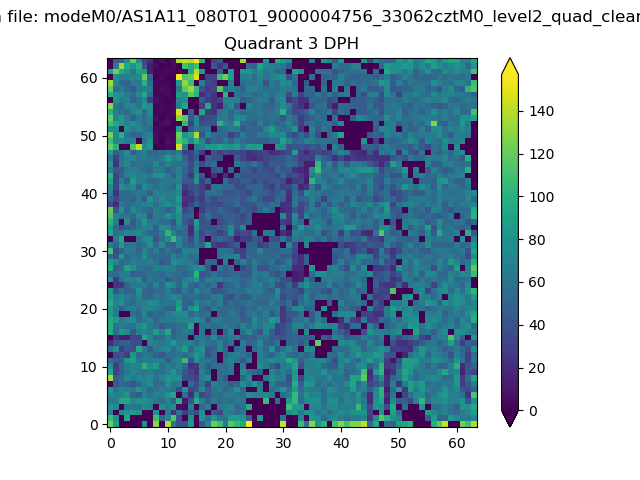 |
 |
Quadrant C |
| Plot type | Count rate plots | Images |
|---|---|---|
| Comparison with Poisson distribution Blue bars denote a histogram of data divided into 1 sec bins. Red curve is a Poisson curve with rate = median count rate of data. |
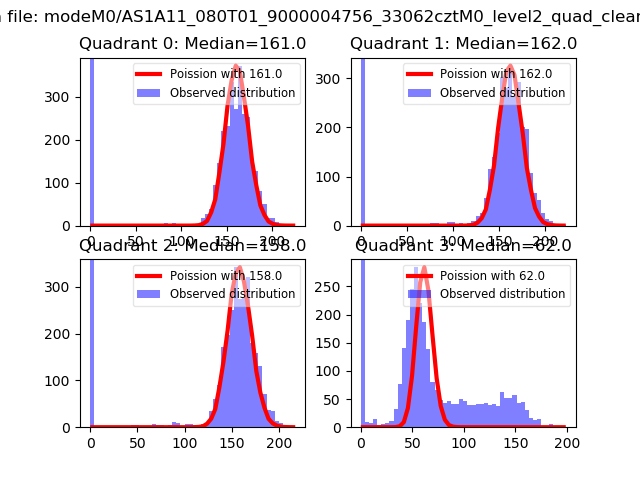 |
 |
| Quadrant-wise count rates Data is divided into 100 sec bins |
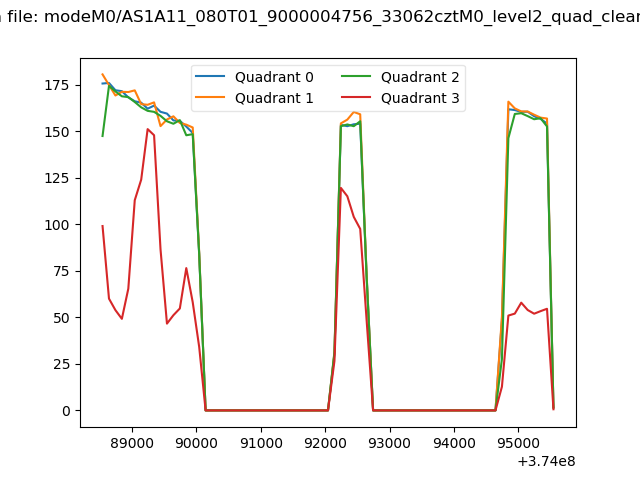 |
|
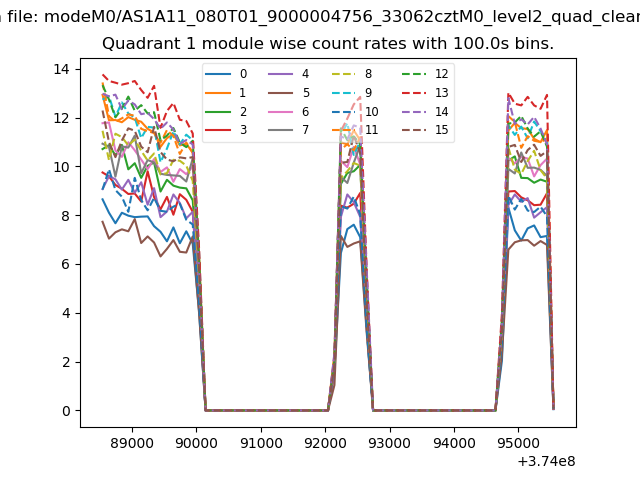
| Module-wise count rates for Quadrant A Data is divided into 100 sec bins |
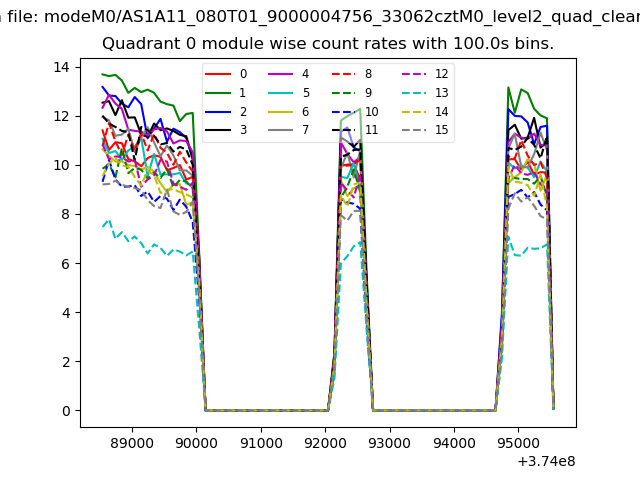 |
 |
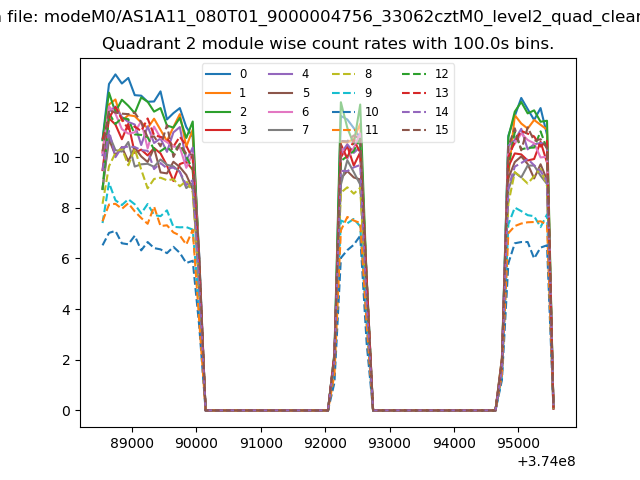
| Module-wise count rates for Quadrant B Data is divided into 100 sec bins |
 |
 |
| Module-wise count rates for Quadrant C Data is divided into 100 sec bins |
 |
 |
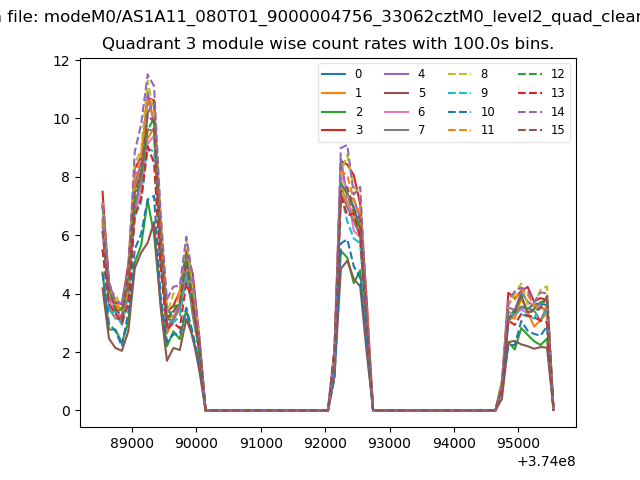
| Module-wise count rates for Quadrant D Data is divided into 100 sec bins |
 |
 |
| Parameter | Plot |
|---|---|
| CZT HV Monitor | 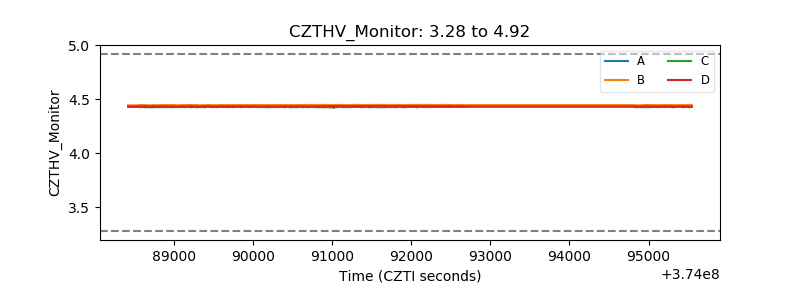 |
| D_VDD | 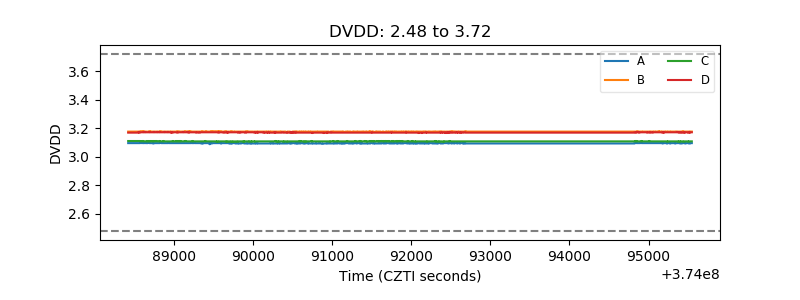 |
| Temperature 1 | 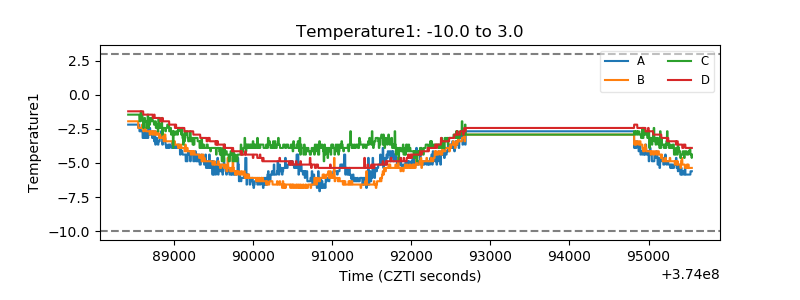 |
| Veto HV Monitor |  |
| Veto LLD | 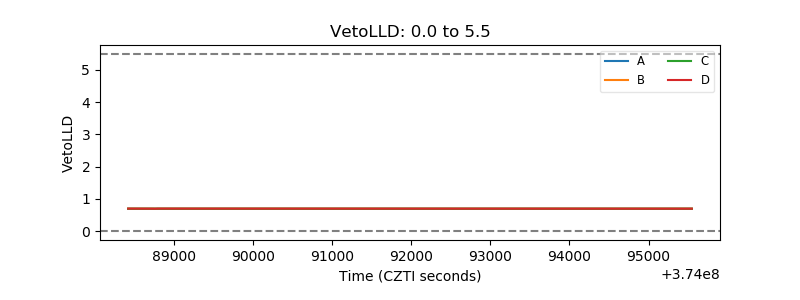 |
| Alpha Counter | 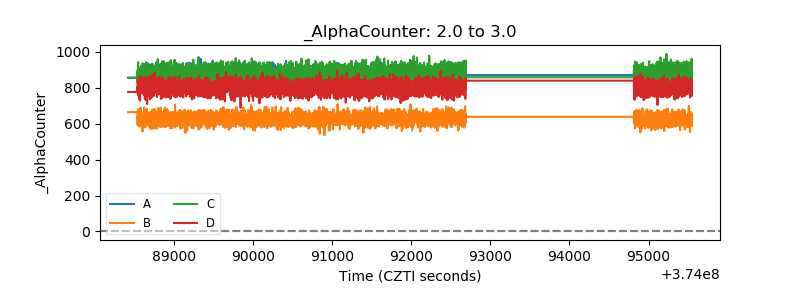 |
| _CPM_Rate | 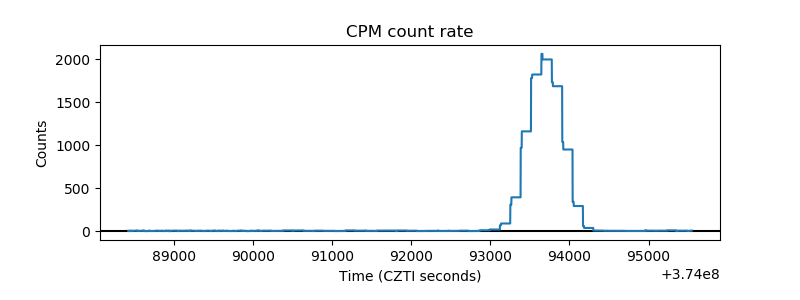 |
| CZT Counter | 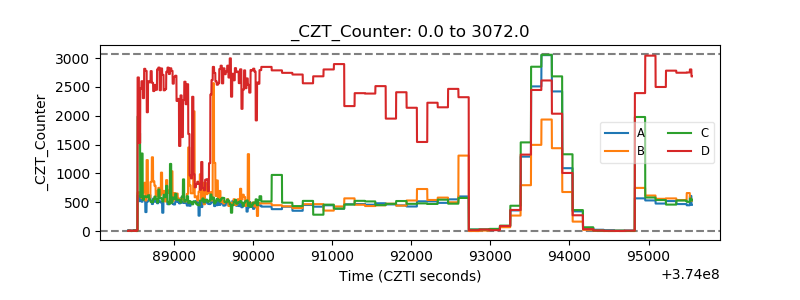 |
| +2.5 Volts monitor |  |
| +5 Volts monitor | 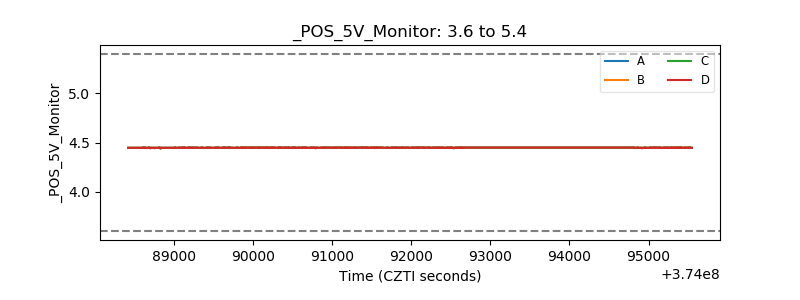 |
| _ROLL_ROT | 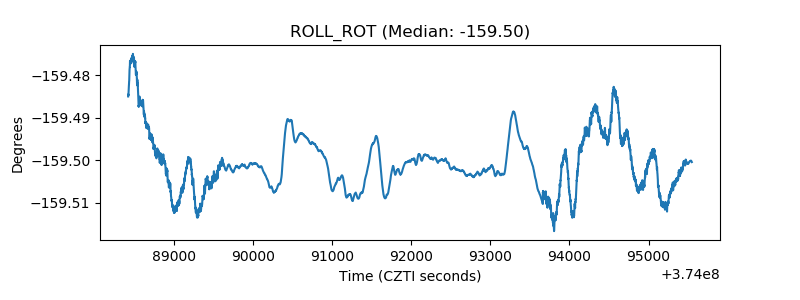 |
| _Roll_DEC | 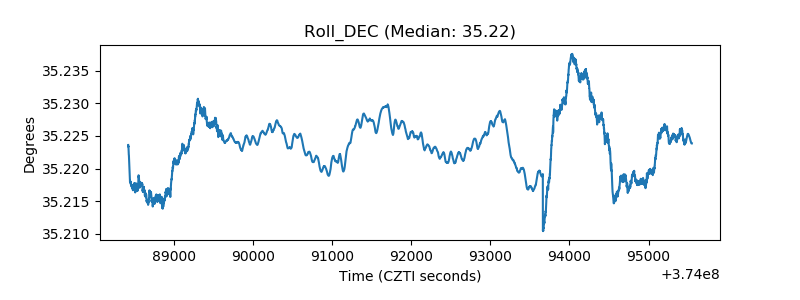 |
| _Roll_RA | 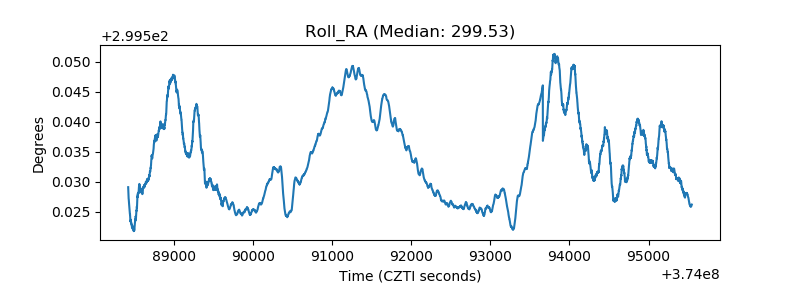 |
| Veto Counter | 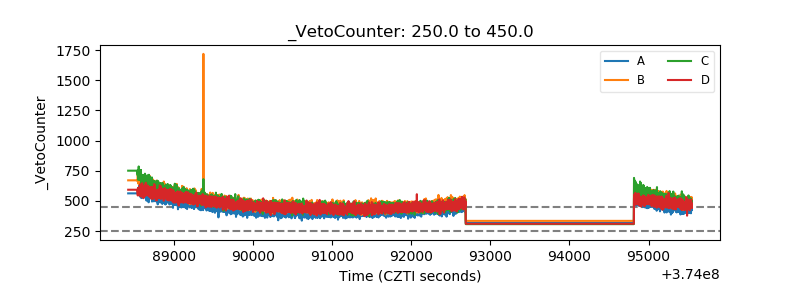 |