| Param | Original file | Final file |
|---|---|---|
| Filename | modeM0/AS1A11_080T01_9000004756_33063cztM0_level2.evt | modeM0/AS1A11_080T01_9000004756_33063cztM0_level2_quad_clean.evt |
| Size (bytes) | 693,118,080 | 57,948,480 |
| Size | 661.0 MB | 55.3 MB |
| Events in quadrant A | 2,336,170 | 422,528 |
| Events in quadrant B | 2,919,666 | 417,457 |
| Events in quadrant C | 2,808,852 | 411,625 |
| Events in quadrant D | 12,592,828 | 156,194 |
| Mode SS | |||
|---|---|---|---|
| Quadrant | BADHDUFLAG | Total packets | Discarded packets |
| A | 0 | 102 | 0 |
| B | 0 | 102 | 0 |
| C | 0 | 102 | 0 |
| D | 0 | 102 | 0 |
| Mode M9 | |||
|---|---|---|---|
| Quadrant | BADHDUFLAG | Total packets | Discarded packets |
| A | 0 | 32 | 0 |
| B | 0 | 32 | 0 |
| C | 0 | 32 | 0 |
| D | 0 | 33 | 0 |
| Mode M0 | |||
|---|---|---|---|
| Quadrant | BADHDUFLAG | Total packets | Discarded packets |
| A | 0 | 9982 | 3 |
| B | 0 | 11746 | 2 |
| C | 0 | 11263 | 2 |
| D | 0 | 40755 | 2 |
| Quadrant | Total seconds | Saturated seconds | Saturation percentage |
|---|---|---|---|
| A | 4917 | 5 | 0.101688% |
| B | 4917 | 149 | 3.030303% |
| C | 4917 | 105 | 2.135448% |
| D | 4917 | 4823 | 98.088265% |
Noise dominated data is calculated using 1-second bins in cleaned event files. If a bin has >2000 counts, and if more than 50% of those come from <1% of pixels, then it is considered to be noise-dominated and hence unusable.
| Quadrant | # 1 sec bins | Bins with >0 counts | Bins with >2000 counts | High rate bins dominated by noise | Noise dominated (total time) | Noise dominated (detector-on time) | Marked lightcurve |
|---|---|---|---|---|---|---|---|
| A | 7011 | 4918 | 0 | 0 | 0.00% | 0.00% | 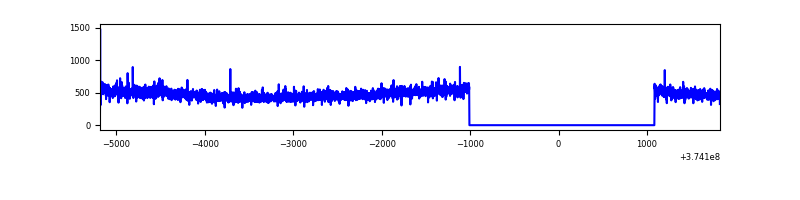 |
| B | 7011 | 4918 | 101 | 101 | 1.44% | 2.05% | 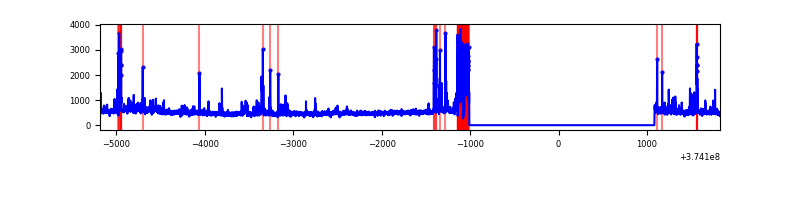 |
| C | 7011 | 4918 | 73 | 73 | 1.04% | 1.48% | 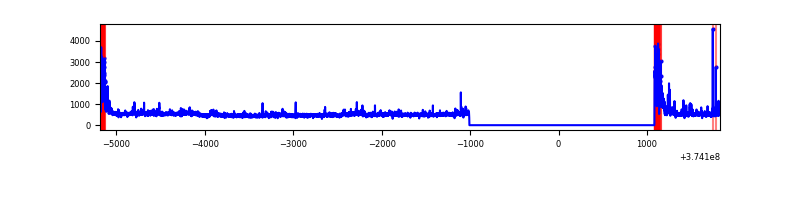 |
| D | 7011 | 4918 | 4719 | 4719 | 67.31% | 95.95% | 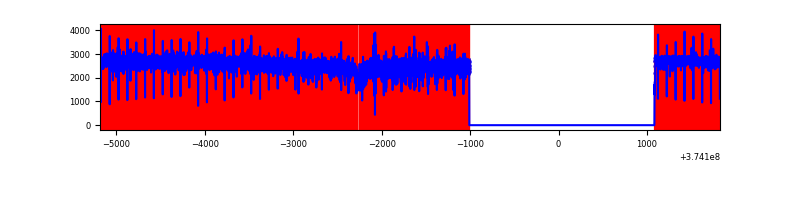 |
Top three noisy pixels from each quadrant. If the there are fewer than three noisy pixels in the level2.evt file, extra rows are filled as -1
| Pixel properties | Quadrant properties | ||||||
|---|---|---|---|---|---|---|---|
| Quadrant | DetID | PixID | Counts | Sigma | Mean | Median | Sigma |
| A | 13 | 254 | 9330 | 73.14 | 596 | 586 | 119.5 |
| A | 12 | 227 | 8225 | 63.9 | 596 | 586 | 119.5 |
| A | 14 | 239 | 7469 | 57.58 | 596 | 586 | 119.5 |
| B | 5 | 172 | 316146 | 2810.22 | 592 | 577 | 112.3 |
| B | 0 | 229 | 54095 | 476.59 | 592 | 577 | 112.3 |
| B | 0 | 197 | 53307 | 469.57 | 592 | 577 | 112.3 |
| C | 0 | 10 | 391320 | 2887.89 | 581 | 589 | 135.3 |
| C | 7 | 221 | 92349 | 678.2 | 581 | 589 | 135.3 |
| C | 1 | 23 | 22941 | 165.2 | 581 | 589 | 135.3 |
| D | 7 | 223 | 10009219 | 111849.23 | 334 | 328 | 89.5 |
| D | 8 | 195 | 676991 | 7561.7 | 334 | 328 | 89.5 |
| D | 12 | 218 | 222309 | 2480.63 | 334 | 328 | 89.5 |
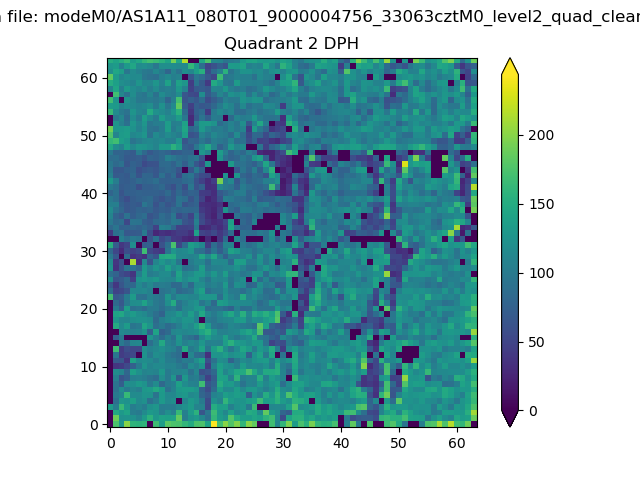
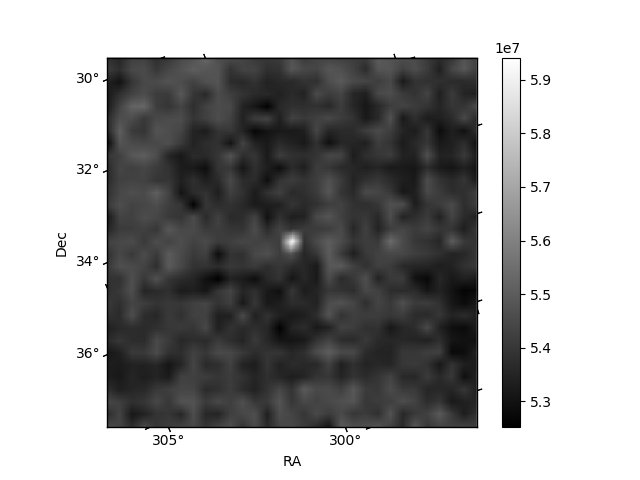
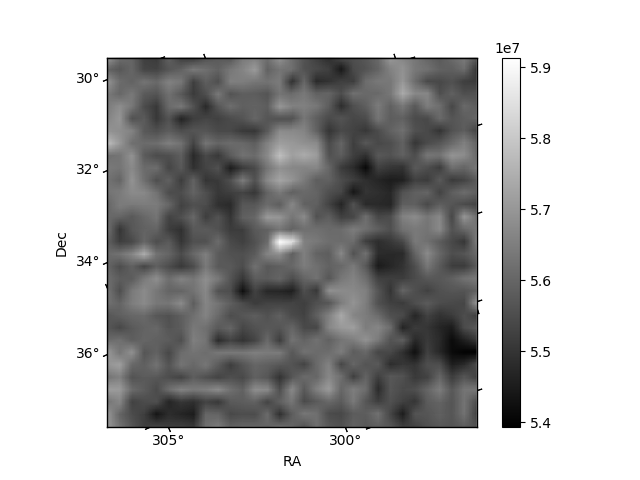
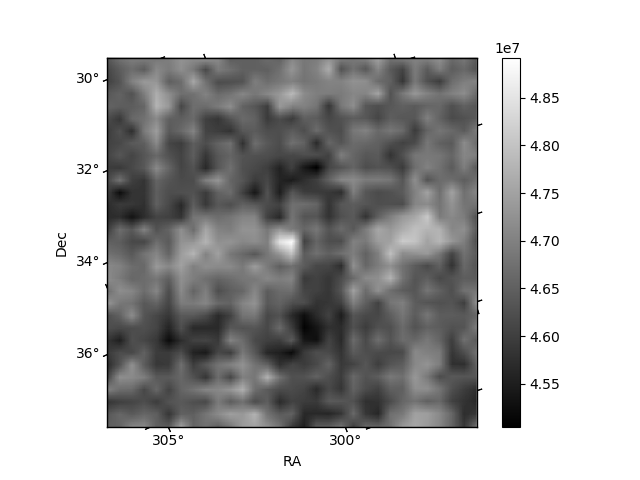
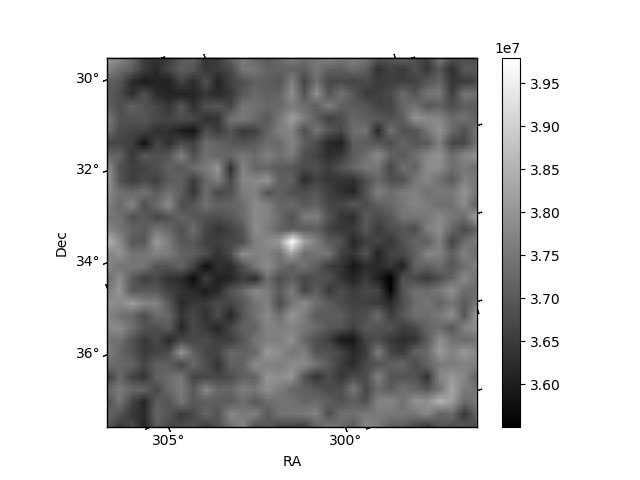
Histogram calculated using DETX and DETY for each event in the final _common_clean file
| Quadrant A | 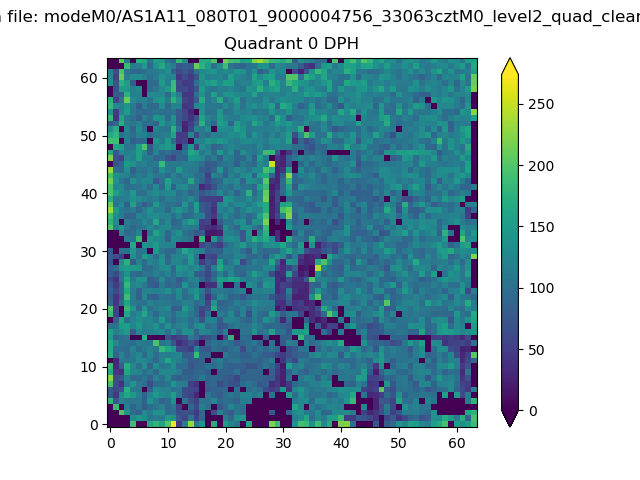 |
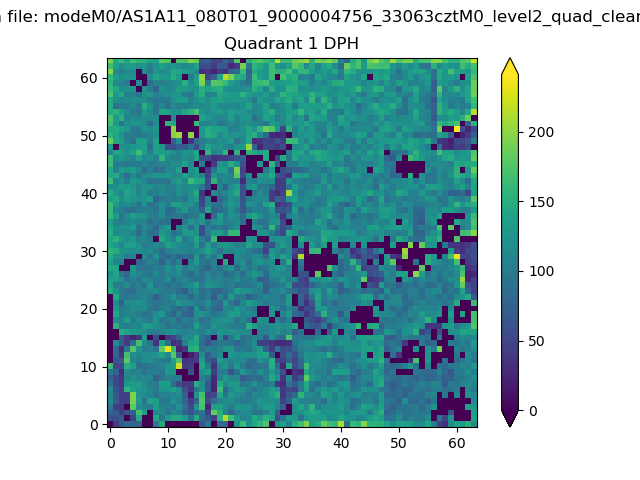 |
Quadrant B |
|---|---|---|---|
| Quadrant D | 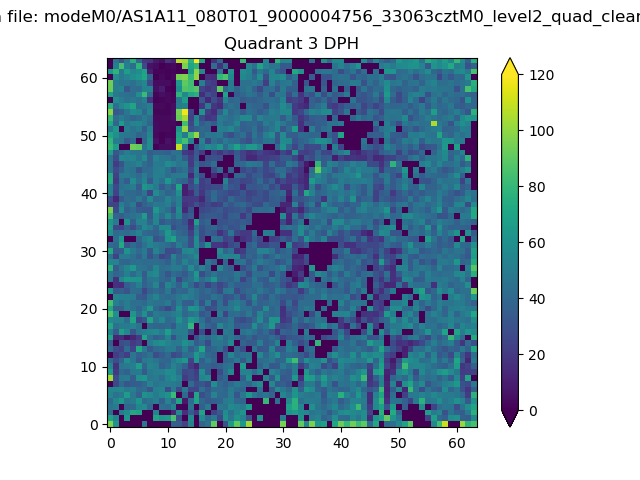 |
 |
Quadrant C |
| Plot type | Count rate plots | Images |
|---|---|---|
| Comparison with Poisson distribution Blue bars denote a histogram of data divided into 1 sec bins. Red curve is a Poisson curve with rate = median count rate of data. |
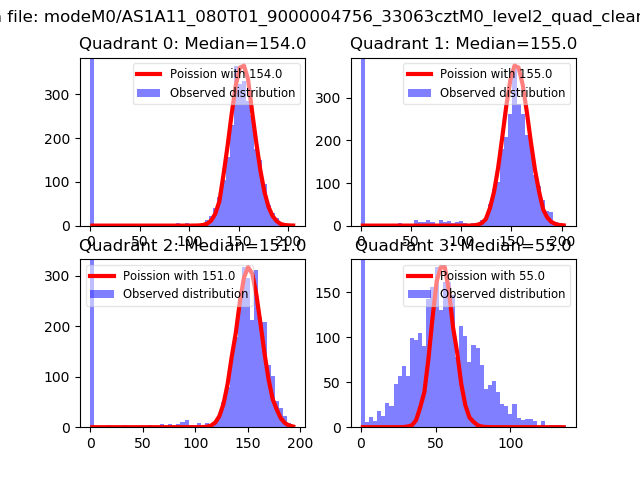 |
 |
| Quadrant-wise count rates Data is divided into 100 sec bins |
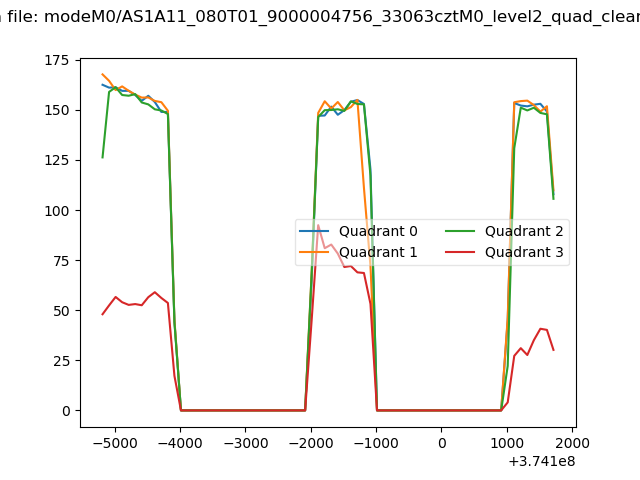 |
|
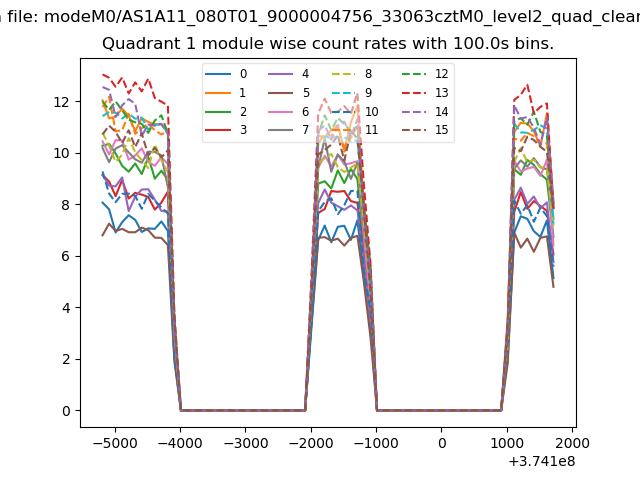
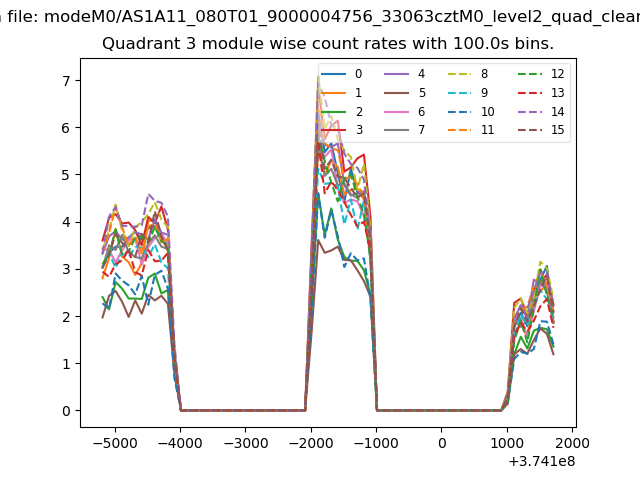
| Module-wise count rates for Quadrant A Data is divided into 100 sec bins |
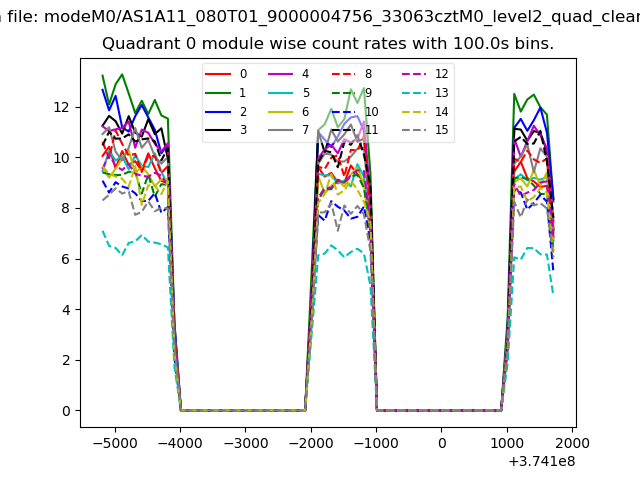 |
 |
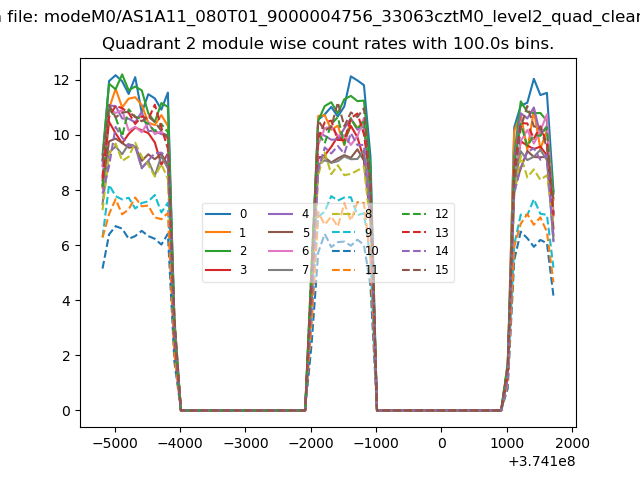
| Module-wise count rates for Quadrant B Data is divided into 100 sec bins |
 |
 |
| Module-wise count rates for Quadrant C Data is divided into 100 sec bins |
 |
 |
| Module-wise count rates for Quadrant D Data is divided into 100 sec bins |
 |
 |
| Parameter | Plot |
|---|---|
| CZT HV Monitor | 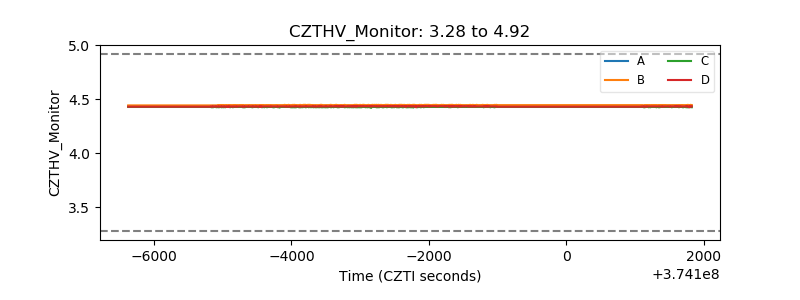 |
| D_VDD |  |
| Temperature 1 | 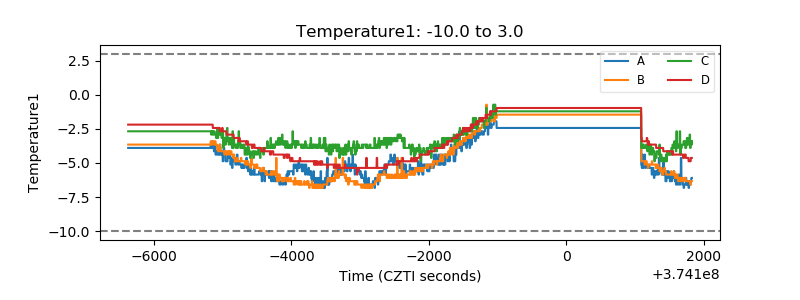 |
| Veto HV Monitor | 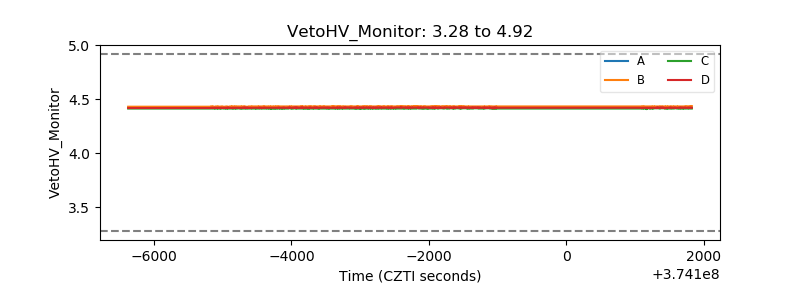 |
| Veto LLD |  |
| Alpha Counter | 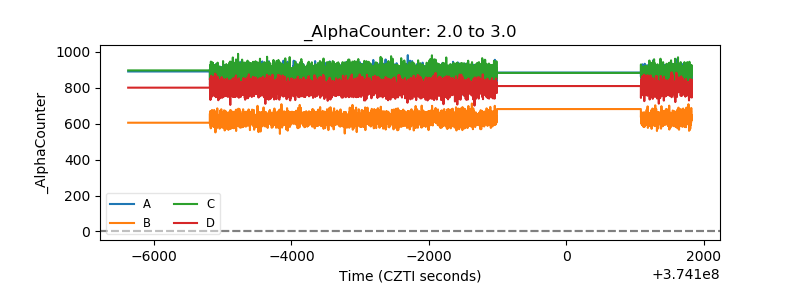 |
| _CPM_Rate | 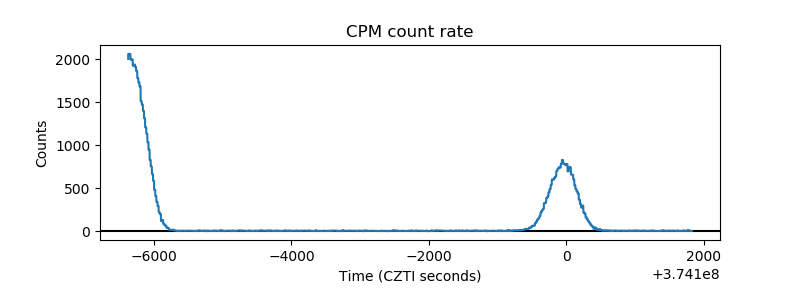 |
| CZT Counter | 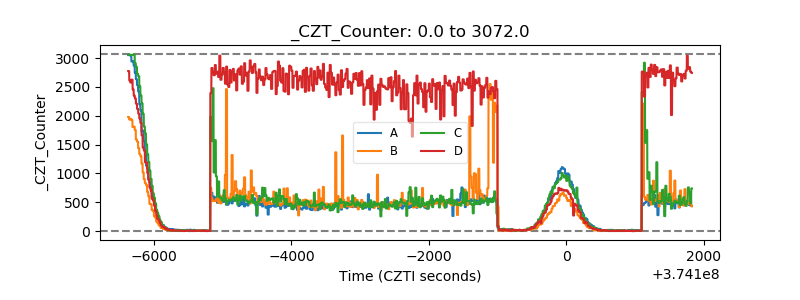 |
| +2.5 Volts monitor |  |
| +5 Volts monitor |  |
| _ROLL_ROT | 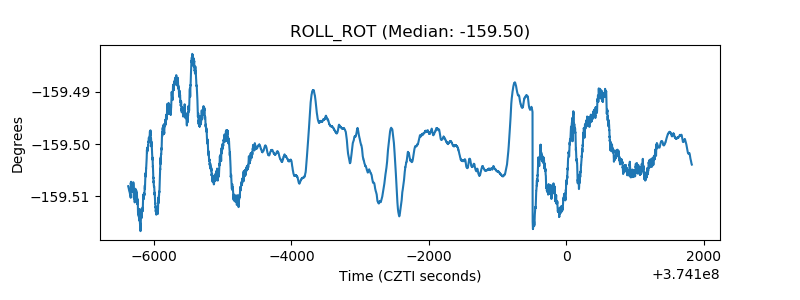 |
| _Roll_DEC | 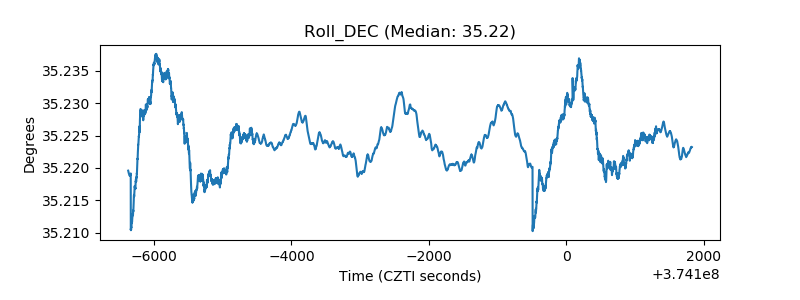 |
| _Roll_RA | 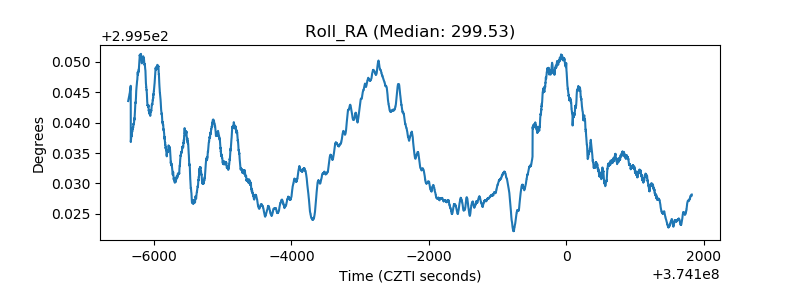 |
| Veto Counter | 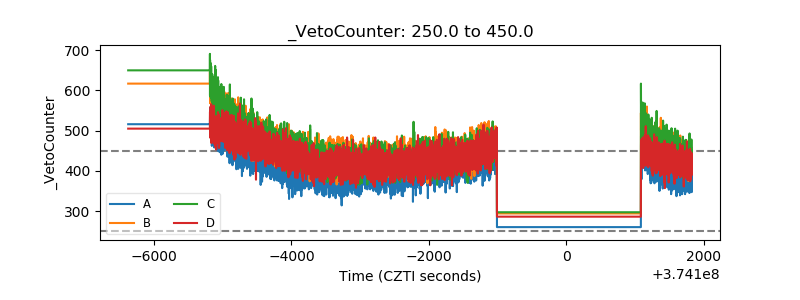 |