| Param | Original file | Final file |
|---|---|---|
| Filename | modeM0/AS1A11_080T01_9000004756_33064cztM0_level2.evt | modeM0/AS1A11_080T01_9000004756_33064cztM0_level2_quad_clean.evt |
| Size (bytes) | 703,532,160 | 53,092,800 |
| Size | 670.9 MB | 50.6 MB |
| Events in quadrant A | 2,350,259 | 370,783 |
| Events in quadrant B | 3,273,361 | 355,432 |
| Events in quadrant C | 2,783,584 | 361,340 |
| Events in quadrant D | 12,554,287 | 161,696 |
| Mode SS | |||
|---|---|---|---|
| Quadrant | BADHDUFLAG | Total packets | Discarded packets |
| A | 0 | 104 | 0 |
| B | 0 | 104 | 0 |
| C | 0 | 104 | 0 |
| D | 0 | 104 | 0 |
| Mode M9 | |||
|---|---|---|---|
| Quadrant | BADHDUFLAG | Total packets | Discarded packets |
| A | 0 | 27 | 0 |
| B | 0 | 27 | 0 |
| C | 0 | 27 | 0 |
| D | 0 | 28 | 0 |
| Mode M0 | |||
|---|---|---|---|
| Quadrant | BADHDUFLAG | Total packets | Discarded packets |
| A | 0 | 10270 | 3 |
| B | 0 | 12971 | 2 |
| C | 0 | 11576 | 2 |
| D | 0 | 40782 | 2 |
| Quadrant | Total seconds | Saturated seconds | Saturation percentage |
|---|---|---|---|
| A | 5090 | 5 | 0.098232% |
| B | 5090 | 311 | 6.110020% |
| C | 5090 | 106 | 2.082515% |
| D | 5090 | 4563 | 89.646365% |
Noise dominated data is calculated using 1-second bins in cleaned event files. If a bin has >2000 counts, and if more than 50% of those come from <1% of pixels, then it is considered to be noise-dominated and hence unusable.
| Quadrant | # 1 sec bins | Bins with >0 counts | Bins with >2000 counts | High rate bins dominated by noise | Noise dominated (total time) | Noise dominated (detector-on time) | Marked lightcurve |
|---|---|---|---|---|---|---|---|
| A | 7002 | 5091 | 0 | 0 | 0.00% | 0.00% | 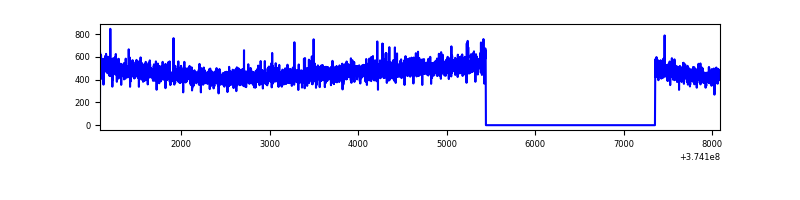 |
| B | 7002 | 5091 | 218 | 218 | 3.11% | 4.28% | 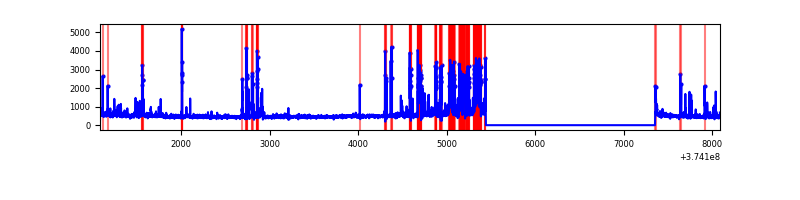 |
| C | 7002 | 5091 | 79 | 79 | 1.13% | 1.55% | 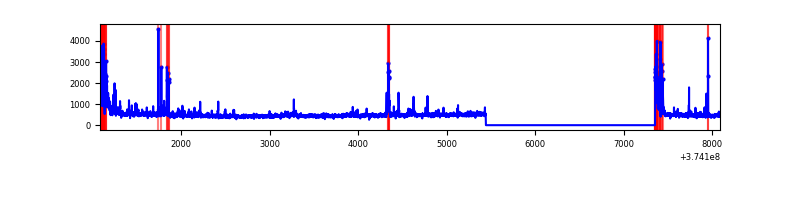 |
| D | 7002 | 5091 | 4654 | 4654 | 66.47% | 91.42% | 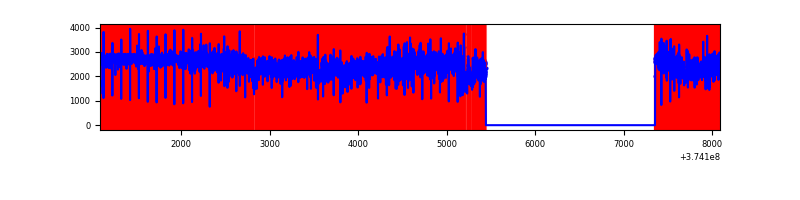 |
Top three noisy pixels from each quadrant. If the there are fewer than three noisy pixels in the level2.evt file, extra rows are filled as -1
| Pixel properties | Quadrant properties | ||||||
|---|---|---|---|---|---|---|---|
| Quadrant | DetID | PixID | Counts | Sigma | Mean | Median | Sigma |
| A | 13 | 254 | 9647 | 74.55 | 601 | 590 | 121.5 |
| A | 0 | 159 | 8710 | 66.84 | 601 | 590 | 121.5 |
| A | 13 | 6 | 6633 | 49.74 | 601 | 590 | 121.5 |
| B | 5 | 172 | 684928 | 6044.29 | 589 | 576 | 113.2 |
| B | 5 | 200 | 67619 | 592.13 | 589 | 576 | 113.2 |
| B | 0 | 189 | 52450 | 458.16 | 589 | 576 | 113.2 |
| C | 0 | 10 | 297044 | 2192.6 | 583 | 590 | 135.2 |
| C | 7 | 221 | 105647 | 777.01 | 583 | 590 | 135.2 |
| C | 1 | 23 | 90268 | 663.27 | 583 | 590 | 135.2 |
| D | 7 | 223 | 9115998 | 90016.57 | 380 | 372 | 101.3 |
| D | 8 | 195 | 1174365 | 11593.15 | 380 | 372 | 101.3 |
| D | 12 | 218 | 282678 | 2787.76 | 380 | 372 | 101.3 |
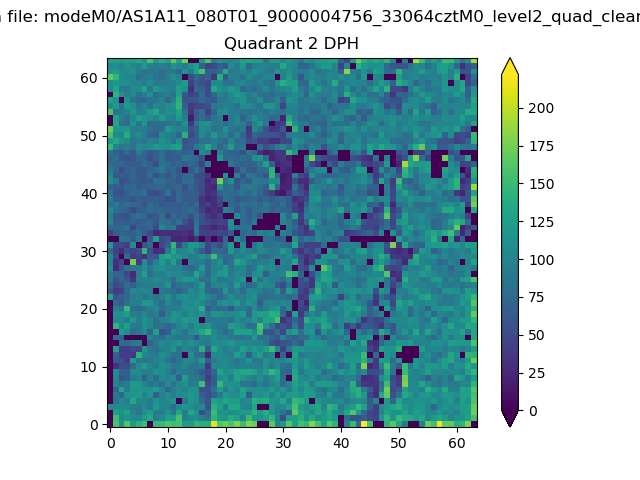
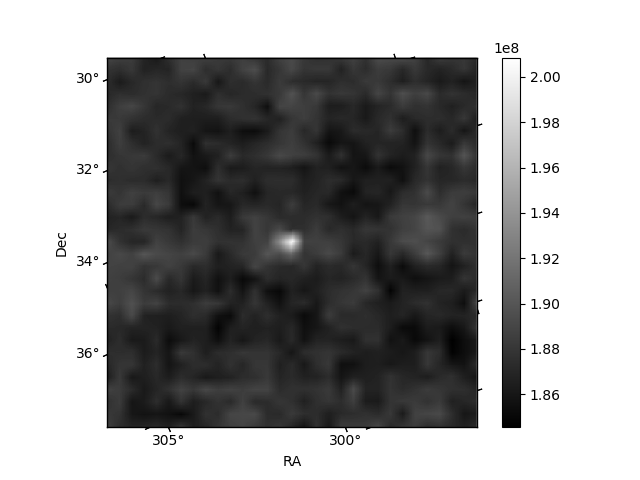
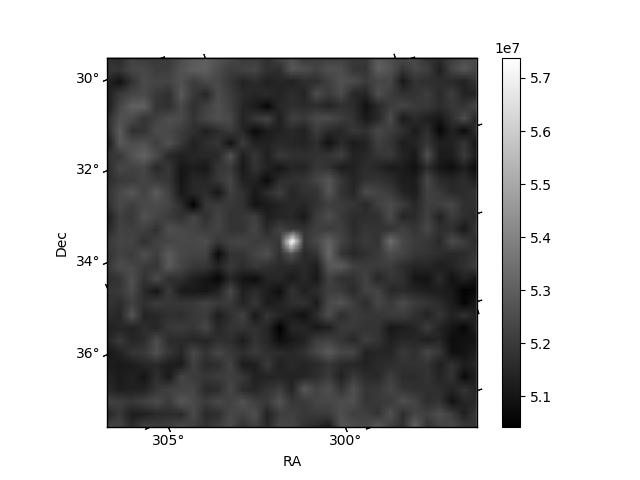
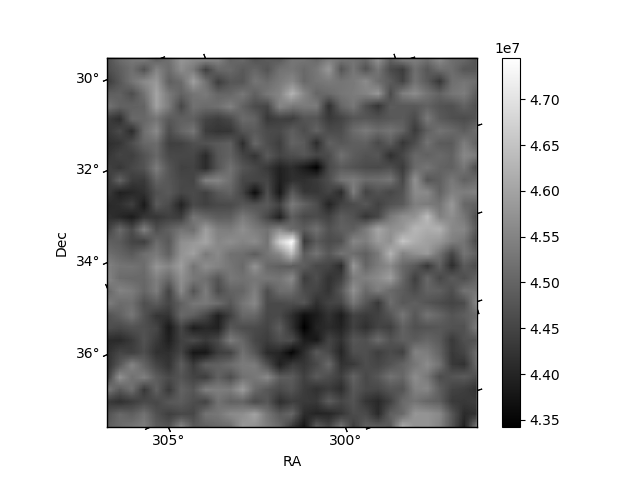
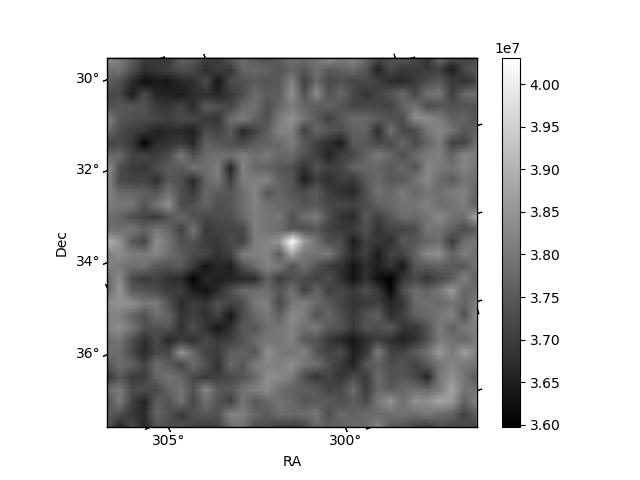
Histogram calculated using DETX and DETY for each event in the final _common_clean file
| Quadrant A | 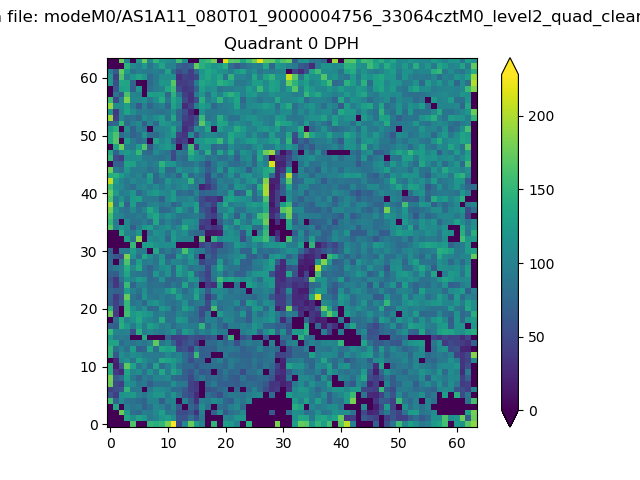 |
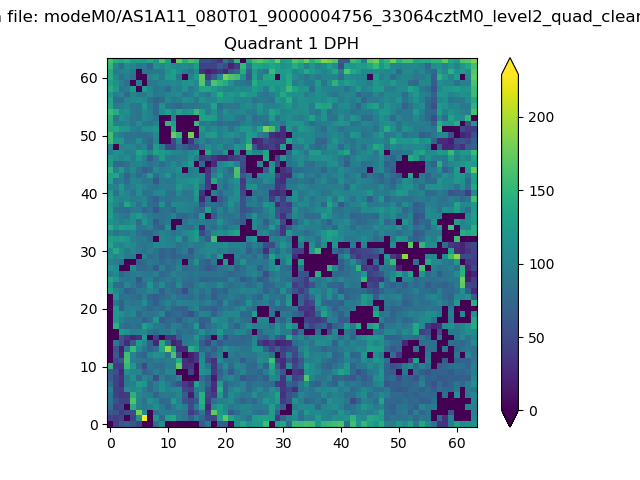 |
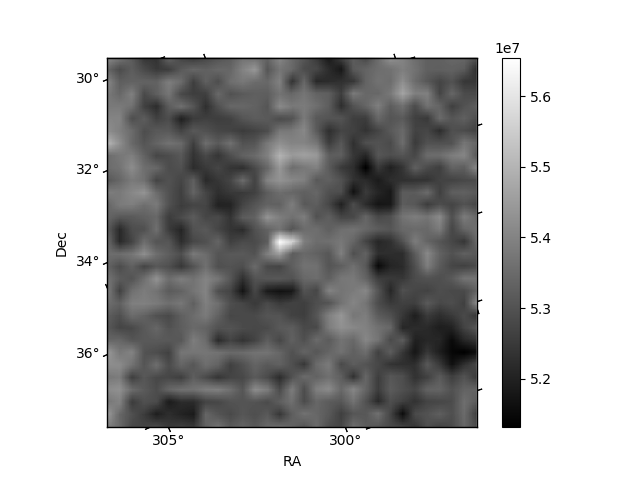
Quadrant B |
|---|---|---|---|
| Quadrant D | 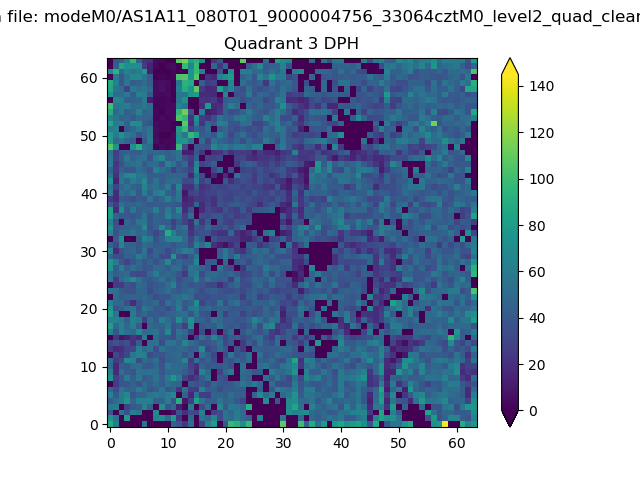 |
 |
Quadrant C |
| Plot type | Count rate plots | Images |
|---|---|---|
| Comparison with Poisson distribution Blue bars denote a histogram of data divided into 1 sec bins. Red curve is a Poisson curve with rate = median count rate of data. |
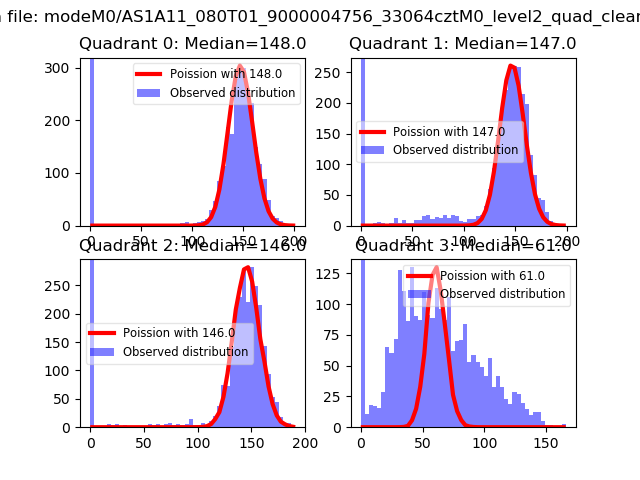 |
 |
| Quadrant-wise count rates Data is divided into 100 sec bins |
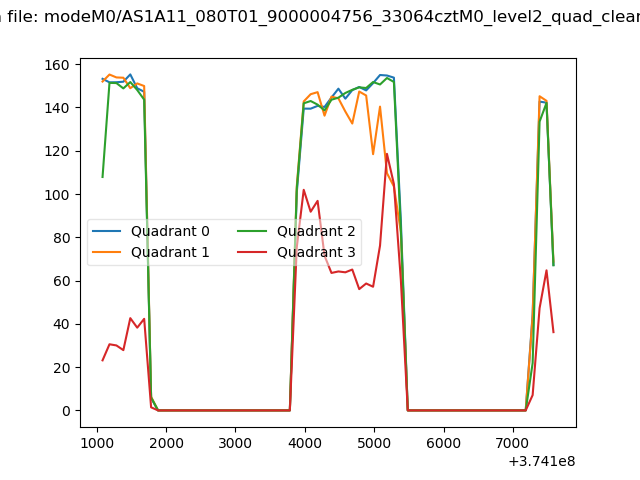 |
|
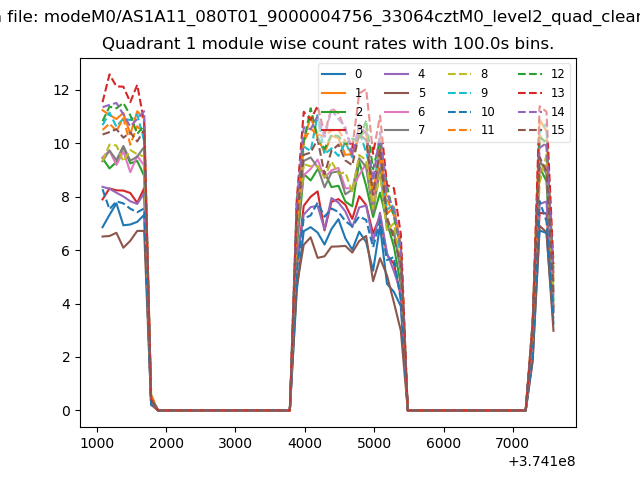
| Module-wise count rates for Quadrant A Data is divided into 100 sec bins |
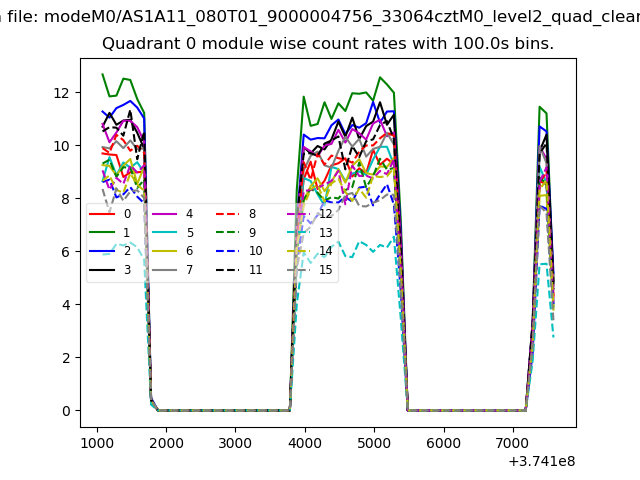 |
 |
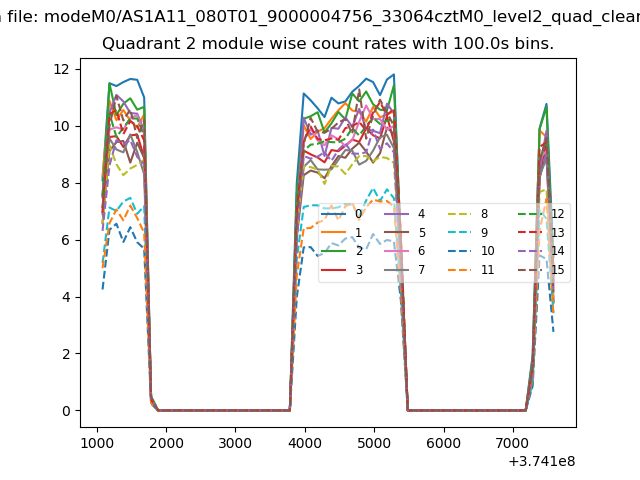
| Module-wise count rates for Quadrant B Data is divided into 100 sec bins |
 |
 |
| Module-wise count rates for Quadrant C Data is divided into 100 sec bins |
 |
 |
| Module-wise count rates for Quadrant D Data is divided into 100 sec bins |
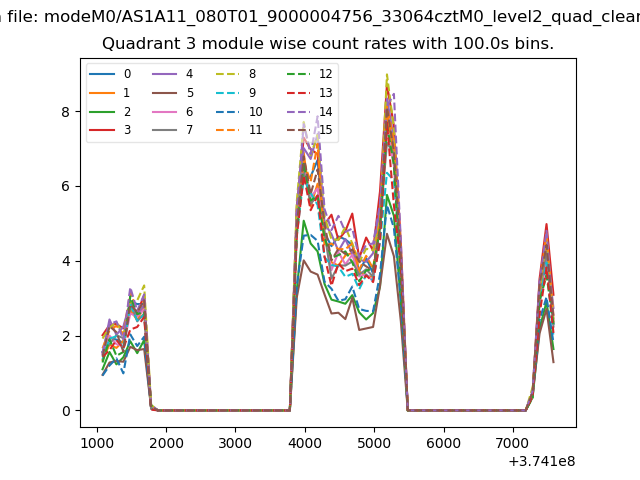 |
 |
| Parameter | Plot |
|---|---|
| CZT HV Monitor | 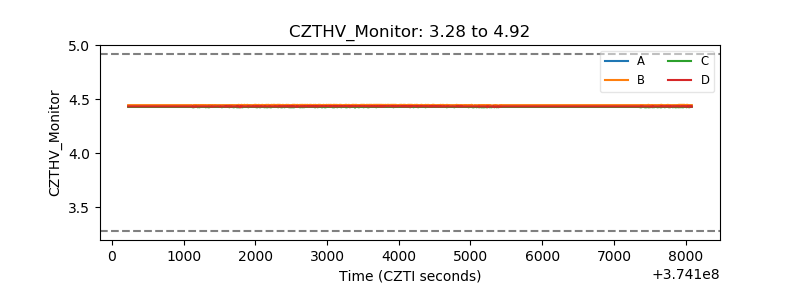 |
| D_VDD | 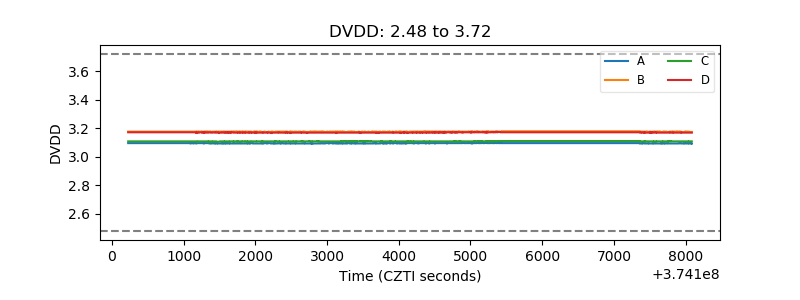 |
| Temperature 1 | 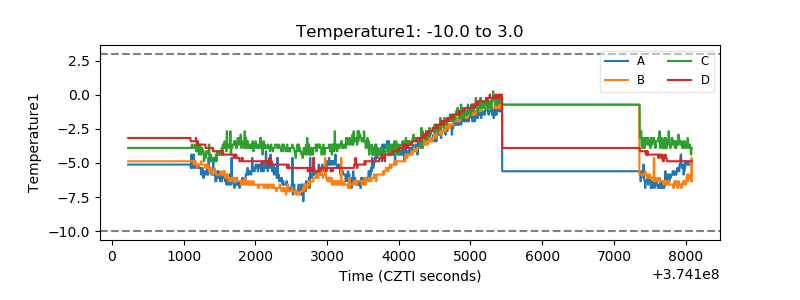 |
| Veto HV Monitor |  |
| Veto LLD | 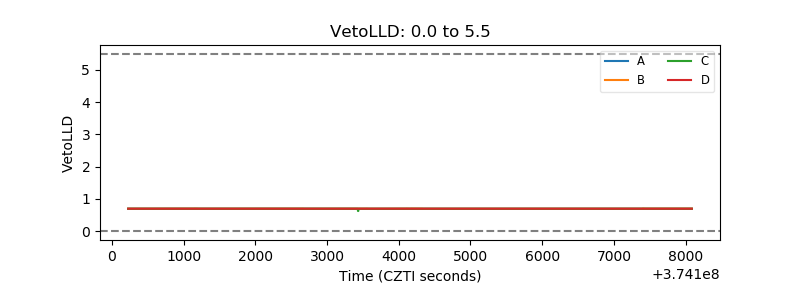 |
| Alpha Counter | 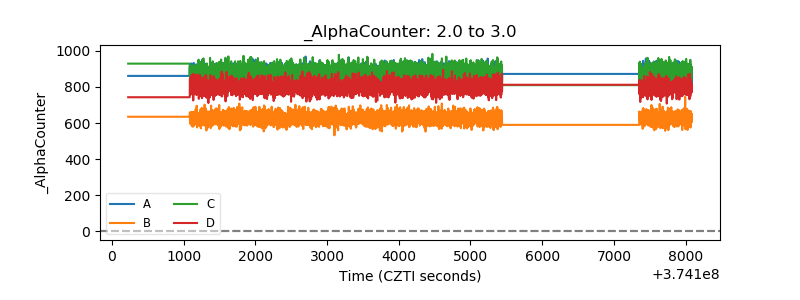 |
| _CPM_Rate | 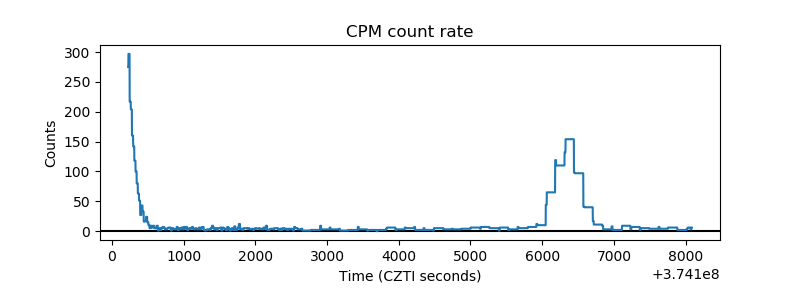 |
| CZT Counter | 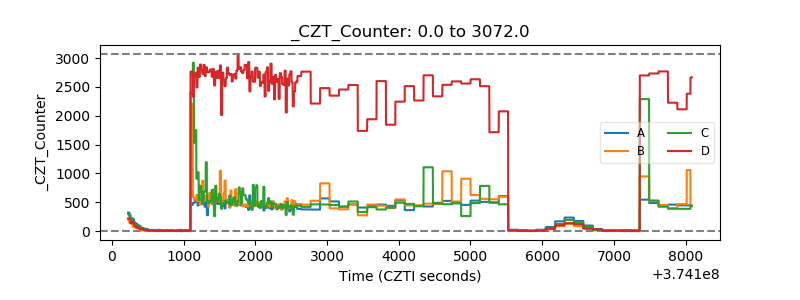 |
| +2.5 Volts monitor |  |
| +5 Volts monitor |  |
| _ROLL_ROT | 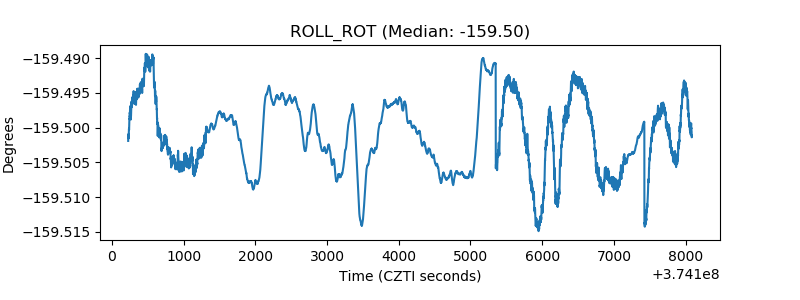 |
| _Roll_DEC | 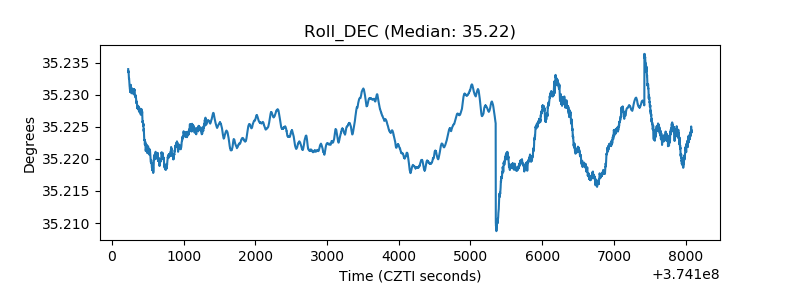 |
| _Roll_RA | 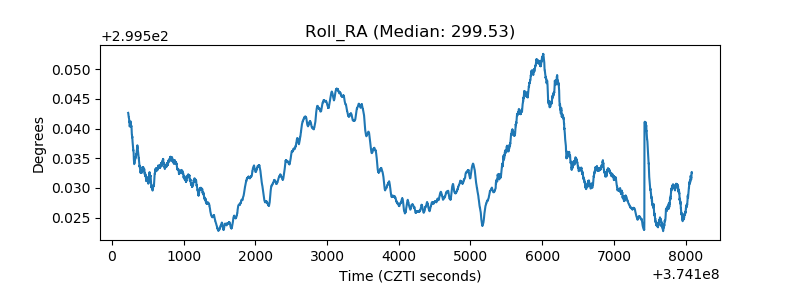 |
| Veto Counter | 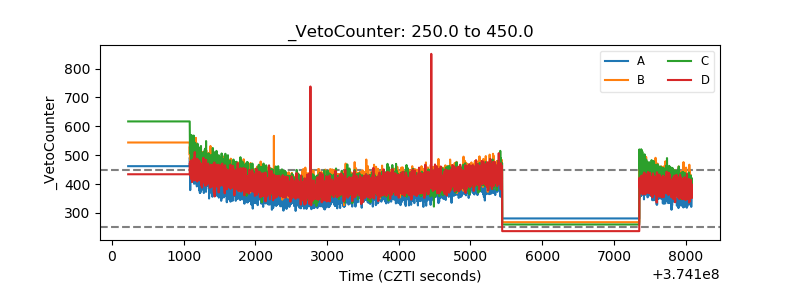 |