| Param | Original file | Final file |
|---|---|---|
| Filename | modeM0/AS1A11_080T01_9000004756_33065cztM0_level2.evt | modeM0/AS1A11_080T01_9000004756_33065cztM0_level2_quad_clean.evt |
| Size (bytes) | 689,955,840 | 57,620,160 |
| Size | 658.0 MB | 55.0 MB |
| Events in quadrant A | 2,605,868 | 372,680 |
| Events in quadrant B | 4,348,940 | 342,762 |
| Events in quadrant C | 2,997,964 | 363,894 |
| Events in quadrant D | 10,559,266 | 267,403 |
| Mode SS | |||
|---|---|---|---|
| Quadrant | BADHDUFLAG | Total packets | Discarded packets |
| A | 0 | 116 | 0 |
| B | 0 | 116 | 0 |
| C | 0 | 116 | 0 |
| D | 0 | 116 | 0 |
| Mode M9 | |||
|---|---|---|---|
| Quadrant | BADHDUFLAG | Total packets | Discarded packets |
| A | 0 | 21 | 0 |
| B | 0 | 21 | 0 |
| C | 0 | 21 | 0 |
| D | 0 | 22 | 0 |
| Mode M0 | |||
|---|---|---|---|
| Quadrant | BADHDUFLAG | Total packets | Discarded packets |
| A | 0 | 11502 | 3 |
| B | 0 | 16635 | 2 |
| C | 0 | 12541 | 2 |
| D | 0 | 35278 | 2 |
| Quadrant | Total seconds | Saturated seconds | Saturation percentage |
|---|---|---|---|
| A | 5674 | 13 | 0.229115% |
| B | 5674 | 549 | 9.675714% |
| C | 5674 | 89 | 1.568558% |
| D | 5674 | 2468 | 43.496651% |
Noise dominated data is calculated using 1-second bins in cleaned event files. If a bin has >2000 counts, and if more than 50% of those come from <1% of pixels, then it is considered to be noise-dominated and hence unusable.
| Quadrant | # 1 sec bins | Bins with >0 counts | Bins with >2000 counts | High rate bins dominated by noise | Noise dominated (total time) | Noise dominated (detector-on time) | Marked lightcurve |
|---|---|---|---|---|---|---|---|
| A | 7256 | 5675 | 3 | 3 | 0.04% | 0.05% | 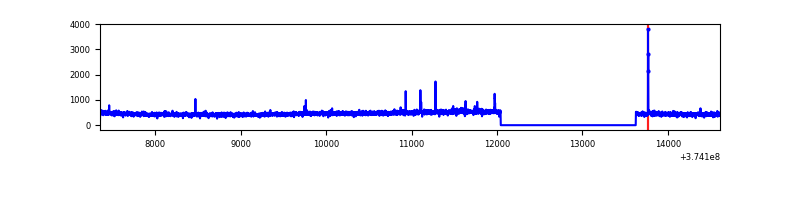 |
| B | 7256 | 5675 | 402 | 402 | 5.54% | 7.08% | 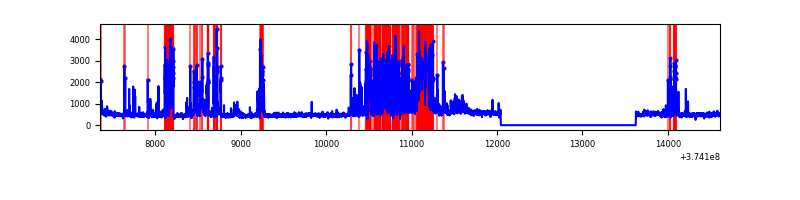 |
| C | 7256 | 5675 | 69 | 69 | 0.95% | 1.22% | 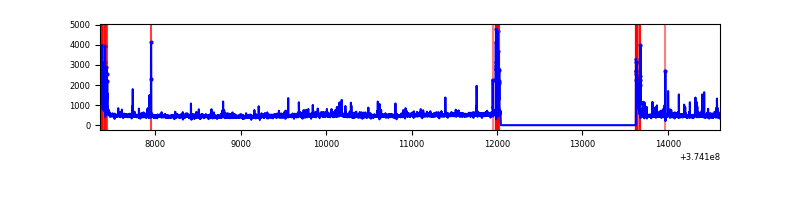 |
| D | 7256 | 5675 | 2643 | 2643 | 36.43% | 46.57% | 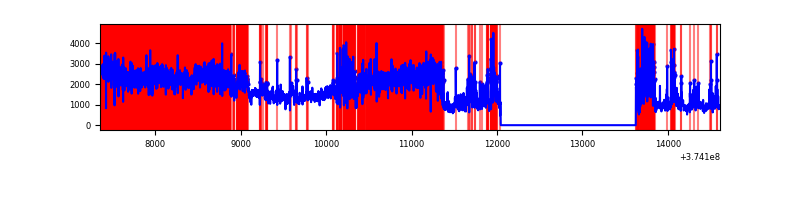 |
Top three noisy pixels from each quadrant. If the there are fewer than three noisy pixels in the level2.evt file, extra rows are filled as -1
| Pixel properties | Quadrant properties | ||||||
|---|---|---|---|---|---|---|---|
| Quadrant | DetID | PixID | Counts | Sigma | Mean | Median | Sigma |
| A | 10 | 248 | 12599 | 89.21 | 664 | 651 | 133.9 |
| A | 12 | 227 | 12216 | 86.35 | 664 | 651 | 133.9 |
| A | 13 | 254 | 10483 | 73.41 | 664 | 651 | 133.9 |
| B | 5 | 172 | 907615 | 7474.97 | 636 | 621 | 121.3 |
| B | 5 | 200 | 671952 | 5532.76 | 636 | 621 | 121.3 |
| B | 0 | 189 | 110345 | 904.29 | 636 | 621 | 121.3 |
| C | 0 | 10 | 235019 | 1567.05 | 643 | 651 | 149.6 |
| C | 7 | 221 | 154156 | 1026.38 | 643 | 651 | 149.6 |
| C | 1 | 23 | 72044 | 477.35 | 643 | 651 | 149.6 |
| D | 7 | 223 | 5585054 | 37847.38 | 556 | 544 | 147.6 |
| D | 8 | 195 | 1520253 | 10299.38 | 556 | 544 | 147.6 |
| D | 2 | 250 | 754360 | 5108.77 | 556 | 544 | 147.6 |
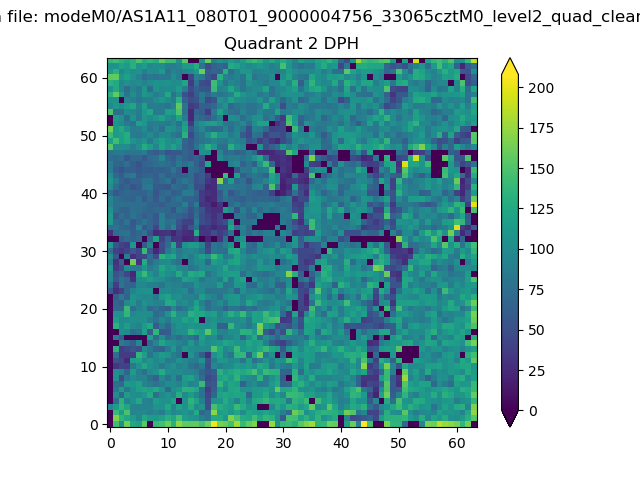
Histogram calculated using DETX and DETY for each event in the final _common_clean file
| Quadrant A | 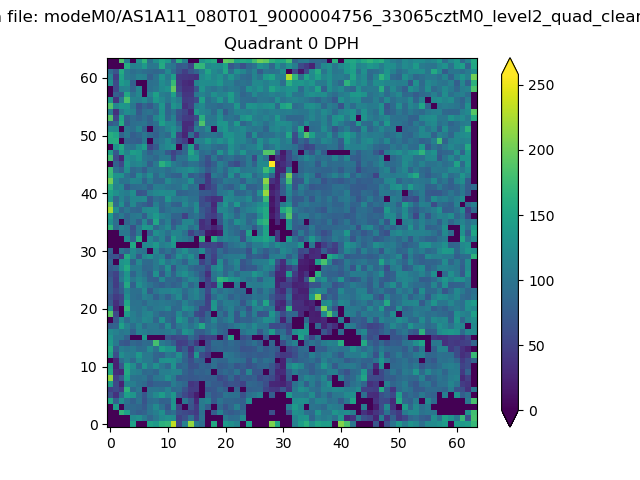 |
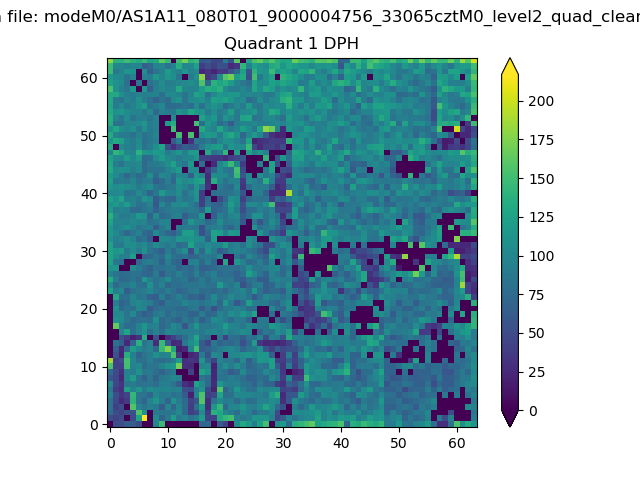 |
Quadrant B |
|---|---|---|---|
| Quadrant D | 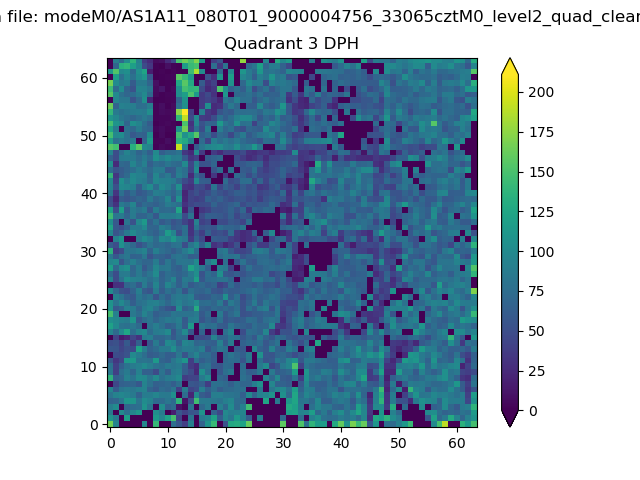 |
 |
Quadrant C |
| Plot type | Count rate plots | Images |
|---|---|---|
| Comparison with Poisson distribution Blue bars denote a histogram of data divided into 1 sec bins. Red curve is a Poisson curve with rate = median count rate of data. |
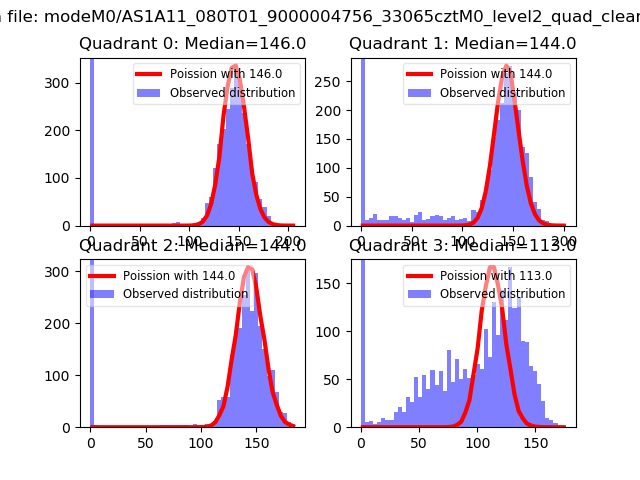 |
 |
| Quadrant-wise count rates Data is divided into 100 sec bins |
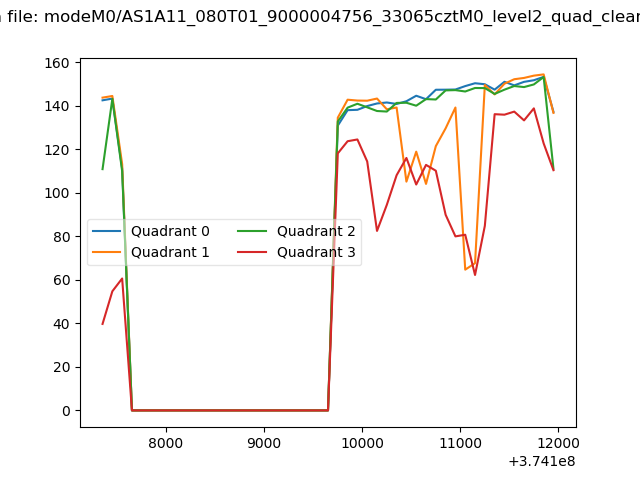 |
|
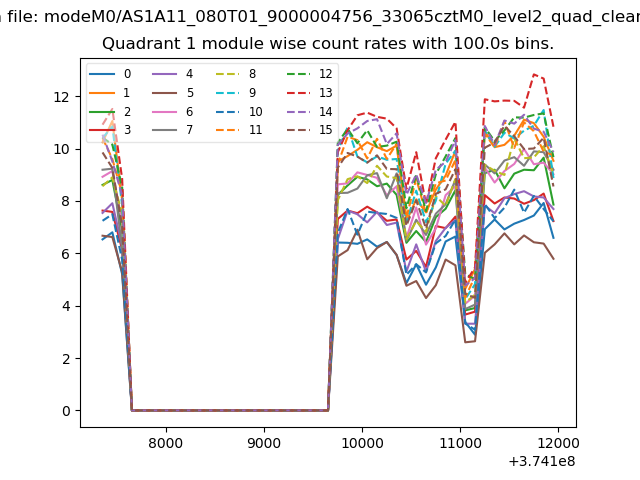
| Module-wise count rates for Quadrant A Data is divided into 100 sec bins |
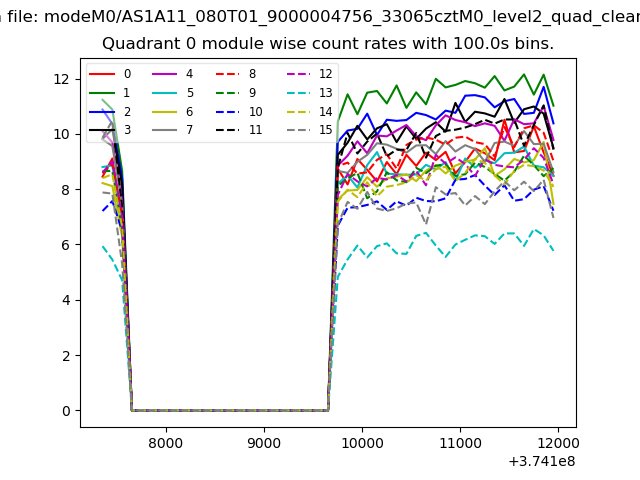 |
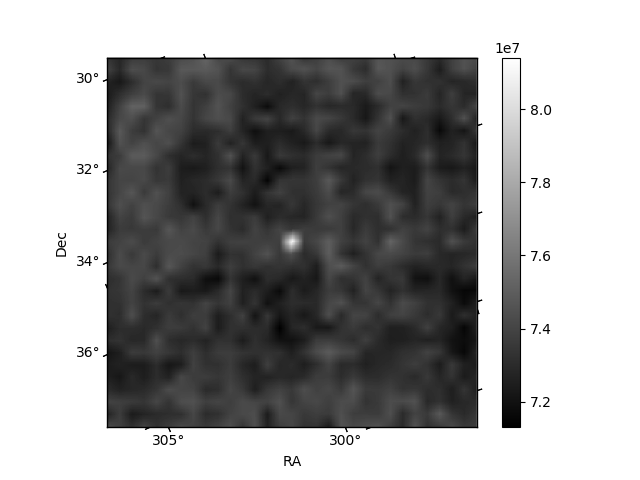 |
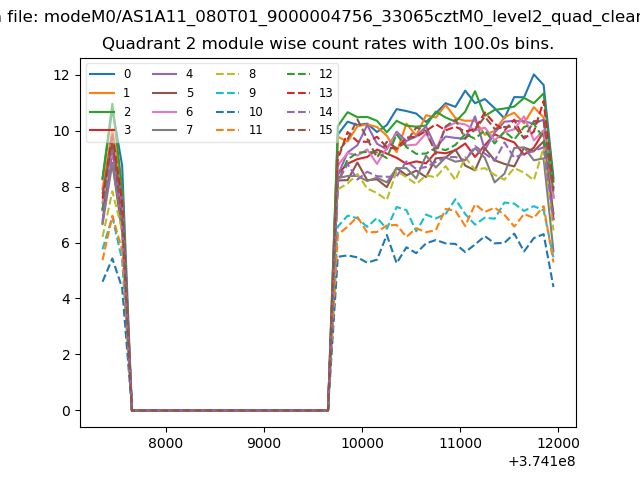
| Module-wise count rates for Quadrant B Data is divided into 100 sec bins |
 |
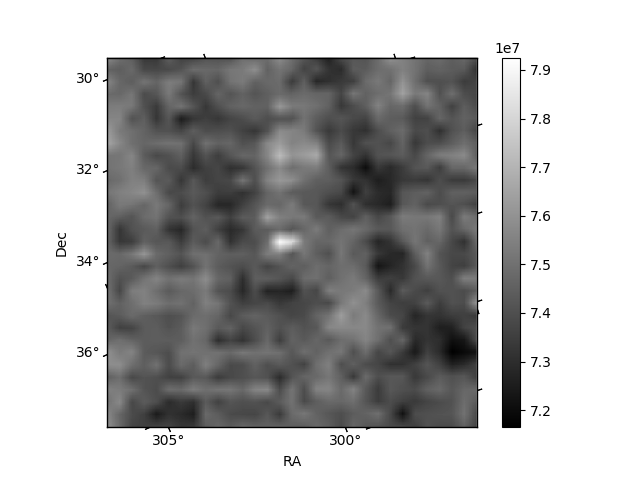 |
| Module-wise count rates for Quadrant C Data is divided into 100 sec bins |
 |
 |
| Module-wise count rates for Quadrant D Data is divided into 100 sec bins |
 |
 |
| Parameter | Plot |
|---|---|
| CZT HV Monitor |  |
| D_VDD | 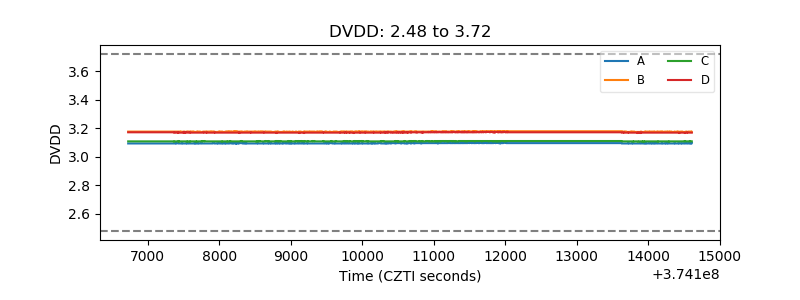 |
| Temperature 1 | 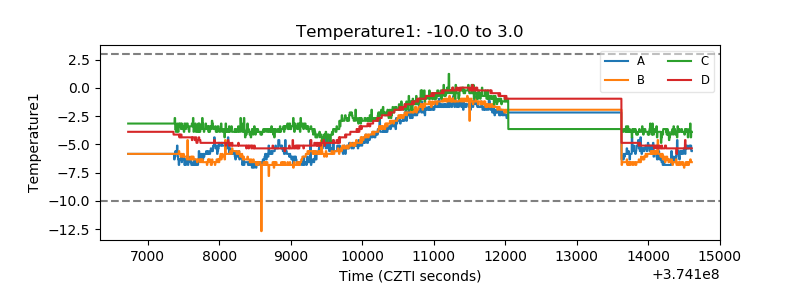 |
| Veto HV Monitor | 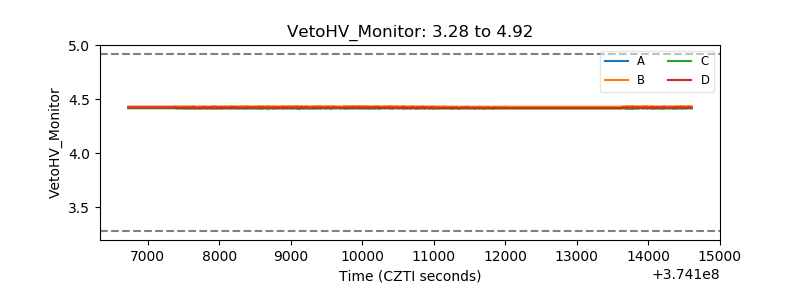 |
| Veto LLD | 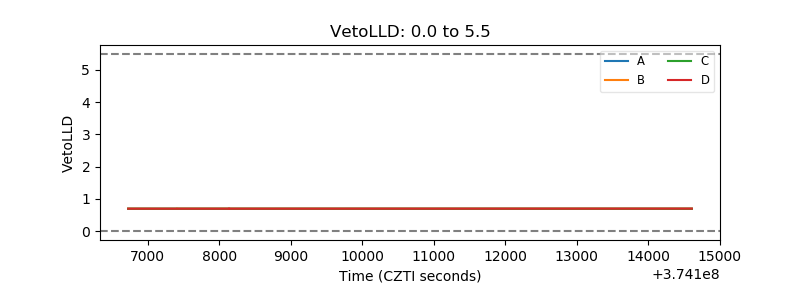 |
| Alpha Counter | 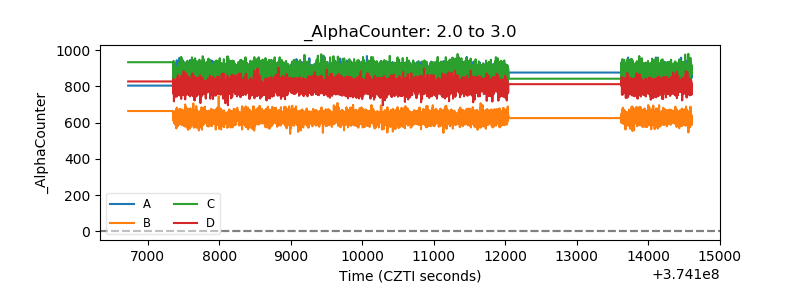 |
| _CPM_Rate | 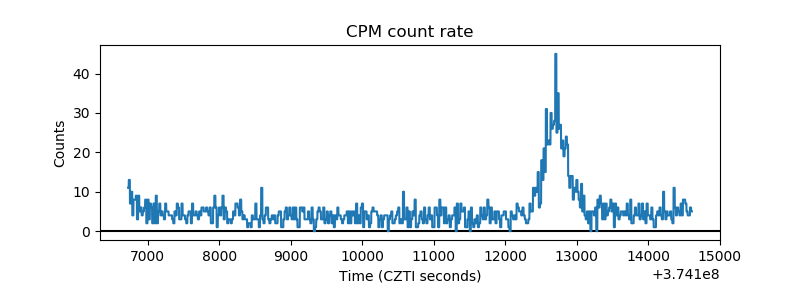 |
| CZT Counter | 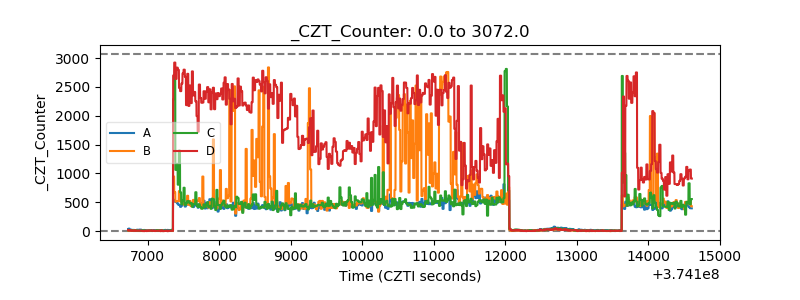 |
| +2.5 Volts monitor | 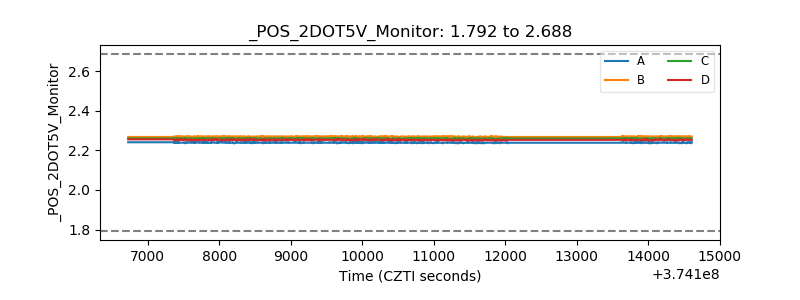 |
| +5 Volts monitor | 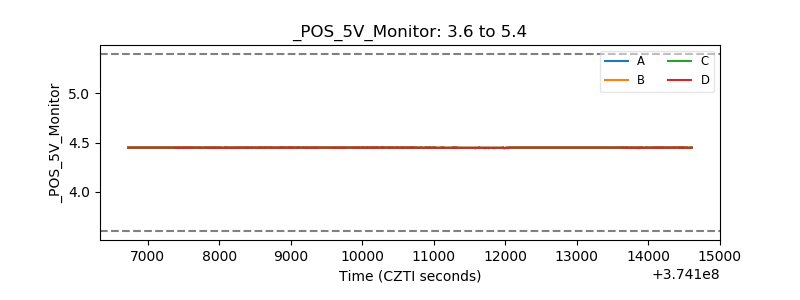 |
| _ROLL_ROT | 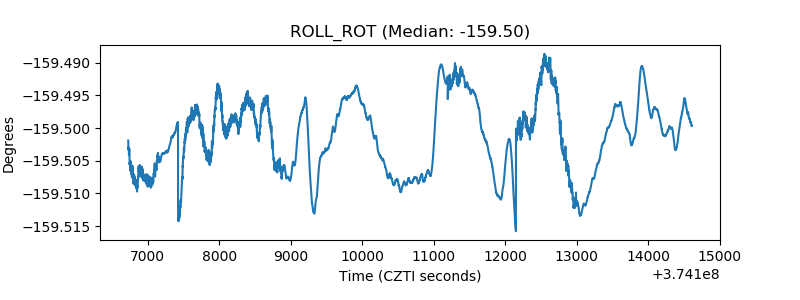 |
| _Roll_DEC | 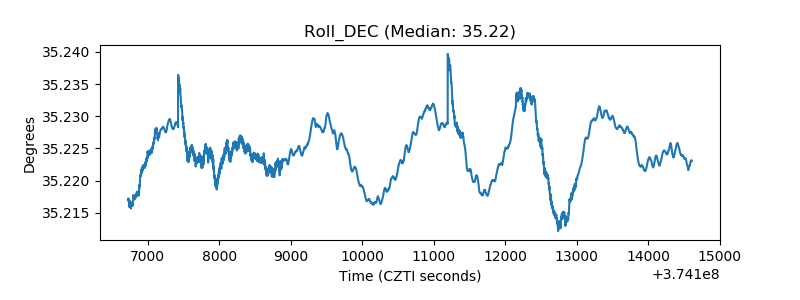 |
| _Roll_RA | 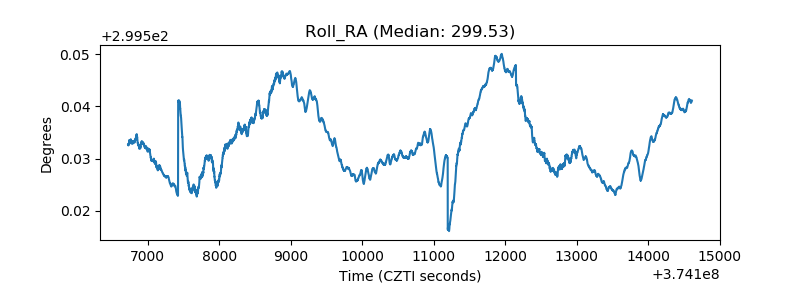 |
| Veto Counter | 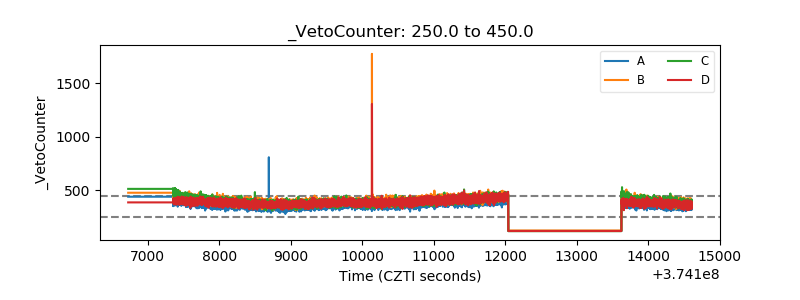 |