| Param | Original file | Final file |
|---|---|---|
| Filename | modeM0/AS1A11_080T01_9000004756_33067cztM0_level2.evt | modeM0/AS1A11_080T01_9000004756_33067cztM0_level2_quad_clean.evt |
| Size (bytes) | 614,134,080 | 75,571,200 |
| Size | 585.7 MB | 72.1 MB |
| Events in quadrant A | 2,742,804 | 493,381 |
| Events in quadrant B | 3,814,373 | 485,798 |
| Events in quadrant C | 3,408,345 | 483,835 |
| Events in quadrant D | 8,231,056 | 408,713 |
| Mode SS | |||
|---|---|---|---|
| Quadrant | BADHDUFLAG | Total packets | Discarded packets |
| A | 0 | 124 | 0 |
| B | 0 | 124 | 0 |
| C | 0 | 124 | 0 |
| D | 0 | 124 | 0 |
| Mode M9 | |||
|---|---|---|---|
| Quadrant | BADHDUFLAG | Total packets | Discarded packets |
| A | 0 | 26 | 0 |
| B | 0 | 26 | 0 |
| C | 0 | 26 | 0 |
| D | 0 | 26 | 0 |
| Mode M0 | |||
|---|---|---|---|
| Quadrant | BADHDUFLAG | Total packets | Discarded packets |
| A | 0 | 11969 | 3 |
| B | 0 | 15129 | 2 |
| C | 0 | 13974 | 2 |
| D | 0 | 28695 | 2 |
| Quadrant | Total seconds | Saturated seconds | Saturation percentage |
|---|---|---|---|
| A | 5952 | 4 | 0.067204% |
| B | 5952 | 253 | 4.250672% |
| C | 5952 | 57 | 0.957661% |
| D | 5952 | 1131 | 19.002016% |
Noise dominated data is calculated using 1-second bins in cleaned event files. If a bin has >2000 counts, and if more than 50% of those come from <1% of pixels, then it is considered to be noise-dominated and hence unusable.
| Quadrant | # 1 sec bins | Bins with >0 counts | Bins with >2000 counts | High rate bins dominated by noise | Noise dominated (total time) | Noise dominated (detector-on time) | Marked lightcurve |
|---|---|---|---|---|---|---|---|
| A | 8576 | 5954 | 0 | 0 | 0.00% | 0.00% | 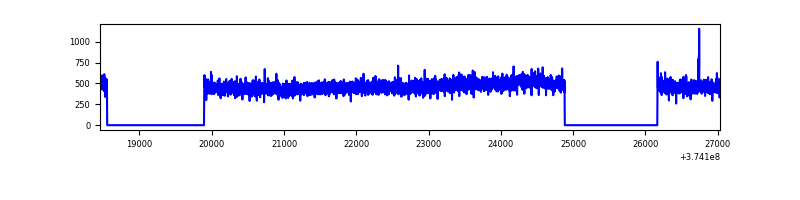 |
| B | 8576 | 5954 | 168 | 168 | 1.96% | 2.82% | 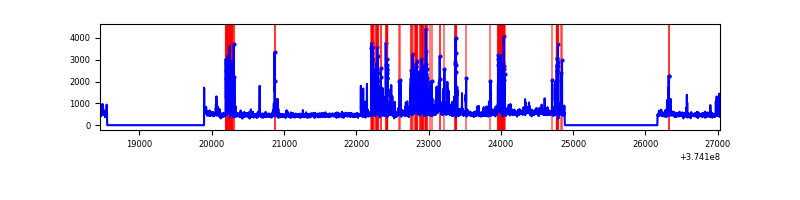 |
| C | 8576 | 5954 | 45 | 45 | 0.52% | 0.76% | 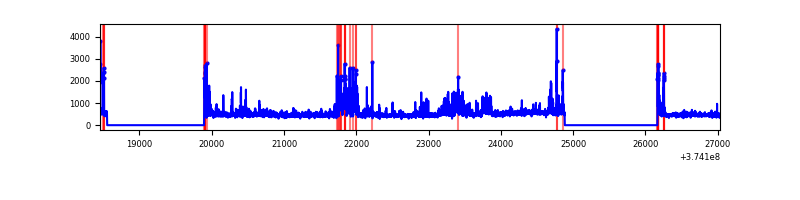 |
| D | 8576 | 5954 | 1061 | 1061 | 12.37% | 17.82% | 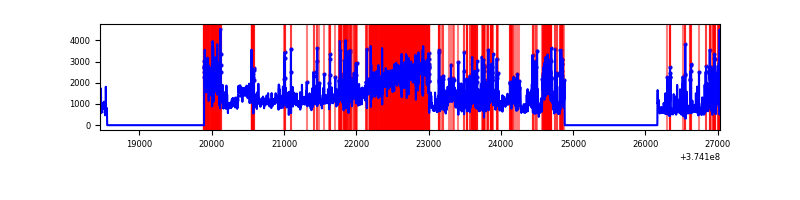 |
Top three noisy pixels from each quadrant. If the there are fewer than three noisy pixels in the level2.evt file, extra rows are filled as -1
| Pixel properties | Quadrant properties | ||||||
|---|---|---|---|---|---|---|---|
| Quadrant | DetID | PixID | Counts | Sigma | Mean | Median | Sigma |
| A | 13 | 254 | 12601 | 83.2 | 705 | 690 | 143.2 |
| A | 13 | 6 | 9940 | 64.61 | 705 | 690 | 143.2 |
| A | 3 | 137 | 6524 | 40.75 | 705 | 690 | 143.2 |
| B | 5 | 172 | 664111 | 4943.23 | 696 | 680 | 134.2 |
| B | 0 | 245 | 202194 | 1501.48 | 696 | 680 | 134.2 |
| B | 0 | 189 | 97366 | 720.41 | 696 | 680 | 134.2 |
| C | 7 | 221 | 507006 | 3184.11 | 684 | 692 | 159.0 |
| C | 0 | 10 | 112696 | 704.37 | 684 | 692 | 159.0 |
| C | 1 | 241 | 57207 | 355.41 | 684 | 692 | 159.0 |
| D | 7 | 223 | 2949834 | 17559.94 | 636 | 623 | 168.0 |
| D | 8 | 195 | 839628 | 4995.53 | 636 | 623 | 168.0 |
| D | 12 | 218 | 501456 | 2982.02 | 636 | 623 | 168.0 |
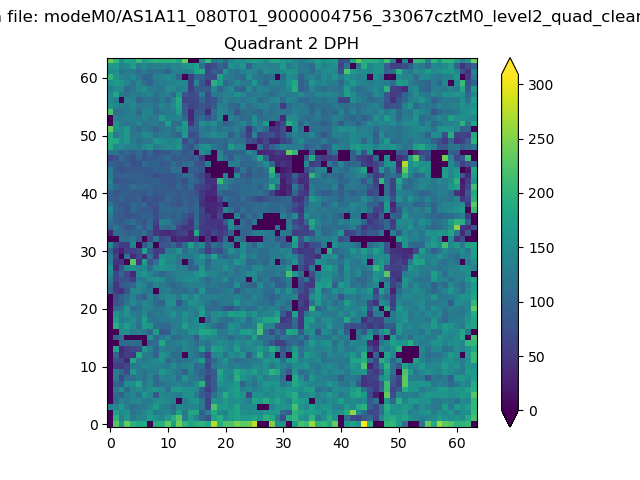
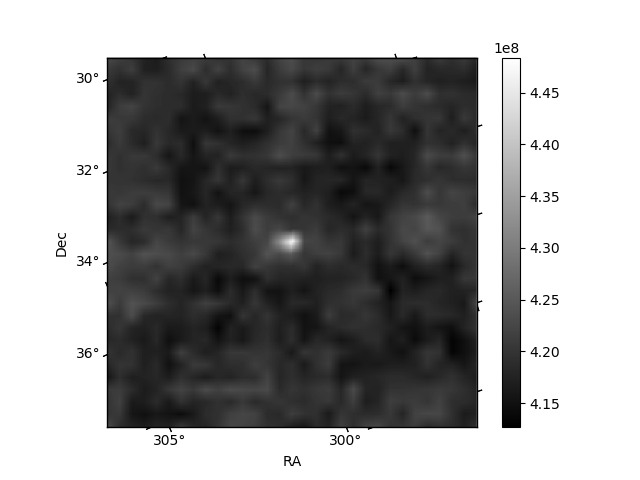
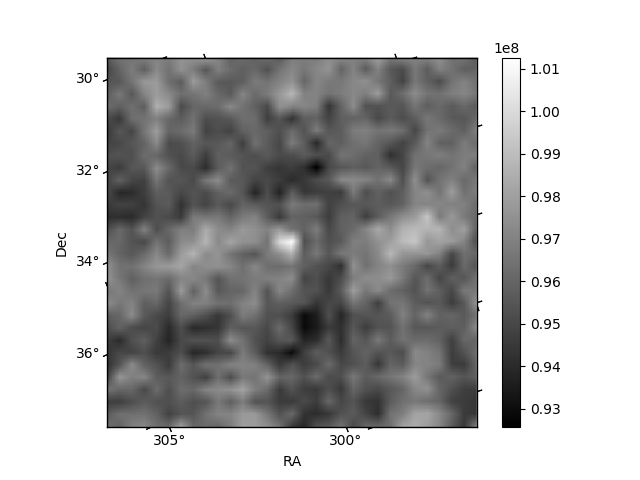
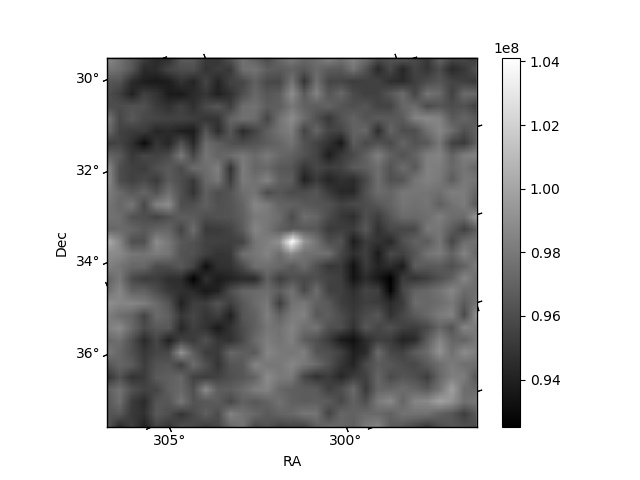
Histogram calculated using DETX and DETY for each event in the final _common_clean file
| Quadrant A | 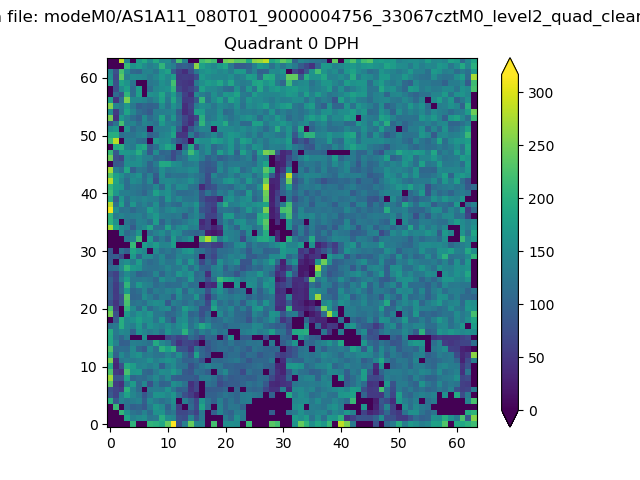 |
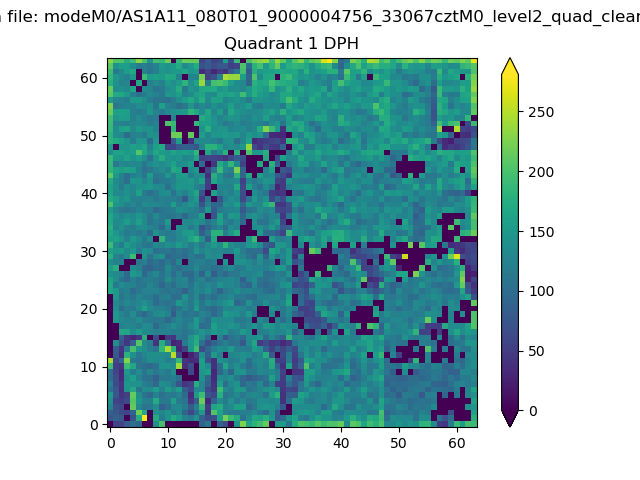 |
Quadrant B |
|---|---|---|---|
| Quadrant D | 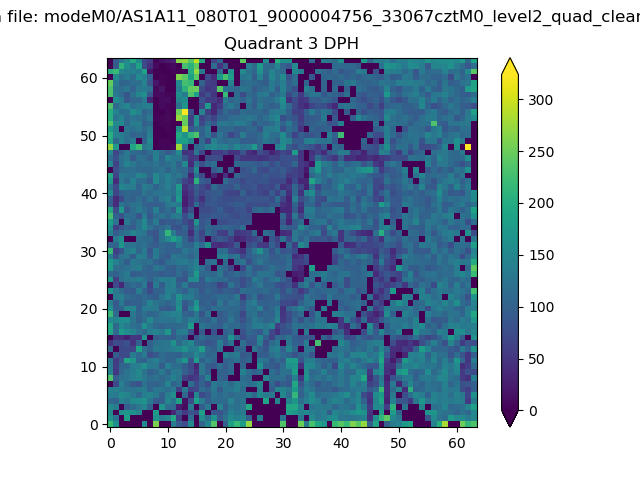 |
 |
Quadrant C |
| Plot type | Count rate plots | Images |
|---|---|---|
| Comparison with Poisson distribution Blue bars denote a histogram of data divided into 1 sec bins. Red curve is a Poisson curve with rate = median count rate of data. |
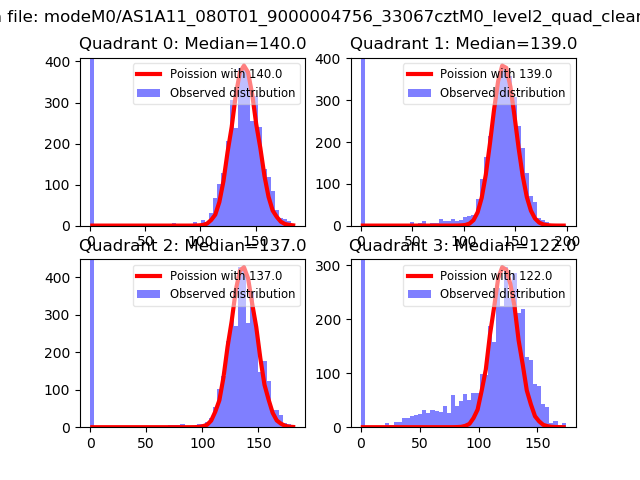 |
 |
| Quadrant-wise count rates Data is divided into 100 sec bins |
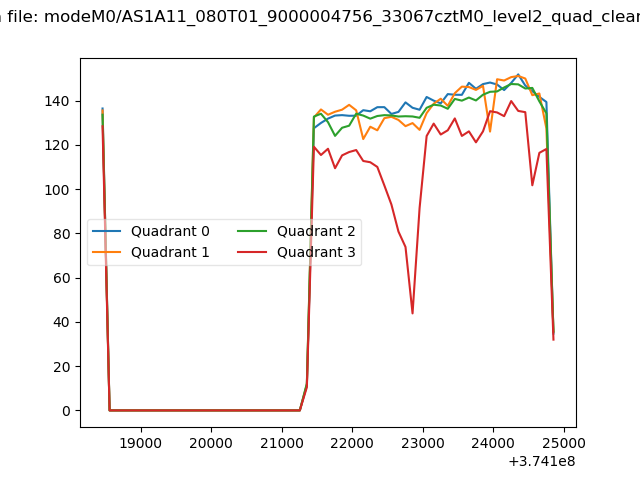 |
|
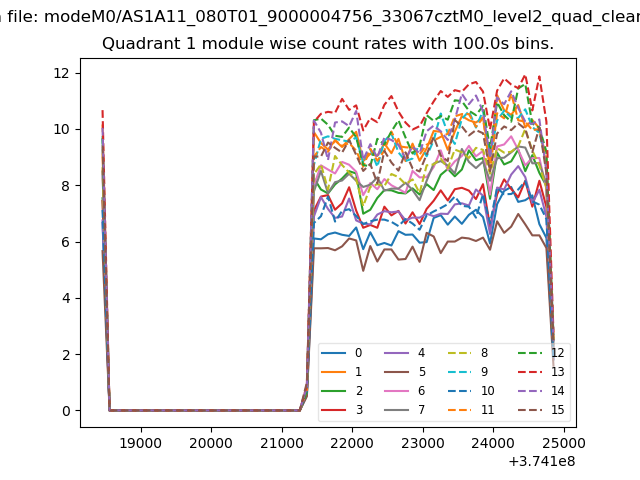
| Module-wise count rates for Quadrant A Data is divided into 100 sec bins |
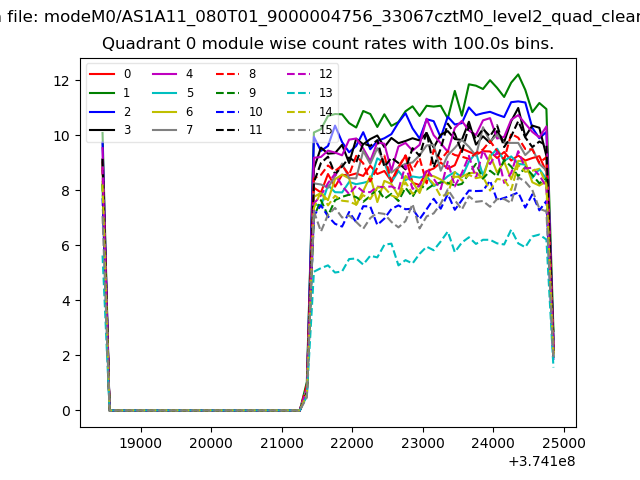 |
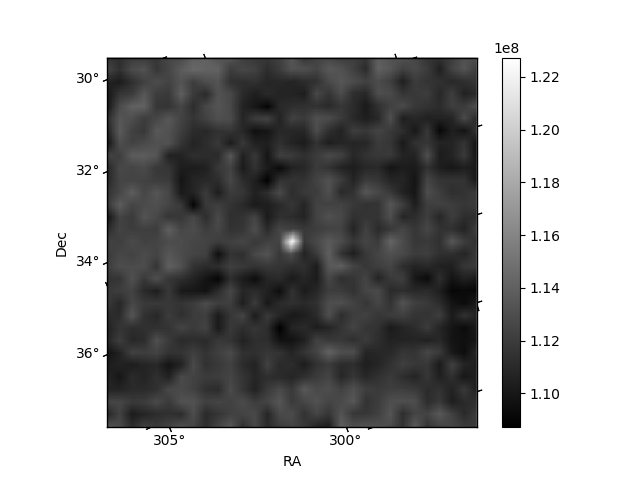 |
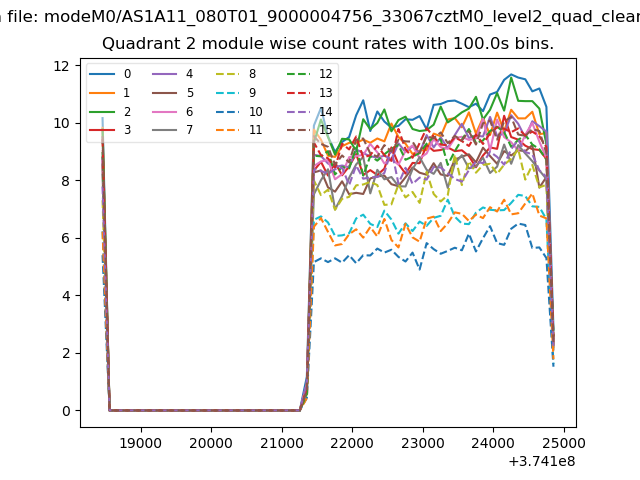
| Module-wise count rates for Quadrant B Data is divided into 100 sec bins |
 |
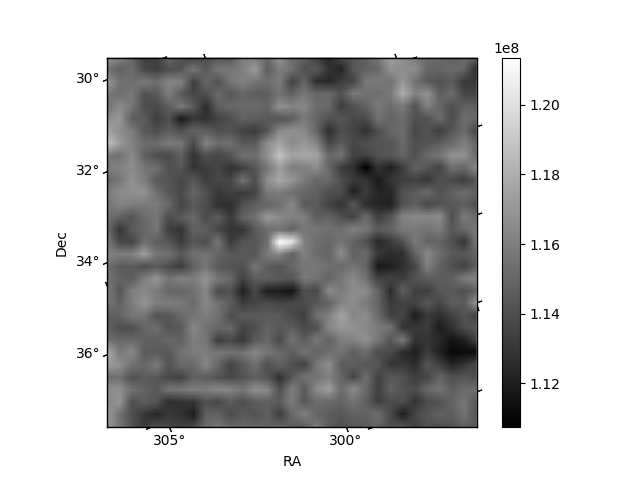 |
| Module-wise count rates for Quadrant C Data is divided into 100 sec bins |
 |
 |
| Module-wise count rates for Quadrant D Data is divided into 100 sec bins |
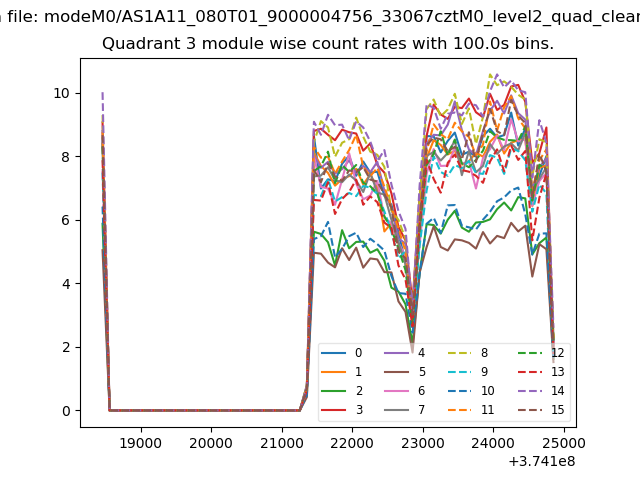 |
 |
| Parameter | Plot |
|---|---|
| CZT HV Monitor | 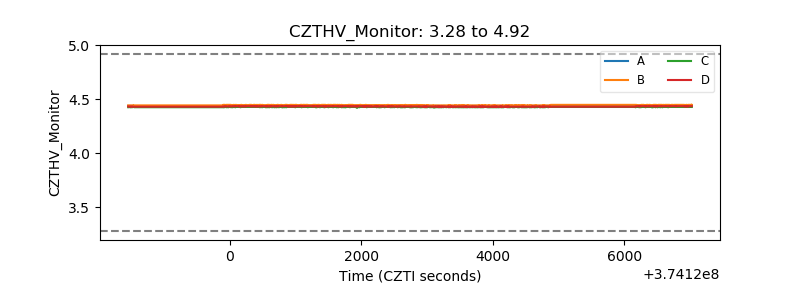 |
| D_VDD | 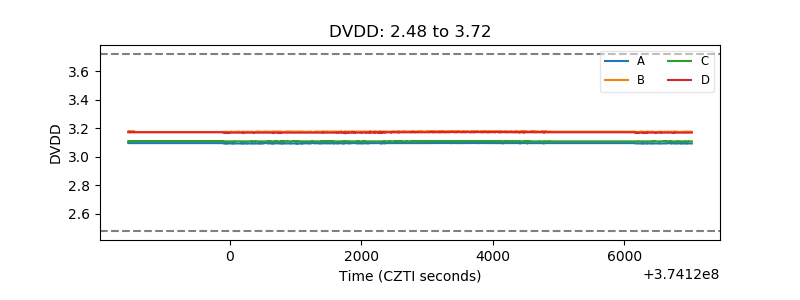 |
| Temperature 1 | 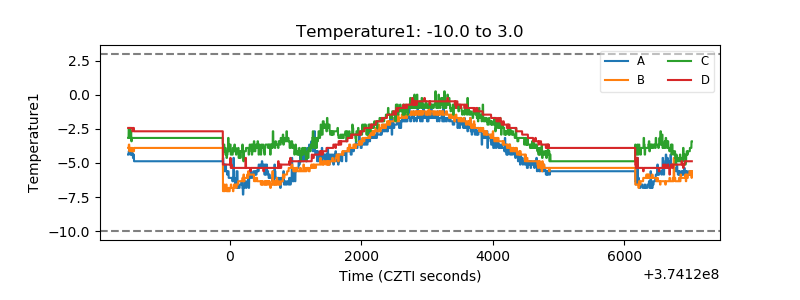 |
| Veto HV Monitor |  |
| Veto LLD | 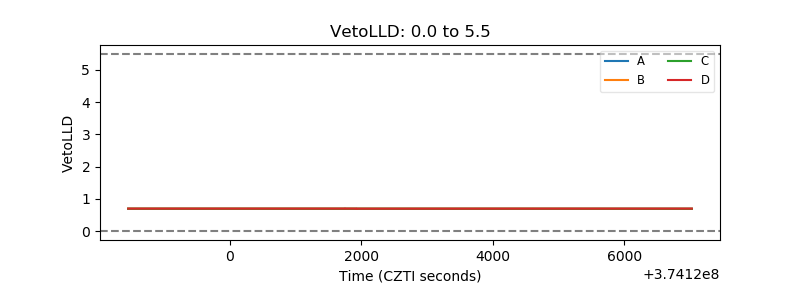 |
| Alpha Counter | 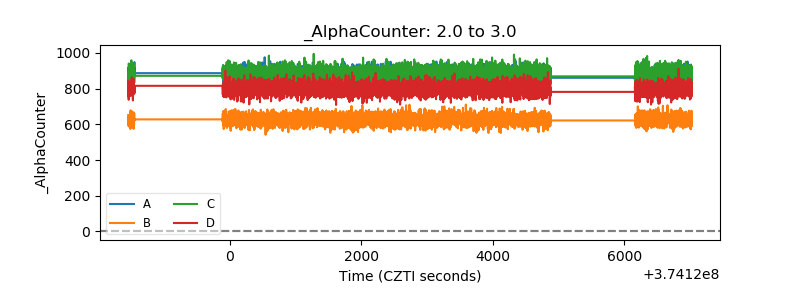 |
| _CPM_Rate | 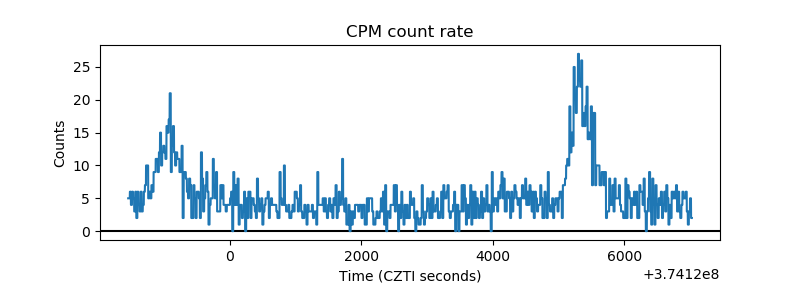 |
| CZT Counter | 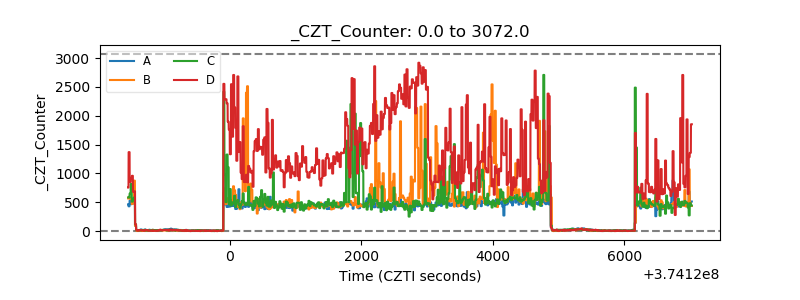 |
| +2.5 Volts monitor |  |
| +5 Volts monitor | 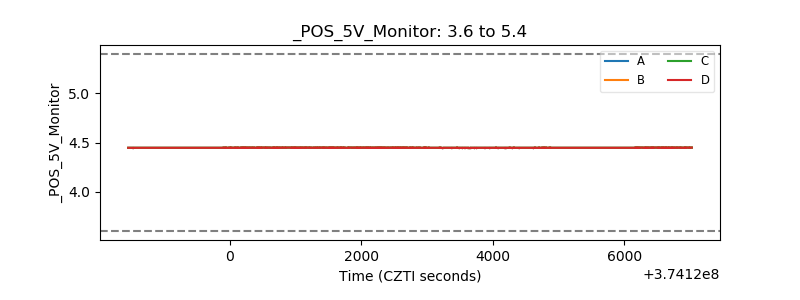 |
| _ROLL_ROT | 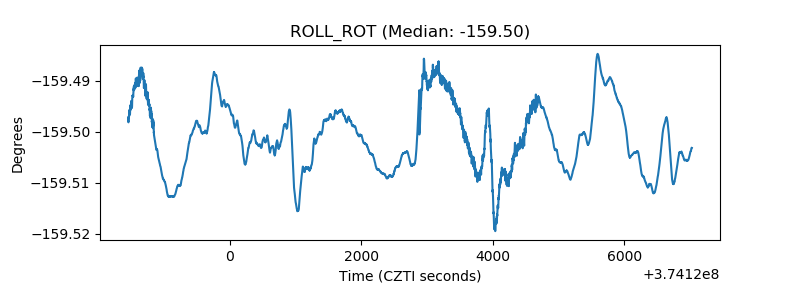 |
| _Roll_DEC |  |
| _Roll_RA | 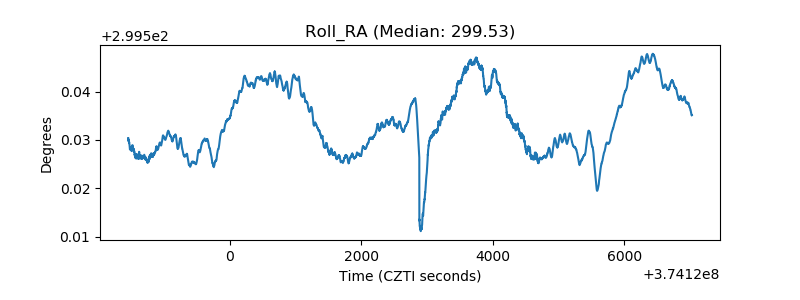 |
| Veto Counter | 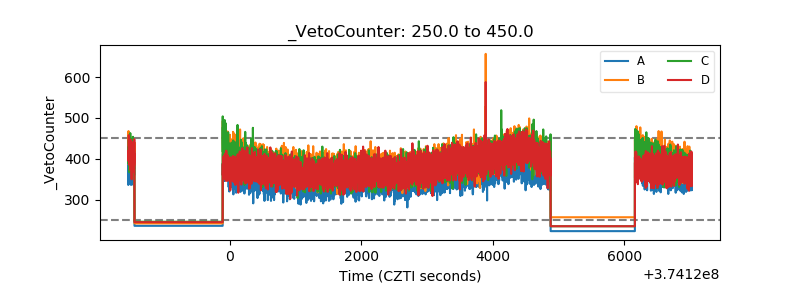 |