| Param | Original file | Final file |
|---|---|---|
| Filename | modeM0/AS1A11_080T01_9000004756_33069cztM0_level2.evt | modeM0/AS1A11_080T01_9000004756_33069cztM0_level2_quad_clean.evt |
| Size (bytes) | 357,687,360 | 51,586,560 |
| Size | 341.1 MB | 49.2 MB |
| Events in quadrant A | 1,656,030 | 344,333 |
| Events in quadrant B | 2,383,957 | 330,970 |
| Events in quadrant C | 2,003,263 | 338,697 |
| Events in quadrant D | 4,540,625 | 289,275 |
| Mode SS | |||
|---|---|---|---|
| Quadrant | BADHDUFLAG | Total packets | Discarded packets |
| A | 0 | 72 | 0 |
| B | 0 | 72 | 0 |
| C | 0 | 72 | 0 |
| D | 0 | 72 | 0 |
| Mode M9 | |||
|---|---|---|---|
| Quadrant | BADHDUFLAG | Total packets | Discarded packets |
| A | 0 | 9 | 0 |
| B | 0 | 9 | 0 |
| C | 0 | 9 | 0 |
| D | 0 | 10 | 0 |
| Mode M0 | |||
|---|---|---|---|
| Quadrant | BADHDUFLAG | Total packets | Discarded packets |
| A | 0 | 7322 | 1 |
| B | 0 | 9403 | 1 |
| C | 0 | 8326 | 1 |
| D | 0 | 16144 | 1 |
| Quadrant | Total seconds | Saturated seconds | Saturation percentage |
|---|---|---|---|
| A | 3653 | 3 | 0.082124% |
| B | 3653 | 217 | 5.940323% |
| C | 3653 | 50 | 1.368738% |
| D | 3653 | 730 | 19.983575% |
Noise dominated data is calculated using 1-second bins in cleaned event files. If a bin has >2000 counts, and if more than 50% of those come from <1% of pixels, then it is considered to be noise-dominated and hence unusable.
| Quadrant | # 1 sec bins | Bins with >0 counts | Bins with >2000 counts | High rate bins dominated by noise | Noise dominated (total time) | Noise dominated (detector-on time) | Marked lightcurve |
|---|---|---|---|---|---|---|---|
| A | 3653 | 3653 | 0 | 0 | 0.00% | 0.00% | 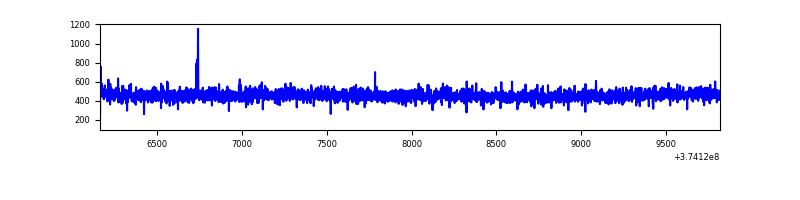 |
| B | 3653 | 3653 | 162 | 162 | 4.43% | 4.43% | 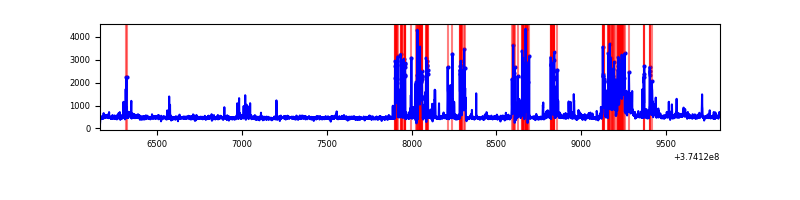 |
| C | 3653 | 3653 | 54 | 54 | 1.48% | 1.48% | 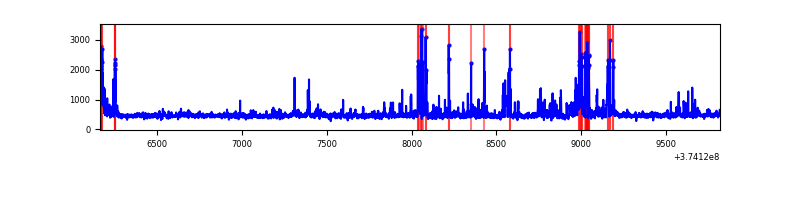 |
| D | 3653 | 3653 | 733 | 733 | 20.07% | 20.07% | 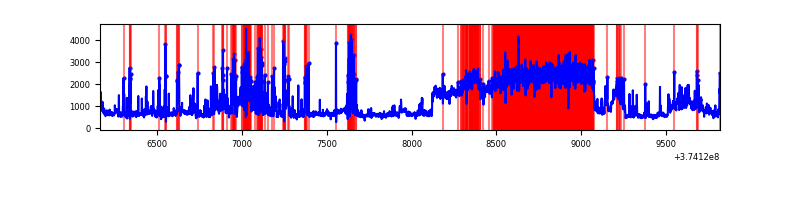 |
Top three noisy pixels from each quadrant. If the there are fewer than three noisy pixels in the level2.evt file, extra rows are filled as -1
| Pixel properties | Quadrant properties | ||||||
|---|---|---|---|---|---|---|---|
| Quadrant | DetID | PixID | Counts | Sigma | Mean | Median | Sigma |
| A | 13 | 254 | 6816 | 73.36 | 424 | 417 | 87.2 |
| A | 13 | 6 | 5552 | 58.87 | 424 | 417 | 87.2 |
| A | 15 | 169 | 5371 | 56.8 | 424 | 417 | 87.2 |
| B | 5 | 172 | 589793 | 7352.08 | 410 | 401 | 80.2 |
| B | 0 | 245 | 63398 | 785.82 | 410 | 401 | 80.2 |
| B | 0 | 189 | 53643 | 664.14 | 410 | 401 | 80.2 |
| C | 7 | 221 | 312839 | 3284.11 | 406 | 410 | 95.1 |
| C | 0 | 10 | 71302 | 745.18 | 406 | 410 | 95.1 |
| C | 6 | 247 | 7112 | 70.45 | 406 | 410 | 95.1 |
| D | 7 | 223 | 1718806 | 16634.31 | 386 | 378 | 103.3 |
| D | 8 | 195 | 488661 | 4726.56 | 386 | 378 | 103.3 |
| D | 2 | 250 | 428891 | 4147.99 | 386 | 378 | 103.3 |
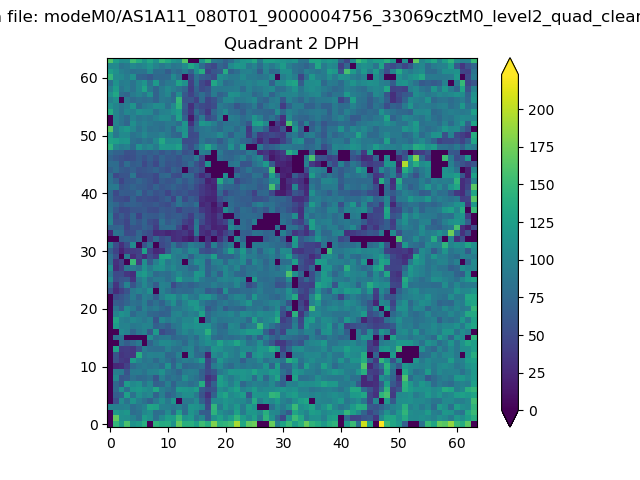
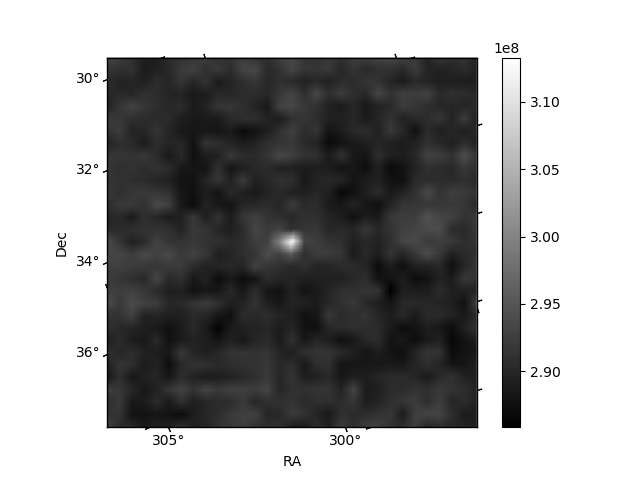
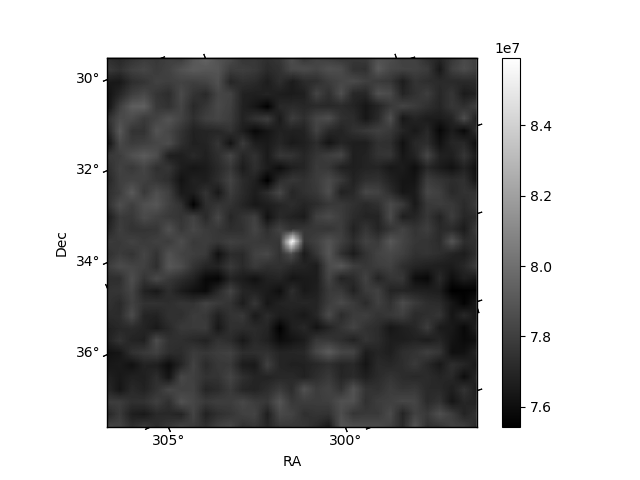
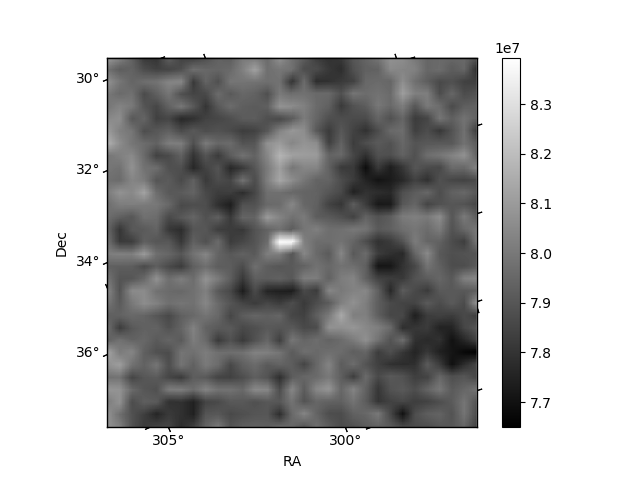
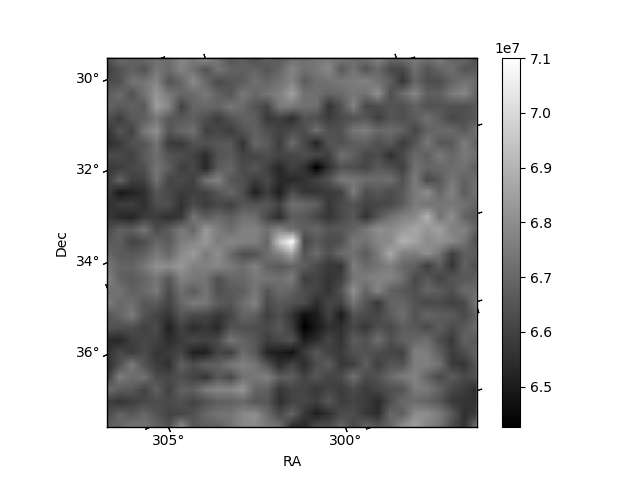
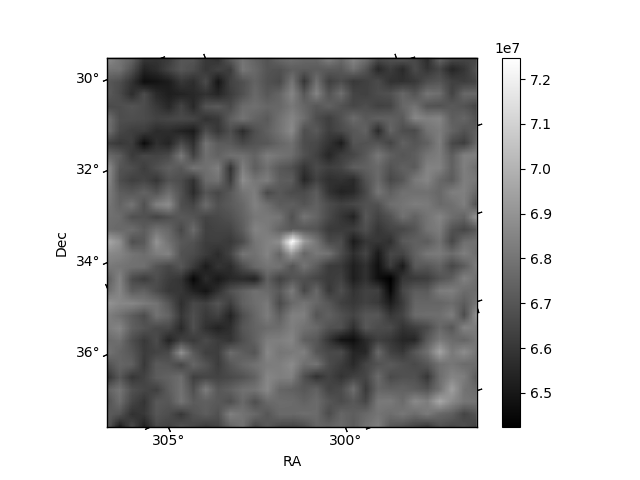
Histogram calculated using DETX and DETY for each event in the final _common_clean file
| Quadrant A | 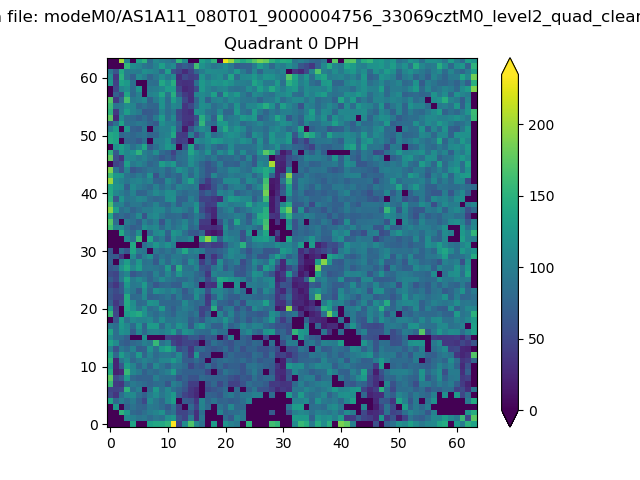 |
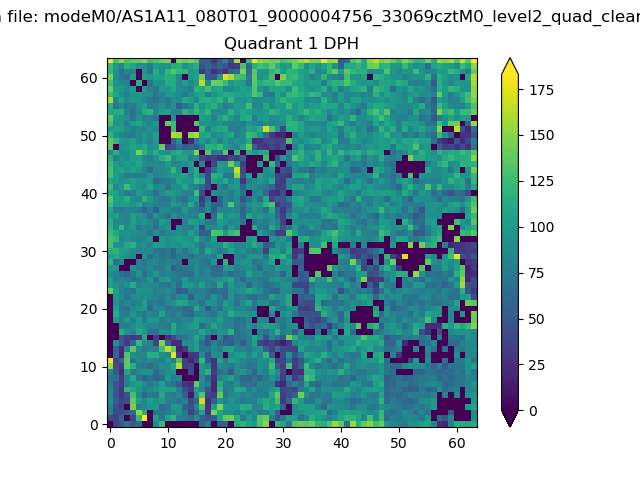 |
Quadrant B |
|---|---|---|---|
| Quadrant D | 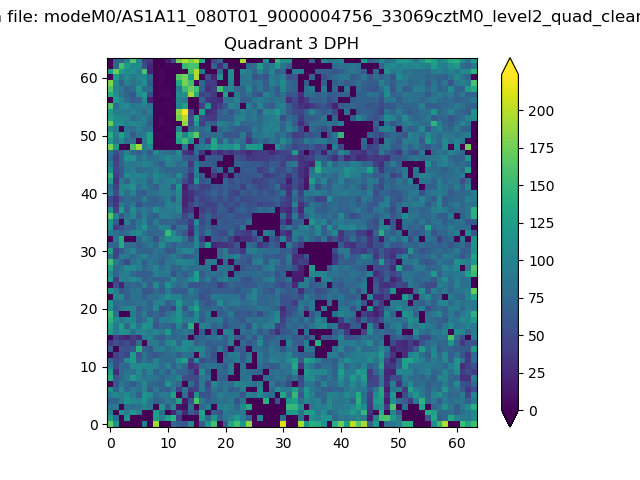 |
 |
Quadrant C |
| Plot type | Count rate plots | Images |
|---|---|---|
| Comparison with Poisson distribution Blue bars denote a histogram of data divided into 1 sec bins. Red curve is a Poisson curve with rate = median count rate of data. |
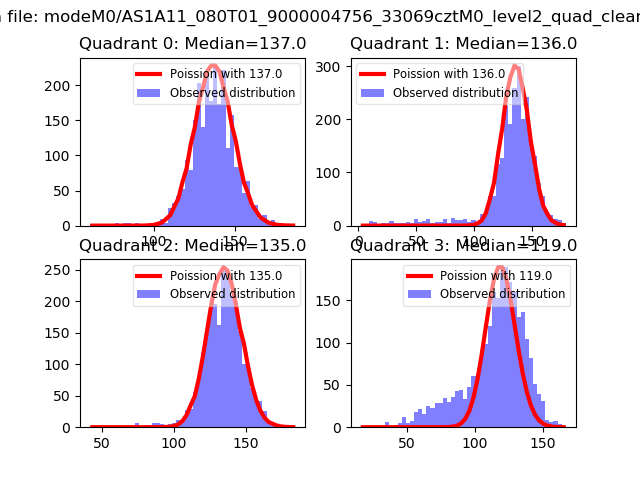 |
 |
| Quadrant-wise count rates Data is divided into 100 sec bins |
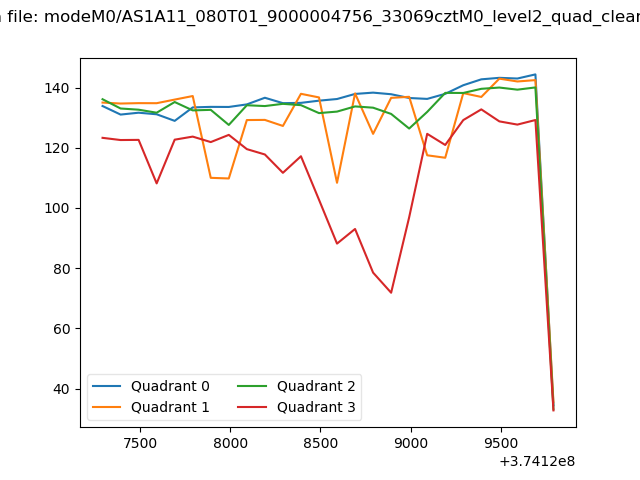 |
|
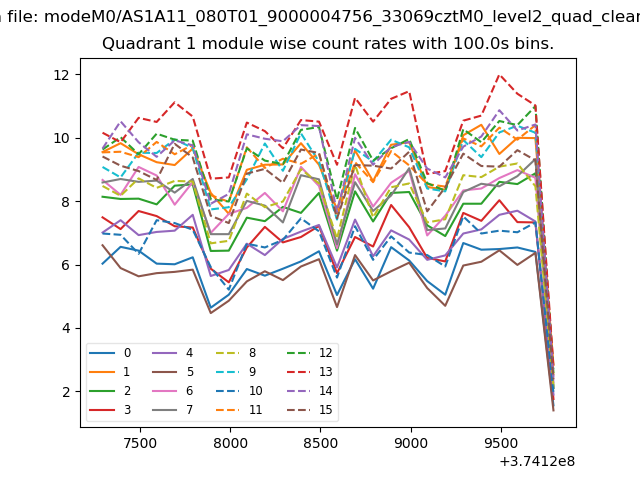
| Module-wise count rates for Quadrant A Data is divided into 100 sec bins |
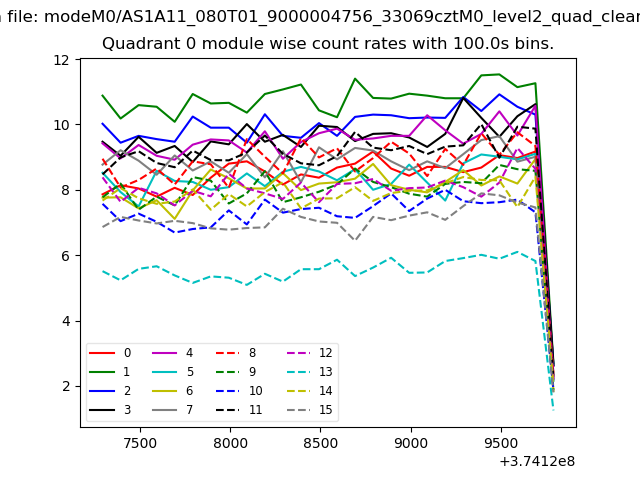 |
 |
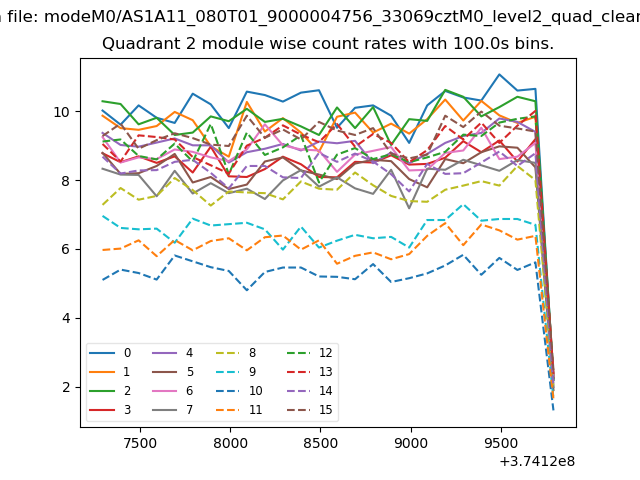
| Module-wise count rates for Quadrant B Data is divided into 100 sec bins |
 |
 |
| Module-wise count rates for Quadrant C Data is divided into 100 sec bins |
 |
 |
| Module-wise count rates for Quadrant D Data is divided into 100 sec bins |
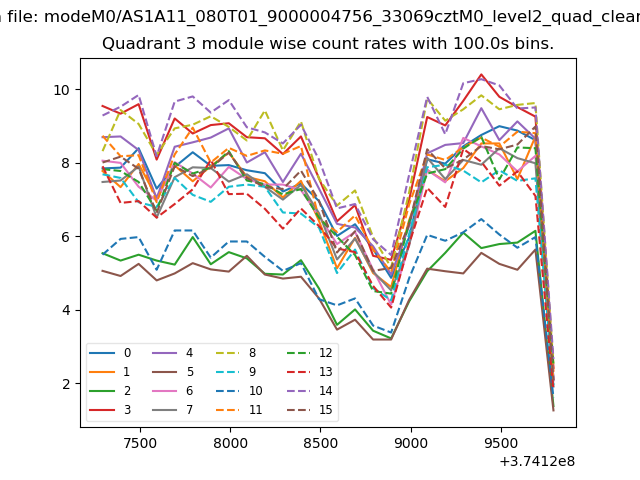 |
 |
| Parameter | Plot |
|---|---|
| CZT HV Monitor | 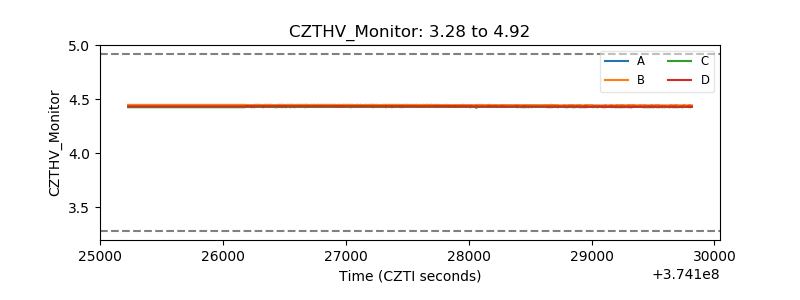 |
| D_VDD | 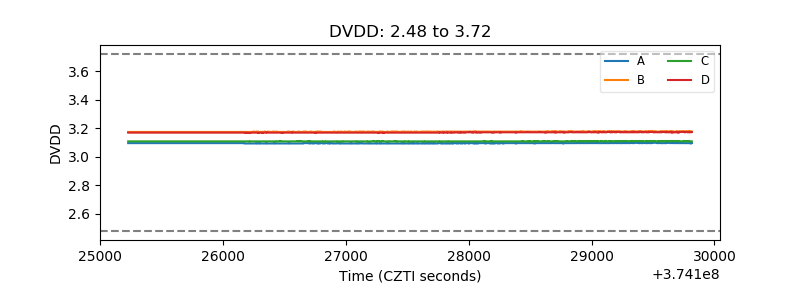 |
| Temperature 1 | 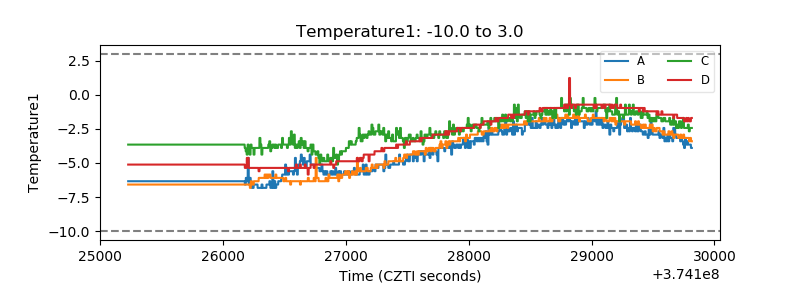 |
| Veto HV Monitor | 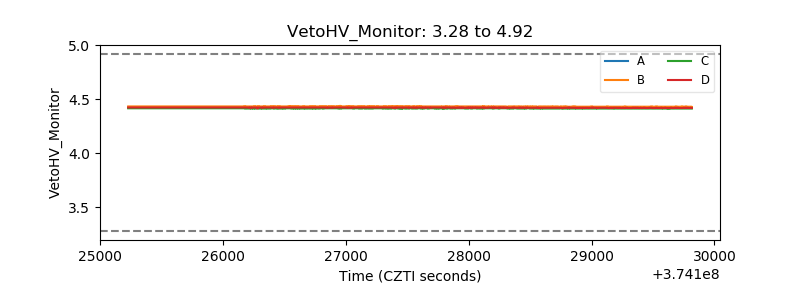 |
| Veto LLD | 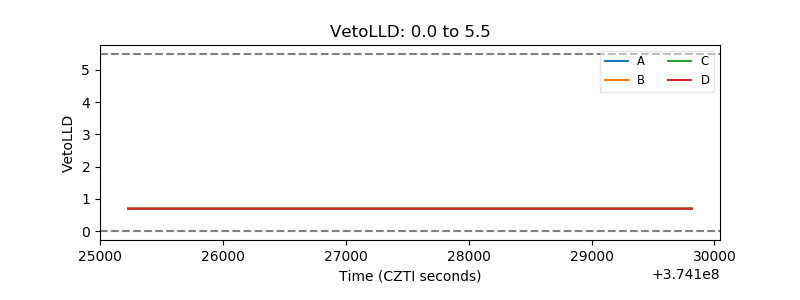 |
| Alpha Counter | 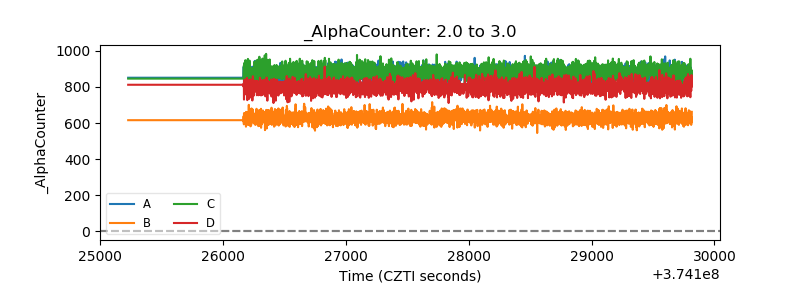 |
| _CPM_Rate | 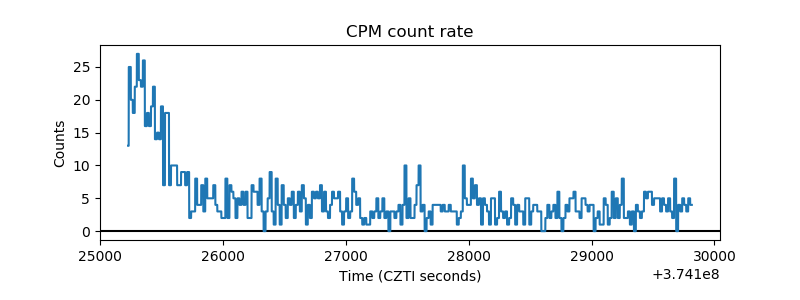 |
| CZT Counter | 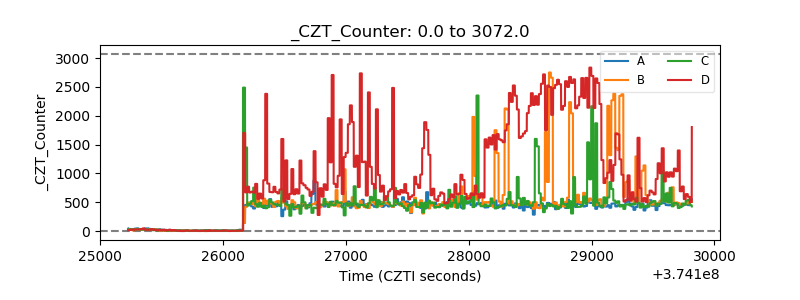 |
| +2.5 Volts monitor |  |
| +5 Volts monitor | 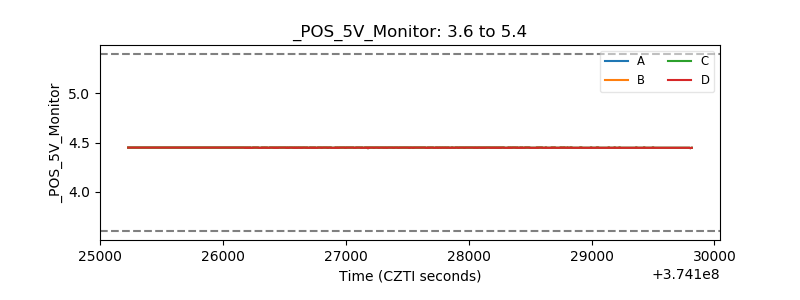 |
| _ROLL_ROT | 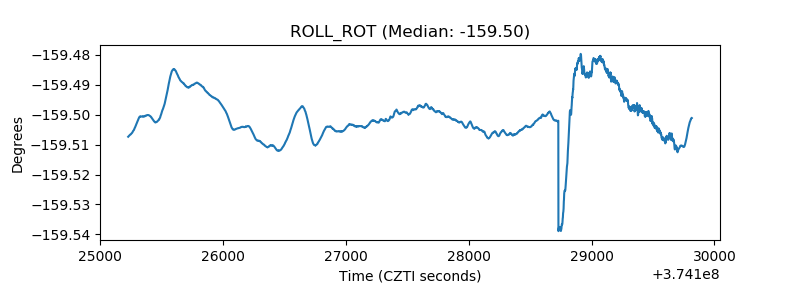 |
| _Roll_DEC | 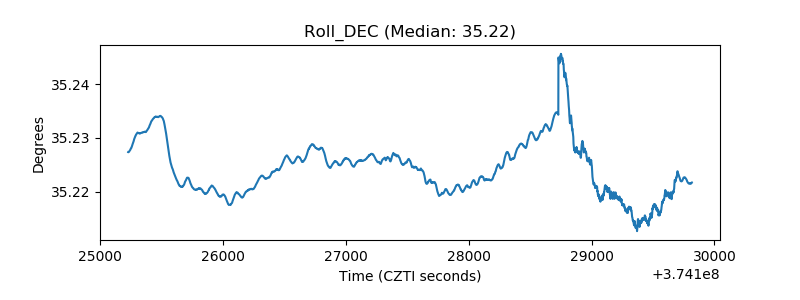 |
| _Roll_RA | 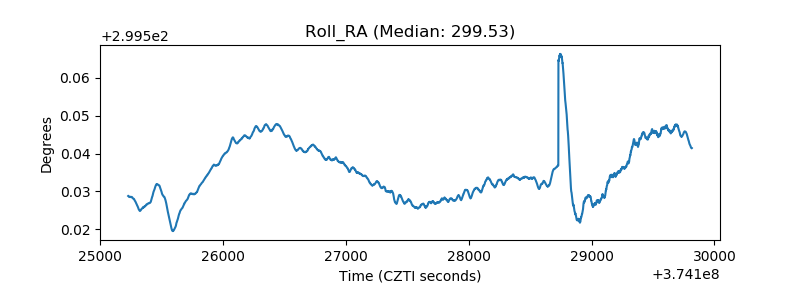 |
| Veto Counter | 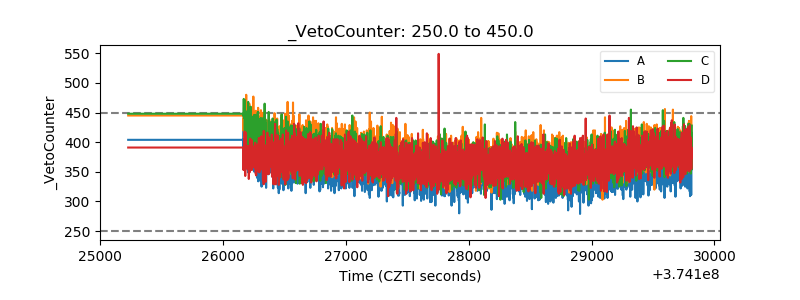 |