| Param | Original file | Final file |
|---|---|---|
| Filename | modeM0/AS1A11_007T07_9000004758cztM0_level2.fits | modeM0/AS1A11_007T07_9000004758cztM0_level2_quad_clean.evt |
| Size (bytes) | 537,742,080 | 452,252,160 |
| Size | 512.8 MB | 431.3 MB |
| Events in quadrant A | 3,542,832 | 3,036,660 |
| Events in quadrant B | 3,234,504 | 2,807,175 |
| Events in quadrant C | 3,317,110 | 2,717,472 |
| Events in quadrant D | 2,130,346 | 1,087,856 |
| Mode SS | |||
|---|---|---|---|
| Quadrant | BADHDUFLAG | Total packets | Discarded packets |
| A | 0 | 1202 | 0 |
| B | 0 | 1202 | 0 |
| C | 0 | 1202 | 0 |
| D | 0 | 1202 | 0 |
| Mode M0 | |||
|---|---|---|---|
| Quadrant | BADHDUFLAG | Total packets | Discarded packets |
| A | 0 | 119548 | 0 |
| B | 0 | 156935 | 0 |
| C | 0 | 162397 | 0 |
| D | 0 | 349158 | 0 |
| Mode M9 | |||
|---|---|---|---|
| Quadrant | BADHDUFLAG | Total packets | Discarded packets |
| A | 0 | 226 | 0 |
| B | 0 | 226 | 0 |
| C | 0 | 226 | 0 |
| D | 0 | 226 | 0 |
| Quadrant | Total seconds | Saturated seconds | Saturation percentage |
|---|---|---|---|
| A | 58975 | 53 | 0.089869% |
| B | 58975 | 3942 | 6.684188% |
| C | 58975 | 3360 | 5.697329% |
| D | 58975 | 28187 | 47.794828% |
Noise dominated data is calculated using 1-second bins in cleaned event files. If a bin has >2000 counts, and if more than 50% of those come from <1% of pixels, then it is considered to be noise-dominated and hence unusable.
| Quadrant | # 1 sec bins | Bins with >0 counts | Bins with >2000 counts | High rate bins dominated by noise | Noise dominated (total time) | Noise dominated (detector-on time) | Marked lightcurve |
|---|---|---|---|---|---|---|---|
| A | 81441 | 58975 | 0 | 0 | 0.00% | 0.00% |  |
| B | 81441 | 58888 | 0 | 0 | 0.00% | 0.00% |  |
| C | 81441 | 58970 | 0 | 0 | 0.00% | 0.00% |  |
| D | 81441 | 58668 | 0 | 0 | 0.00% | 0.00% | 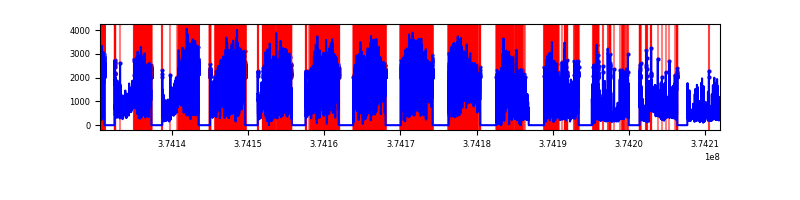 |
Top three noisy pixels from each quadrant. If the there are fewer than three noisy pixels in the level2.evt file, extra rows are filled as -1
| Pixel properties | Quadrant properties | ||||||
|---|---|---|---|---|---|---|---|
| Quadrant | DetID | PixID | Counts | Sigma | Mean | Median | Sigma |
| A | 7 | 110 | 2929 | 9.13 | 924 | 869 | 225.7 |
| A | 0 | 29 | 2901 | 9.0 | 924 | 869 | 225.7 |
| A | 9 | 19 | 2803 | 8.57 | 924 | 869 | 225.7 |
| B | 2 | 9 | 2799 | 11.47 | 858 | 819 | 172.6 |
| B | 3 | 80 | 2539 | 9.97 | 858 | 819 | 172.6 |
| B | 2 | 8 | 2245 | 8.26 | 858 | 819 | 172.6 |
| C | 1 | 81 | 2836 | 8.99 | 878 | 828 | 223.3 |
| C | 1 | 80 | 2698 | 8.37 | 878 | 828 | 223.3 |
| C | 3 | 203 | 2655 | 8.18 | 878 | 828 | 223.3 |
| D | 6 | 67 | 1601 | 6.33 | 611 | 558 | 164.9 |
| D | 4 | 160 | 1595 | 6.29 | 611 | 558 | 164.9 |
| D | 7 | 3 | 1589 | 6.25 | 611 | 558 | 164.9 |
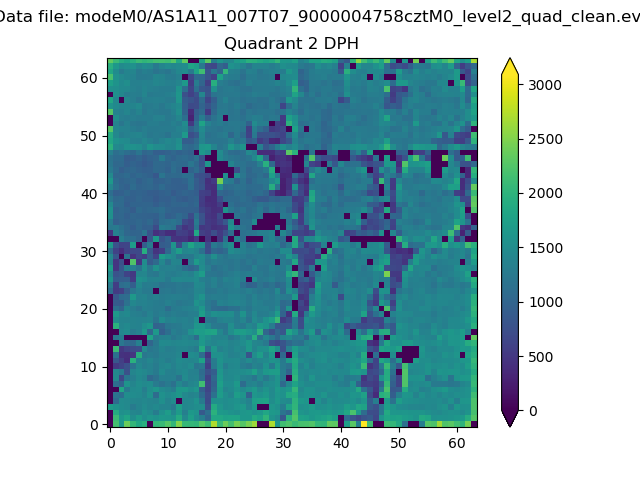
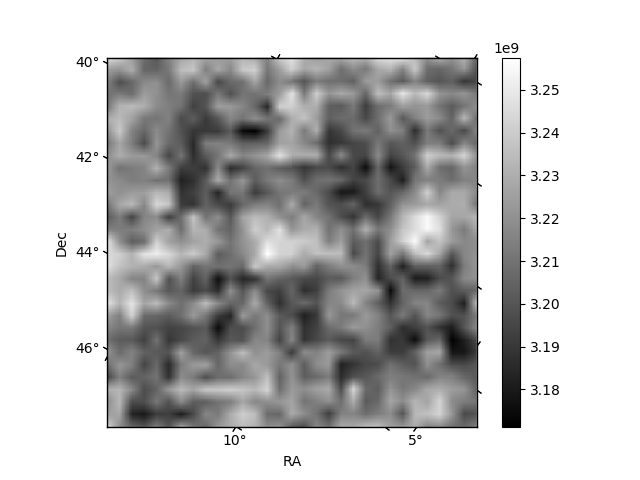
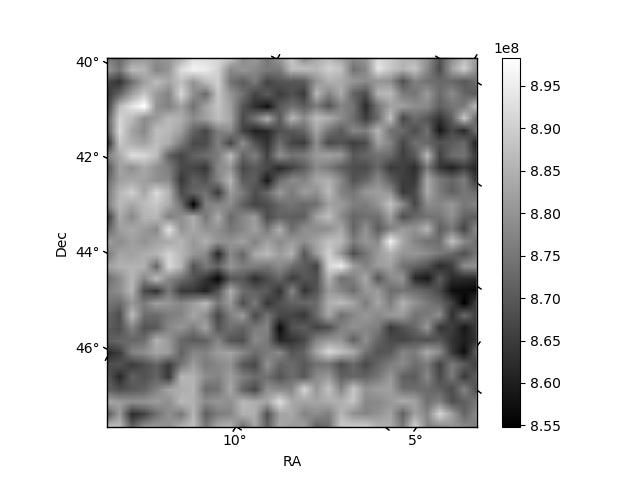
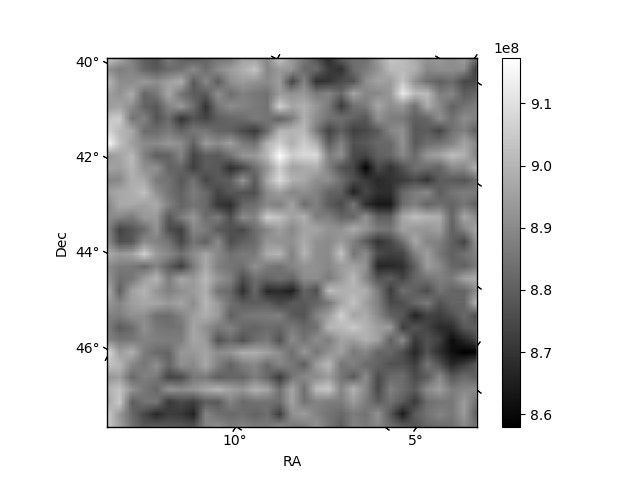
Histogram calculated using DETX and DETY for each event in the final _common_clean file
| Quadrant A |  |
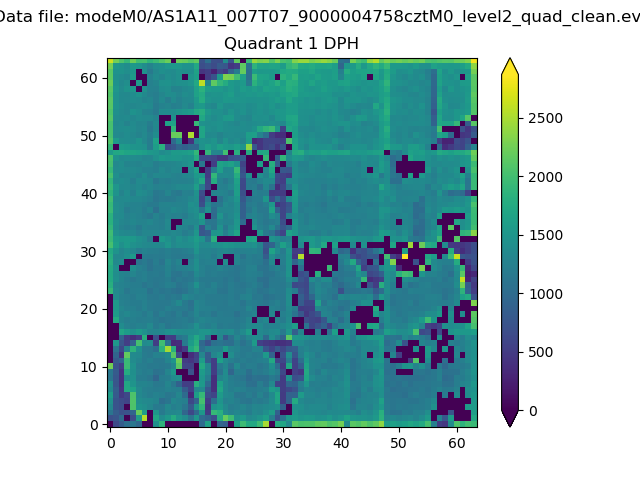 |
Quadrant B |
|---|---|---|---|
| Quadrant D | 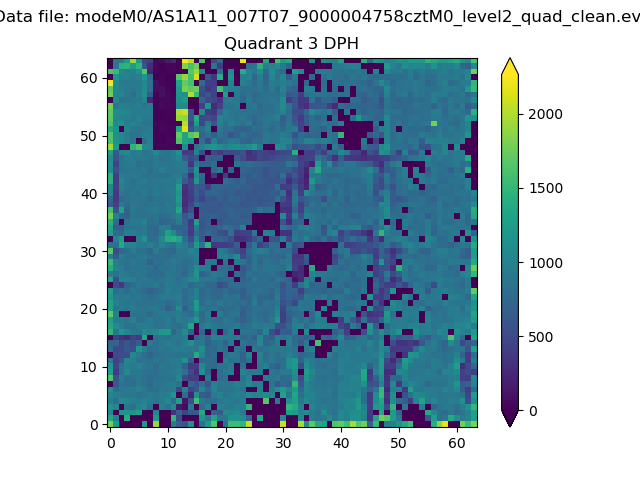 |
 |
Quadrant C |
| Plot type | Count rate plots | Images |
|---|---|---|
| Comparison with Poisson distribution Blue bars denote a histogram of data divided into 1 sec bins. Red curve is a Poisson curve with rate = median count rate of data. |
 |
 |
| Quadrant-wise count rates Data is divided into 100 sec bins |
 |
|
| Module-wise count rates for Quadrant A Data is divided into 100 sec bins |
 |
 |
| Module-wise count rates for Quadrant B Data is divided into 100 sec bins |
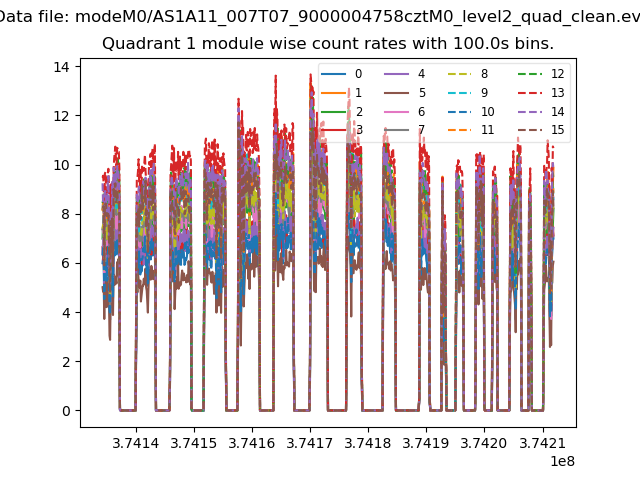 |
 |
| Module-wise count rates for Quadrant C Data is divided into 100 sec bins |
 |
 |
| Module-wise count rates for Quadrant D Data is divided into 100 sec bins |
 |
 |
| Parameter | Plot |
|---|---|
| CZT HV Monitor |  |
| D_VDD |  |
| Temperature 1 | 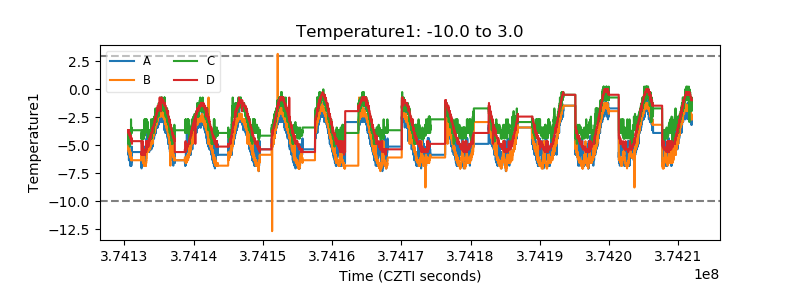 |
| Veto HV Monitor |  |
| Veto LLD |  |
| Alpha Counter | 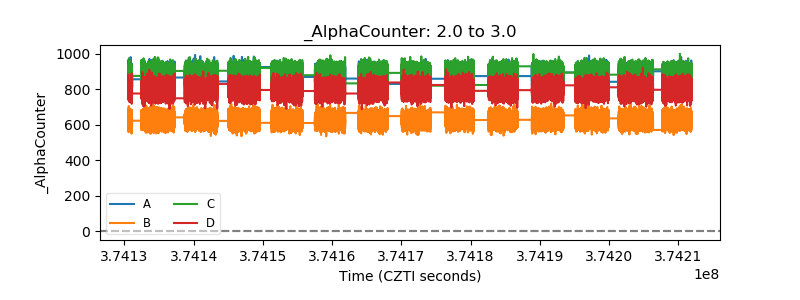 |
| _CPM_Rate | 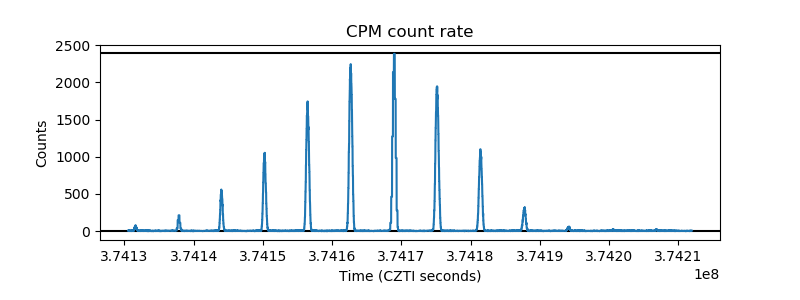 |
| CZT Counter |  |
| +2.5 Volts monitor |  |
| +5 Volts monitor | 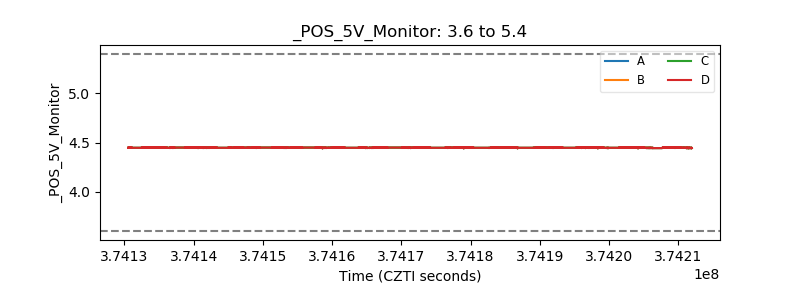 |
| _ROLL_ROT |  |
| _Roll_DEC |  |
| _Roll_RA | 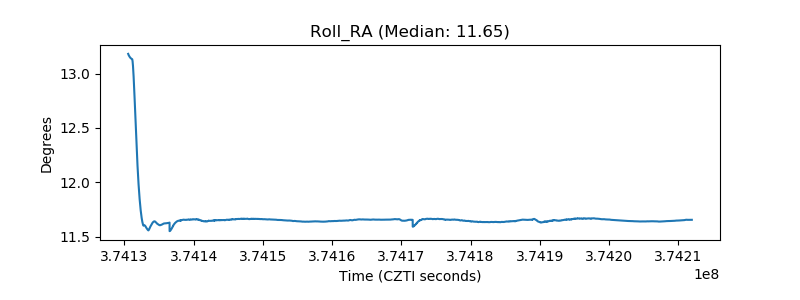 |
| Veto Counter | 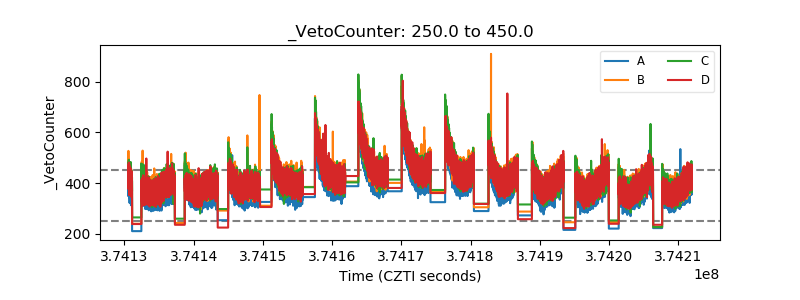 |