| Param | Original file | Final file |
|---|---|---|
| Filename | modeM0/AS1A11_007T07_9000004758_33070cztM0_level2.evt | modeM0/AS1A11_007T07_9000004758_33070cztM0_level2_quad_clean.evt |
| Size (bytes) | 967,777,920 | 104,688,000 |
| Size | 922.9 MB | 99.8 MB |
| Events in quadrant A | 3,758,518 | 728,330 |
| Events in quadrant B | 5,754,337 | 693,635 |
| Events in quadrant C | 4,973,993 | 716,014 |
| Events in quadrant D | 14,271,761 | 463,110 |
| Mode SS | |||
|---|---|---|---|
| Quadrant | BADHDUFLAG | Total packets | Discarded packets |
| A | 0 | 168 | 0 |
| B | 0 | 168 | 0 |
| C | 0 | 168 | 0 |
| D | 0 | 168 | 0 |
| Mode M0 | |||
|---|---|---|---|
| Quadrant | BADHDUFLAG | Total packets | Discarded packets |
| A | 0 | 16386 | 3 |
| B | 0 | 22105 | 2 |
| C | 0 | 19986 | 2 |
| D | 0 | 48202 | 2 |
| Mode M9 | |||
|---|---|---|---|
| Quadrant | BADHDUFLAG | Total packets | Discarded packets |
| A | 0 | 29 | 0 |
| B | 0 | 29 | 0 |
| C | 0 | 29 | 0 |
| D | 0 | 29 | 0 |
| Quadrant | Total seconds | Saturated seconds | Saturation percentage |
|---|---|---|---|
| A | 8163 | 4 | 0.049002% |
| B | 8163 | 630 | 7.717751% |
| C | 8163 | 249 | 3.050349% |
| D | 8163 | 3631 | 44.481196% |
Noise dominated data is calculated using 1-second bins in cleaned event files. If a bin has >2000 counts, and if more than 50% of those come from <1% of pixels, then it is considered to be noise-dominated and hence unusable.
| Quadrant | # 1 sec bins | Bins with >0 counts | Bins with >2000 counts | High rate bins dominated by noise | Noise dominated (total time) | Noise dominated (detector-on time) | Marked lightcurve |
|---|---|---|---|---|---|---|---|
| A | 11119 | 8165 | 0 | 0 | 0.00% | 0.00% | 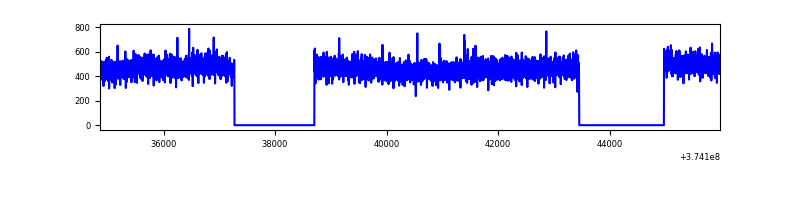 |
| B | 11119 | 8165 | 442 | 442 | 3.98% | 5.41% | 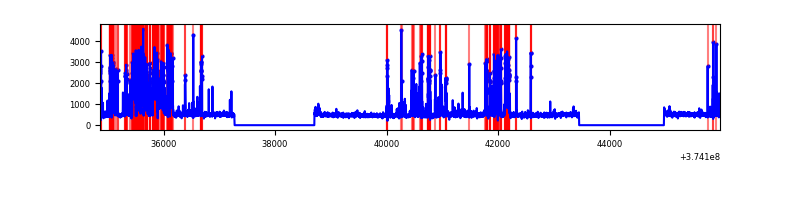 |
| C | 11119 | 8165 | 189 | 189 | 1.70% | 2.31% | 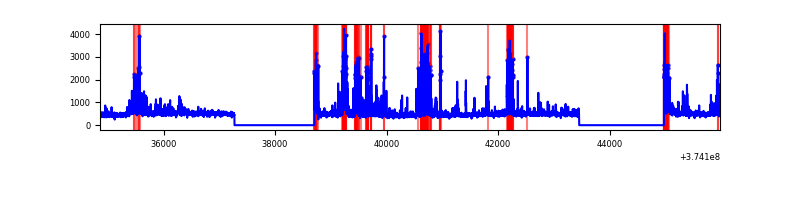 |
| D | 11119 | 8165 | 3540 | 3540 | 31.84% | 43.36% | 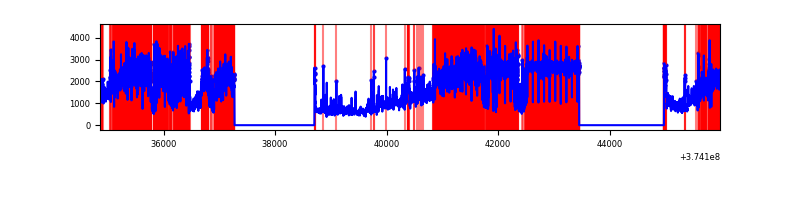 |
Top three noisy pixels from each quadrant. If the there are fewer than three noisy pixels in the level2.evt file, extra rows are filled as -1
| Pixel properties | Quadrant properties | ||||||
|---|---|---|---|---|---|---|---|
| Quadrant | DetID | PixID | Counts | Sigma | Mean | Median | Sigma |
| A | 13 | 254 | 15439 | 74.33 | 969 | 950 | 194.9 |
| A | 3 | 137 | 9177 | 42.2 | 969 | 950 | 194.9 |
| A | 0 | 226 | 8436 | 38.4 | 969 | 950 | 194.9 |
| B | 5 | 172 | 1823392 | 10105.18 | 936 | 911 | 180.4 |
| B | 0 | 189 | 75854 | 415.54 | 936 | 911 | 180.4 |
| B | 15 | 85 | 47607 | 258.92 | 936 | 911 | 180.4 |
| C | 8 | 111 | 742482 | 3411.93 | 935 | 942 | 217.3 |
| C | 0 | 207 | 208549 | 955.23 | 935 | 942 | 217.3 |
| C | 0 | 10 | 162417 | 742.97 | 935 | 942 | 217.3 |
| D | 7 | 223 | 8091853 | 40134.67 | 762 | 746 | 201.6 |
| D | 8 | 195 | 1165350 | 5776.84 | 762 | 746 | 201.6 |
| D | 12 | 218 | 954598 | 4731.43 | 762 | 746 | 201.6 |
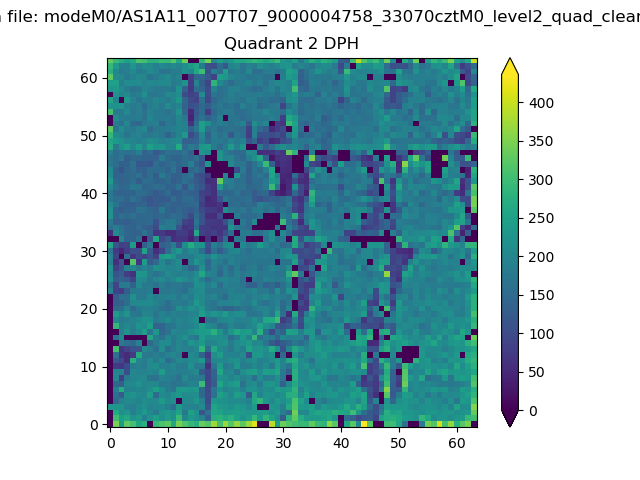
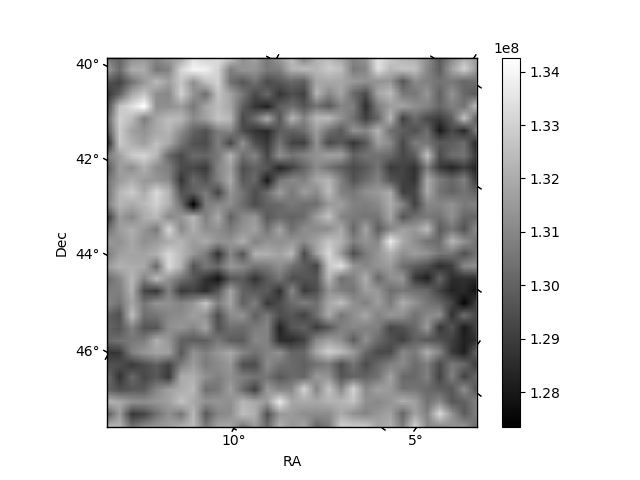
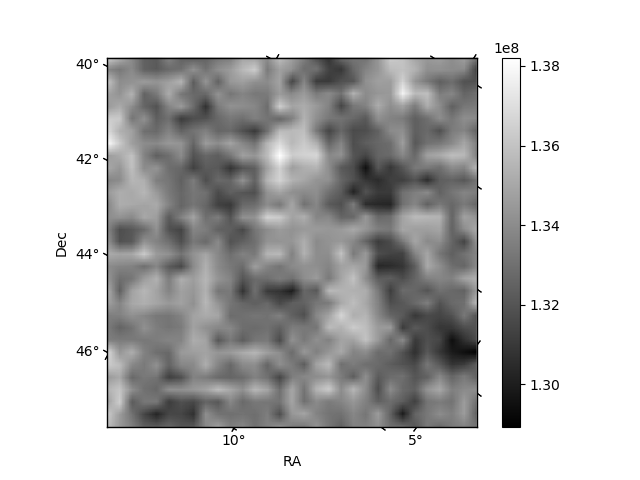
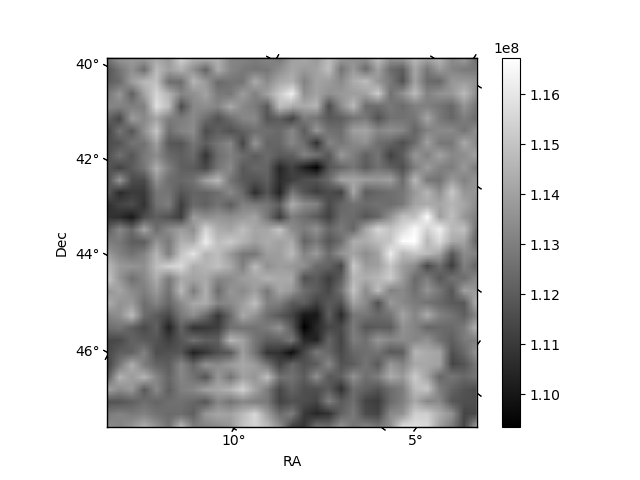
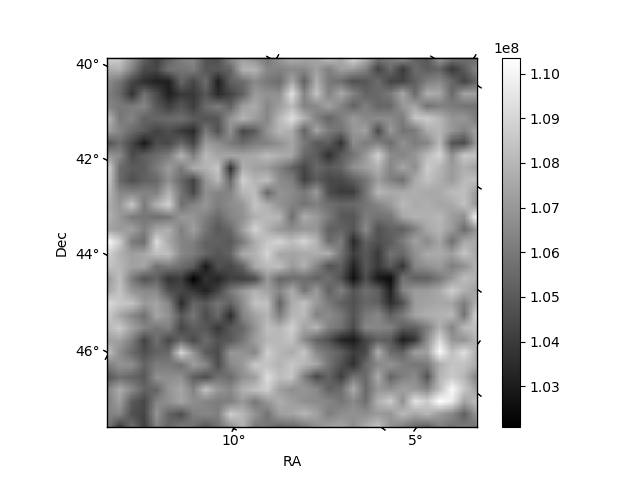
Histogram calculated using DETX and DETY for each event in the final _common_clean file
| Quadrant A | 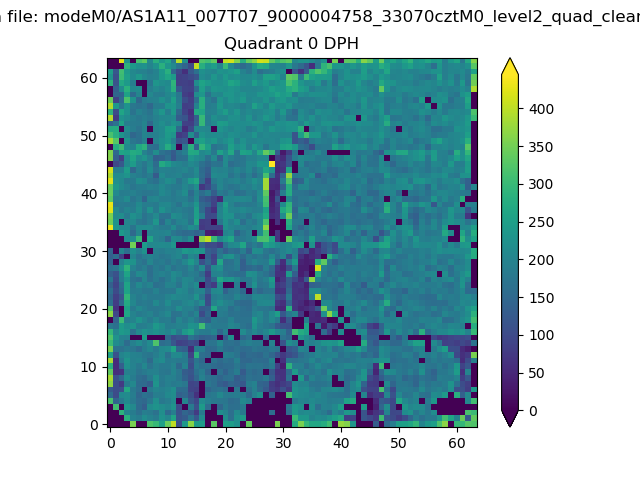 |
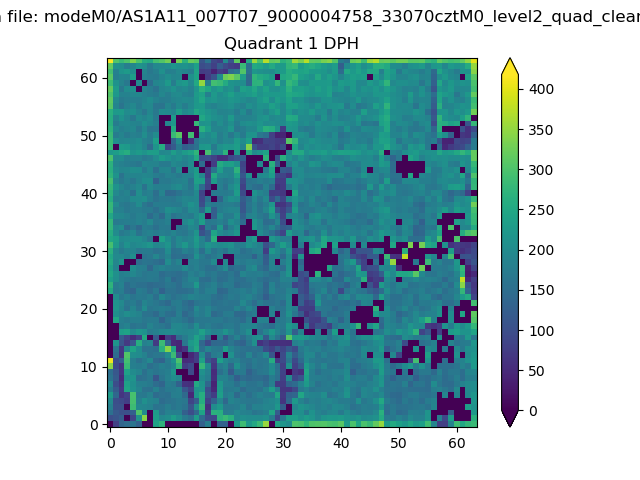 |
Quadrant B |
|---|---|---|---|
| Quadrant D | 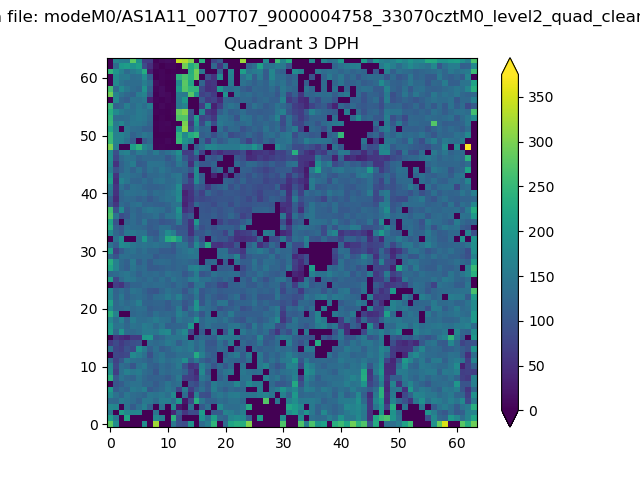 |
 |
Quadrant C |
| Plot type | Count rate plots | Images |
|---|---|---|
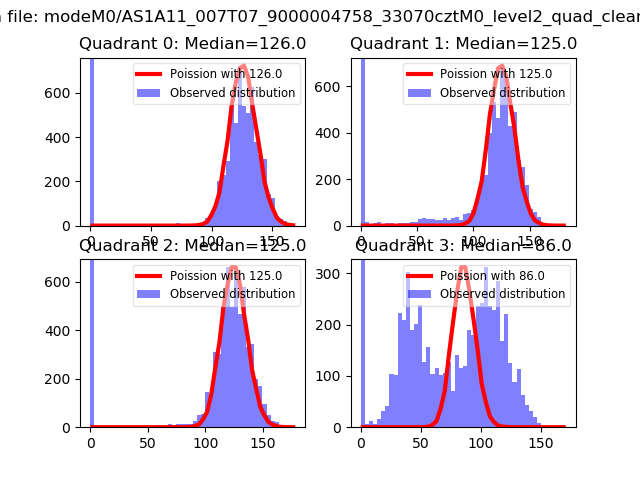
| Comparison with Poisson distribution Blue bars denote a histogram of data divided into 1 sec bins. Red curve is a Poisson curve with rate = median count rate of data. |
 |
 |
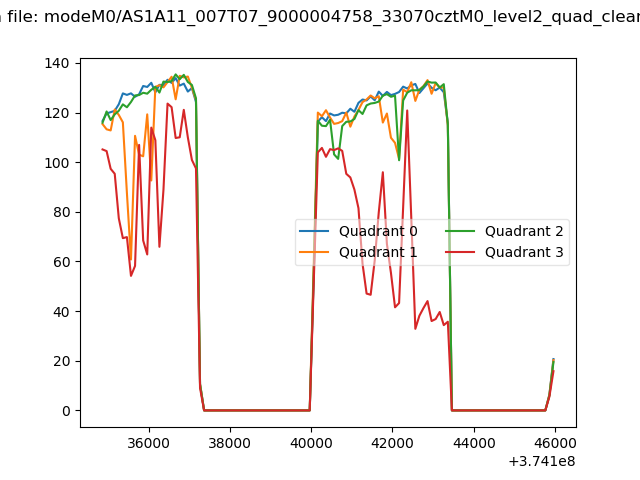
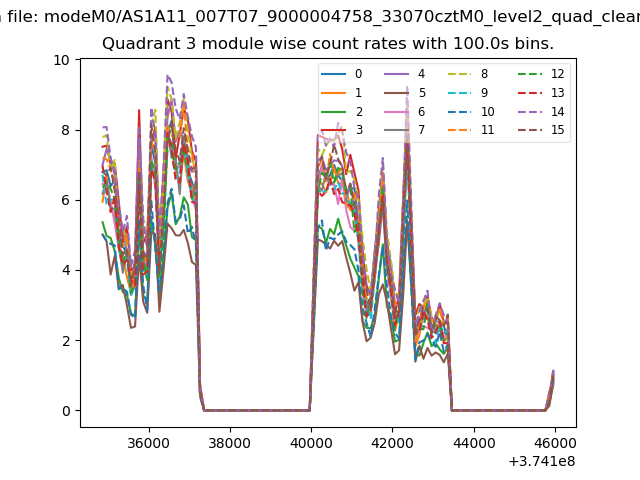
| Quadrant-wise count rates Data is divided into 100 sec bins |
 |
|
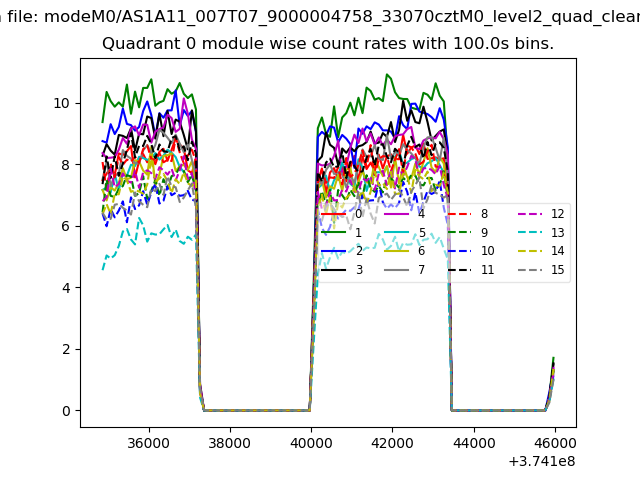
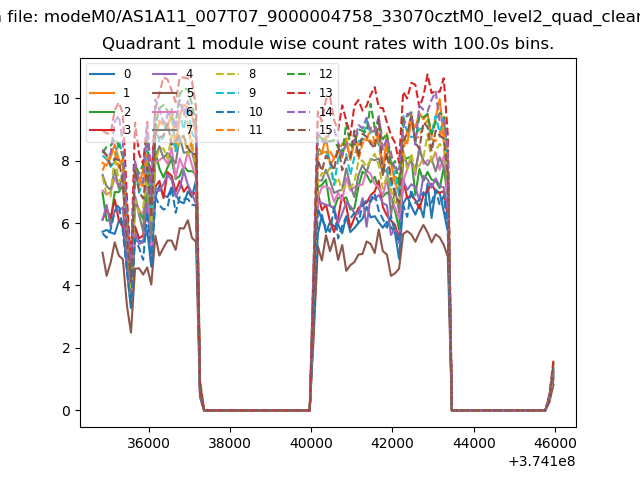
| Module-wise count rates for Quadrant A Data is divided into 100 sec bins |
 |
 |
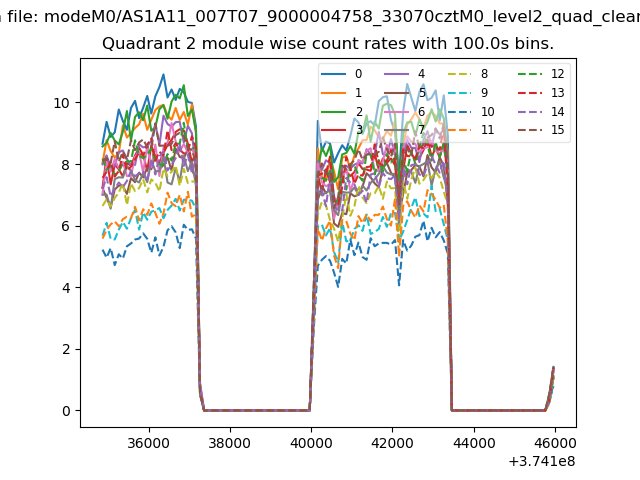
| Module-wise count rates for Quadrant B Data is divided into 100 sec bins |
 |
 |
| Module-wise count rates for Quadrant C Data is divided into 100 sec bins |
 |
 |
| Module-wise count rates for Quadrant D Data is divided into 100 sec bins |
 |
 |
| Parameter | Plot |
|---|---|
| CZT HV Monitor | 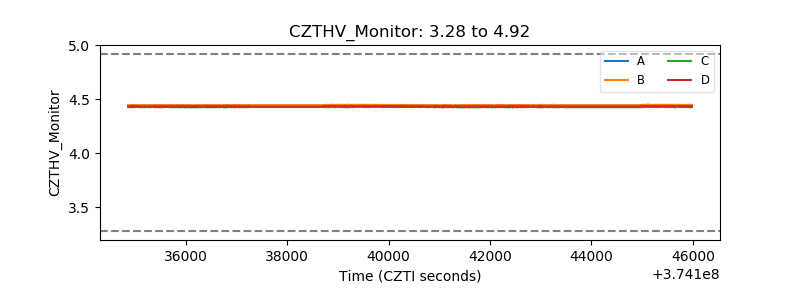 |
| D_VDD | 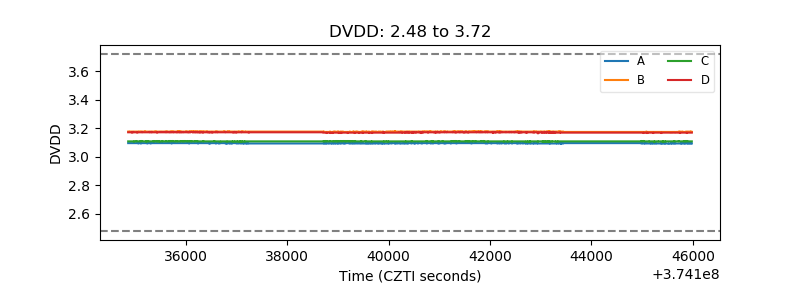 |
| Temperature 1 |  |
| Veto HV Monitor | 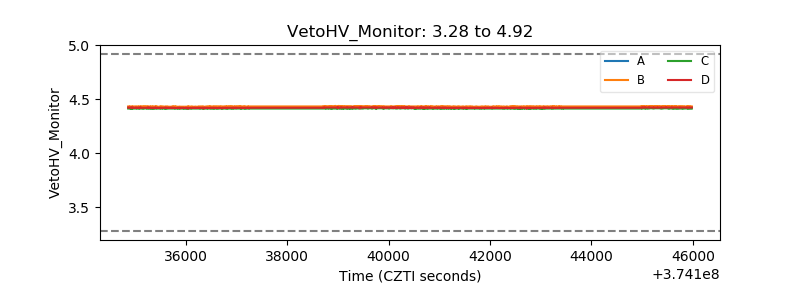 |
| Veto LLD | 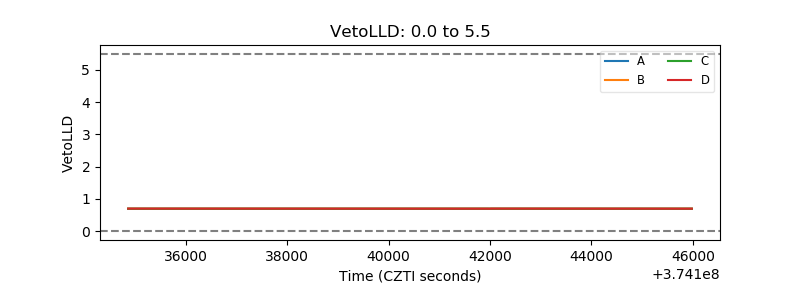 |
| Alpha Counter | 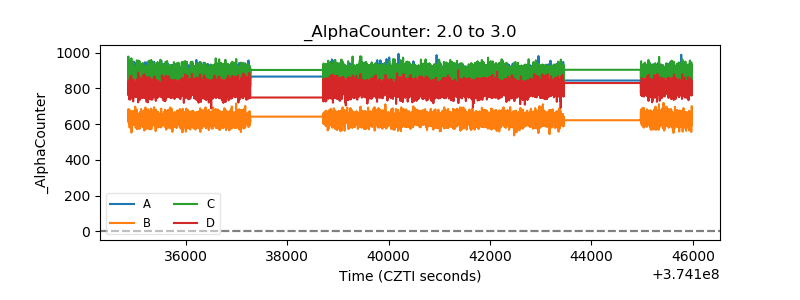 |
| _CPM_Rate | 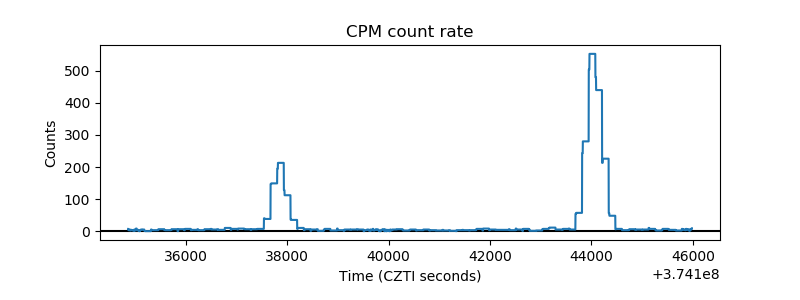 |
| CZT Counter | 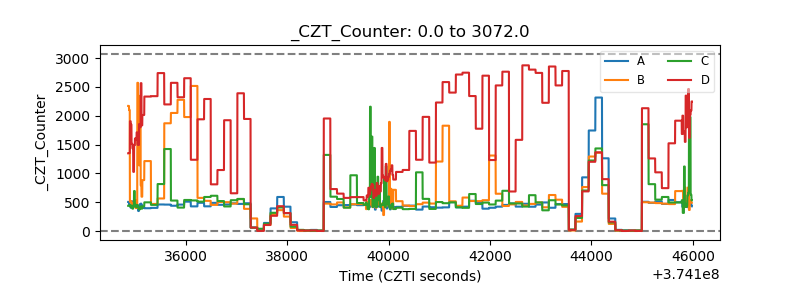 |
| +2.5 Volts monitor |  |
| +5 Volts monitor | 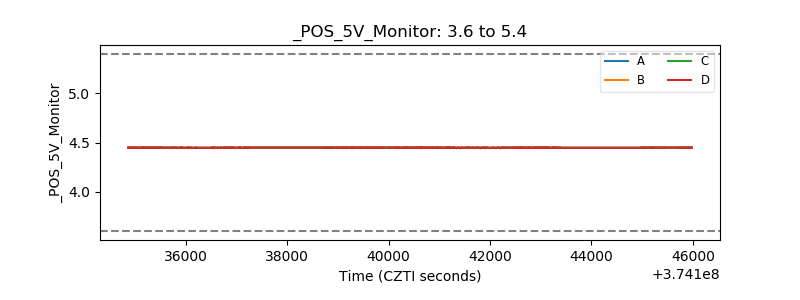 |
| _ROLL_ROT |  |
| _Roll_DEC |  |
| _Roll_RA | 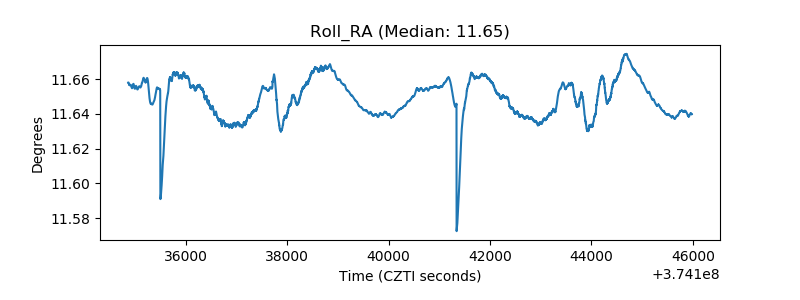 |
| Veto Counter | 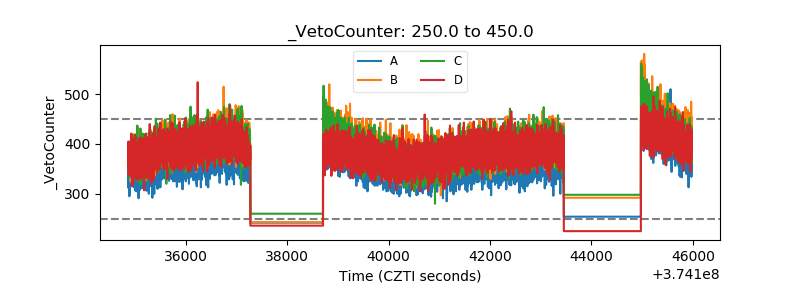 |