| Param | Original file | Final file |
|---|---|---|
| Filename | modeM0/AS1A11_007T07_9000004758_33071cztM0_level2.evt | modeM0/AS1A11_007T07_9000004758_33071cztM0_level2_quad_clean.evt |
| Size (bytes) | 754,911,360 | 74,998,080 |
| Size | 719.9 MB | 71.5 MB |
| Events in quadrant A | 2,700,875 | 540,341 |
| Events in quadrant B | 3,459,154 | 534,116 |
| Events in quadrant C | 4,440,885 | 509,279 |
| Events in quadrant D | 11,872,223 | 282,520 |
| Mode SS | |||
|---|---|---|---|
| Quadrant | BADHDUFLAG | Total packets | Discarded packets |
| A | 0 | 120 | 0 |
| B | 0 | 120 | 0 |
| C | 0 | 120 | 0 |
| D | 0 | 120 | 0 |
| Mode M0 | |||
|---|---|---|---|
| Quadrant | BADHDUFLAG | Total packets | Discarded packets |
| A | 0 | 11633 | 3 |
| B | 0 | 13741 | 2 |
| C | 0 | 16908 | 2 |
| D | 0 | 39274 | 2 |
| Mode M9 | |||
|---|---|---|---|
| Quadrant | BADHDUFLAG | Total packets | Discarded packets |
| A | 0 | 32 | 0 |
| B | 0 | 32 | 0 |
| C | 0 | 32 | 0 |
| D | 0 | 32 | 0 |
| Quadrant | Total seconds | Saturated seconds | Saturation percentage |
|---|---|---|---|
| A | 5758 | 6 | 0.104203% |
| B | 5758 | 153 | 2.657173% |
| C | 5758 | 488 | 8.475165% |
| D | 5758 | 3638 | 63.181660% |
Noise dominated data is calculated using 1-second bins in cleaned event files. If a bin has >2000 counts, and if more than 50% of those come from <1% of pixels, then it is considered to be noise-dominated and hence unusable.
| Quadrant | # 1 sec bins | Bins with >0 counts | Bins with >2000 counts | High rate bins dominated by noise | Noise dominated (total time) | Noise dominated (detector-on time) | Marked lightcurve |
|---|---|---|---|---|---|---|---|
| A | 8953 | 5760 | 0 | 0 | 0.00% | 0.00% | 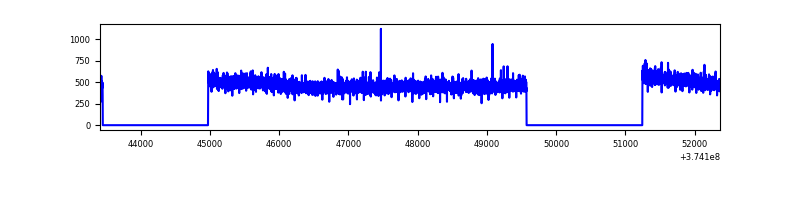 |
| B | 8953 | 5760 | 99 | 99 | 1.11% | 1.72% | 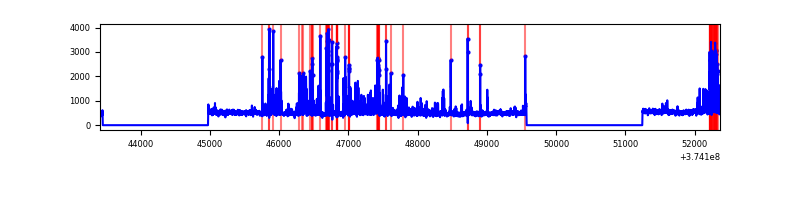 |
| C | 8953 | 5760 | 369 | 369 | 4.12% | 6.41% | 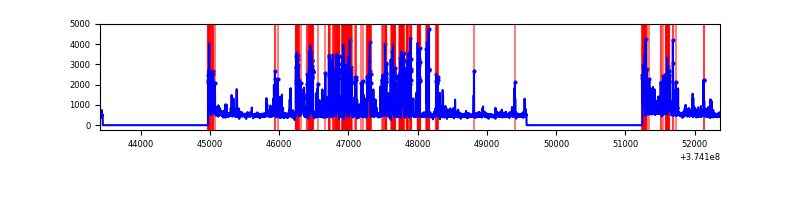 |
| D | 8953 | 5760 | 3541 | 3541 | 39.55% | 61.48% | 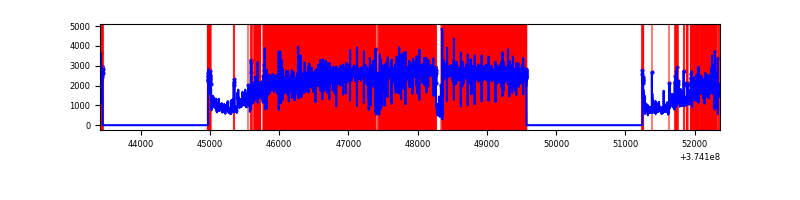 |
Top three noisy pixels from each quadrant. If the there are fewer than three noisy pixels in the level2.evt file, extra rows are filled as -1
| Pixel properties | Quadrant properties | ||||||
|---|---|---|---|---|---|---|---|
| Quadrant | DetID | PixID | Counts | Sigma | Mean | Median | Sigma |
| A | 13 | 254 | 11012 | 74.01 | 695 | 681 | 139.6 |
| A | 3 | 137 | 6516 | 41.8 | 695 | 681 | 139.6 |
| A | 0 | 226 | 5931 | 37.61 | 695 | 681 | 139.6 |
| B | 5 | 172 | 465708 | 3529.55 | 684 | 664 | 131.8 |
| B | 0 | 245 | 110888 | 836.57 | 684 | 664 | 131.8 |
| B | 0 | 189 | 68213 | 512.67 | 684 | 664 | 131.8 |
| C | 8 | 111 | 1271126 | 8447.17 | 649 | 655 | 150.4 |
| C | 7 | 221 | 327442 | 2172.76 | 649 | 655 | 150.4 |
| C | 0 | 10 | 198328 | 1314.3 | 649 | 655 | 150.4 |
| D | 7 | 223 | 8502056 | 64942.45 | 494 | 483 | 130.9 |
| D | 12 | 218 | 469391 | 3581.93 | 494 | 483 | 130.9 |
| D | 8 | 195 | 255256 | 1946.18 | 494 | 483 | 130.9 |
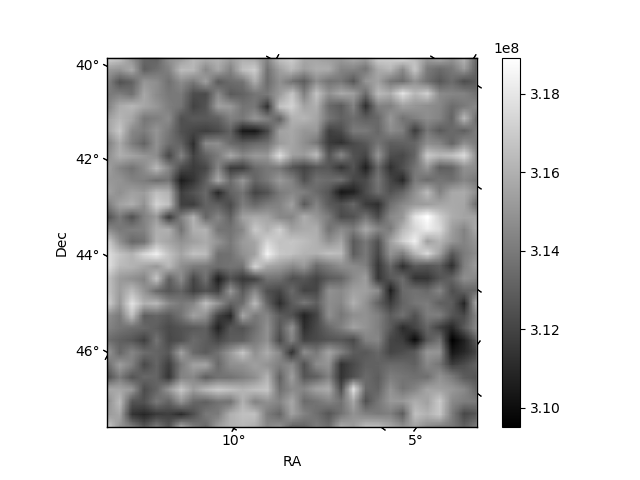
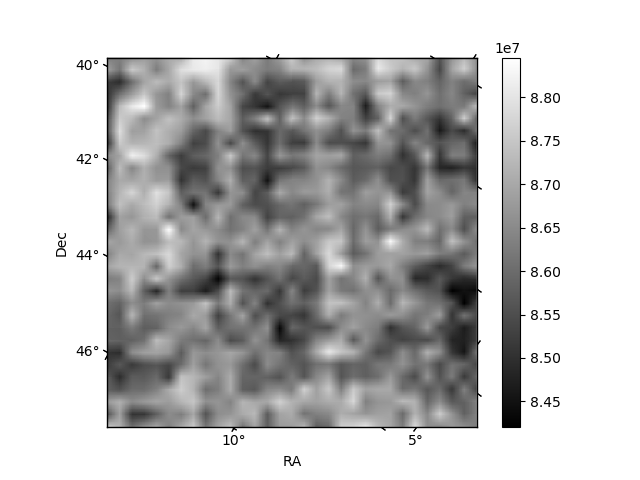
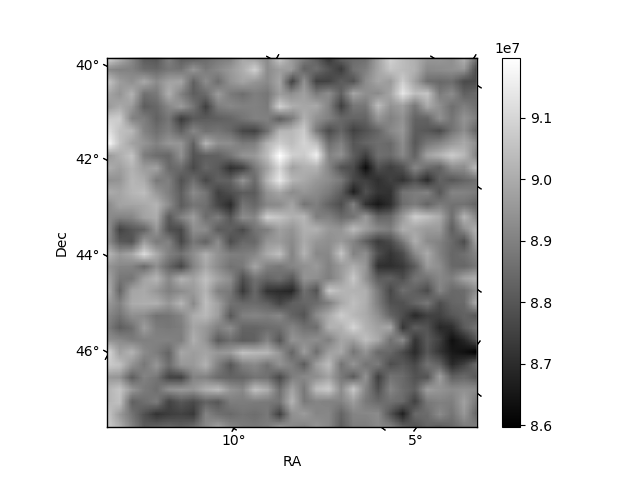
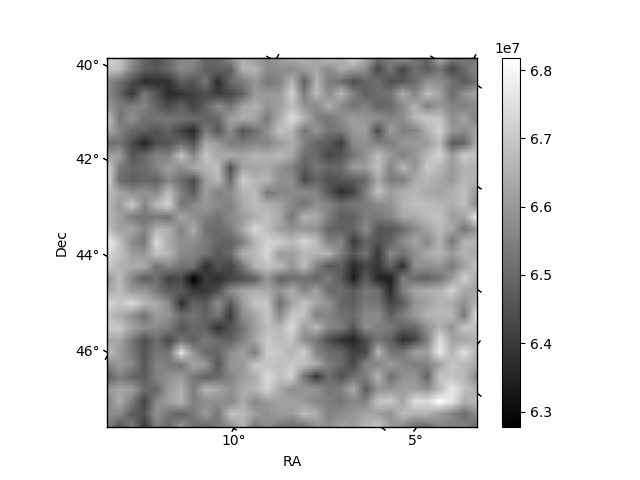
Histogram calculated using DETX and DETY for each event in the final _common_clean file
| Quadrant A | 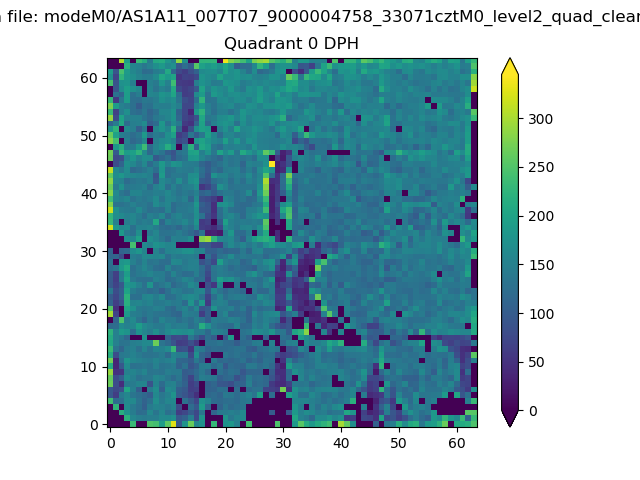 |
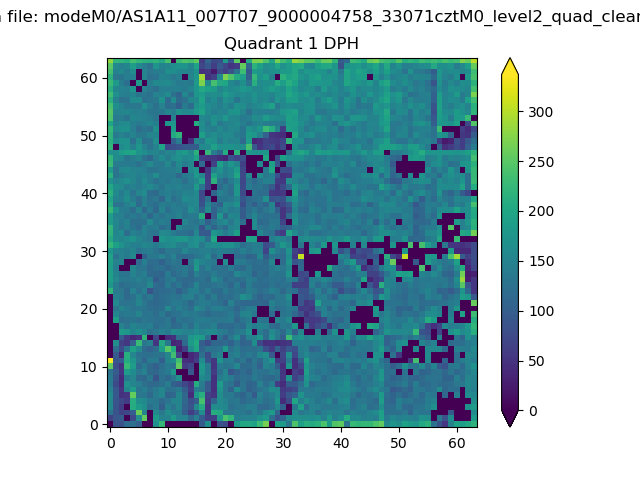 |
Quadrant B |
|---|---|---|---|
| Quadrant D | 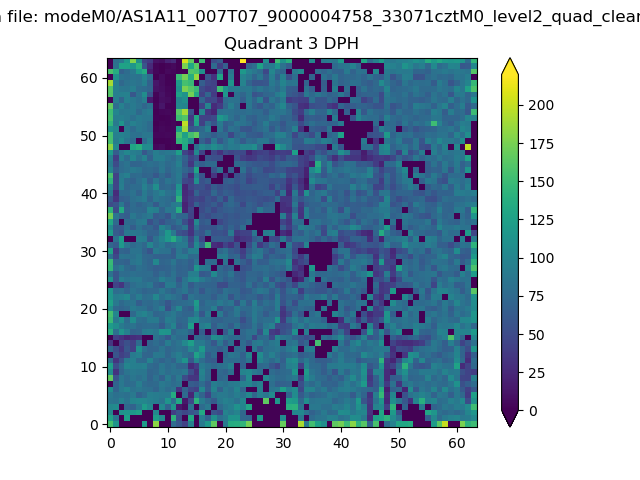 |
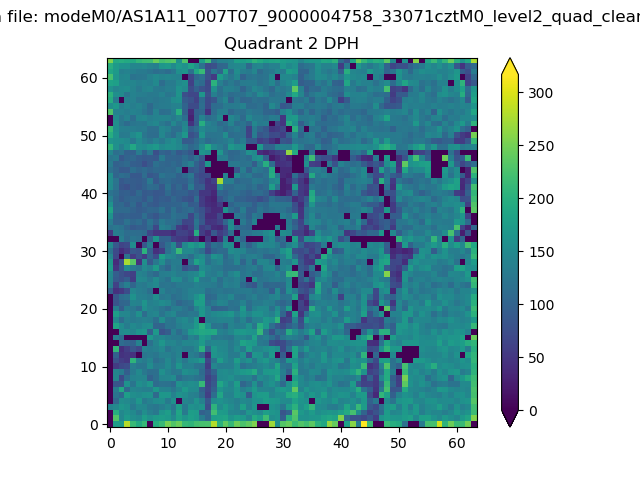 |
Quadrant C |
| Plot type | Count rate plots | Images |
|---|---|---|
| Comparison with Poisson distribution Blue bars denote a histogram of data divided into 1 sec bins. Red curve is a Poisson curve with rate = median count rate of data. |
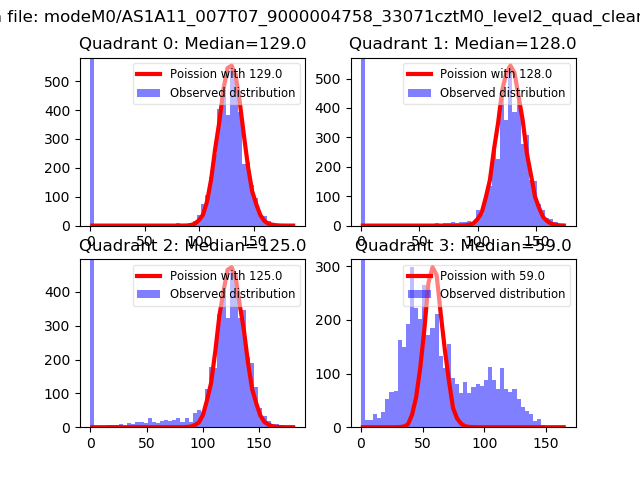 |
 |
| Quadrant-wise count rates Data is divided into 100 sec bins |
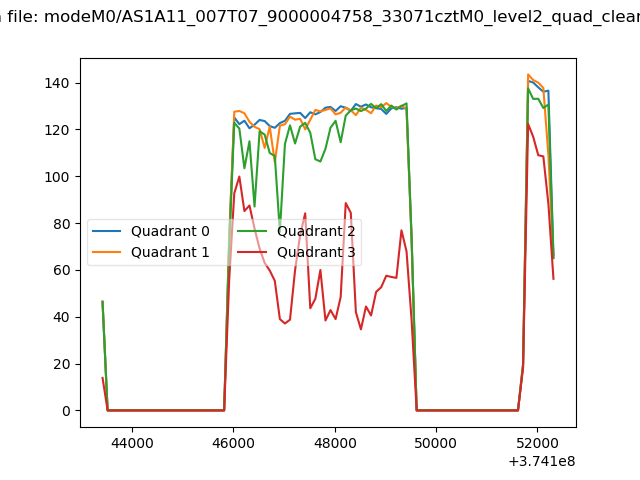 |
|
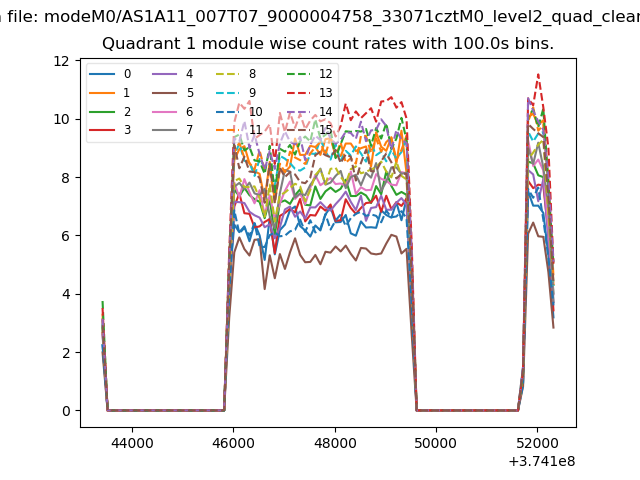
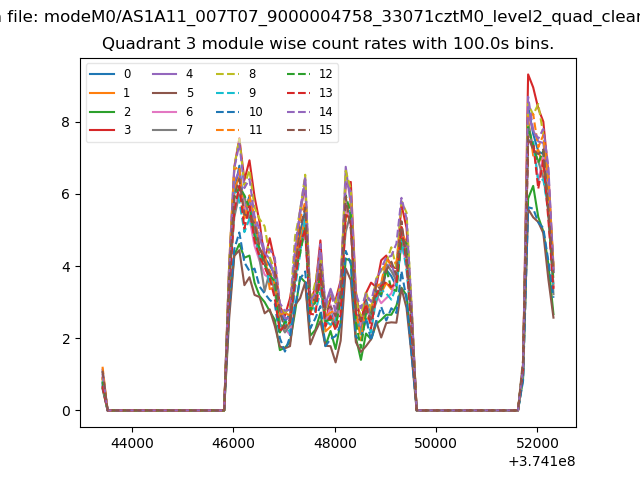
| Module-wise count rates for Quadrant A Data is divided into 100 sec bins |
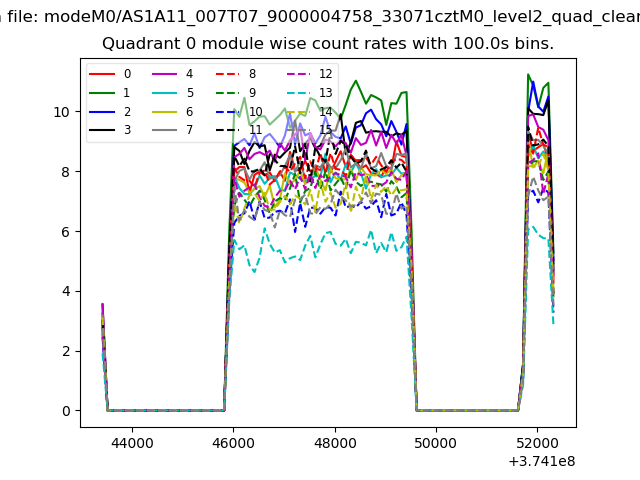 |
 |
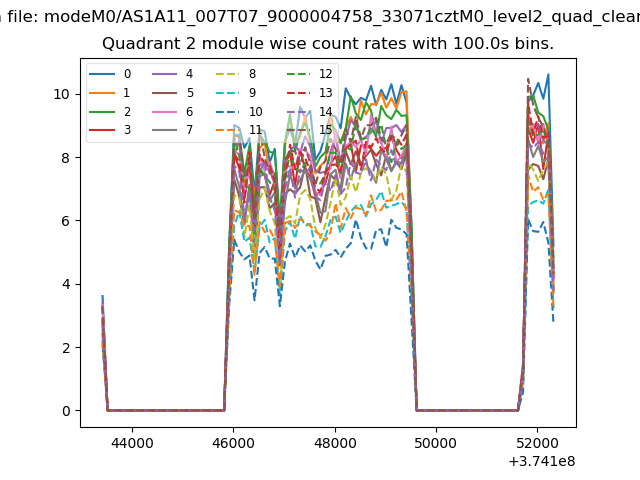
| Module-wise count rates for Quadrant B Data is divided into 100 sec bins |
 |
 |
| Module-wise count rates for Quadrant C Data is divided into 100 sec bins |
 |
 |
| Module-wise count rates for Quadrant D Data is divided into 100 sec bins |
 |
 |
| Parameter | Plot |
|---|---|
| CZT HV Monitor | 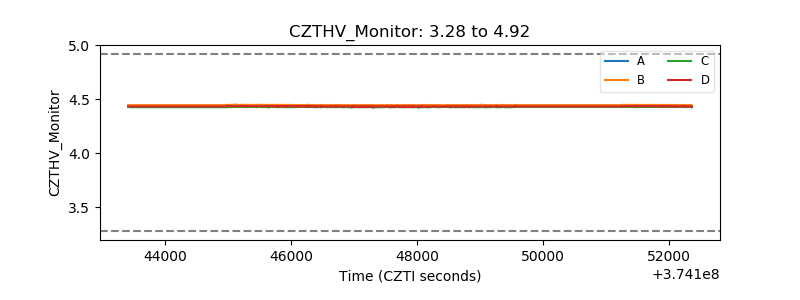 |
| D_VDD | 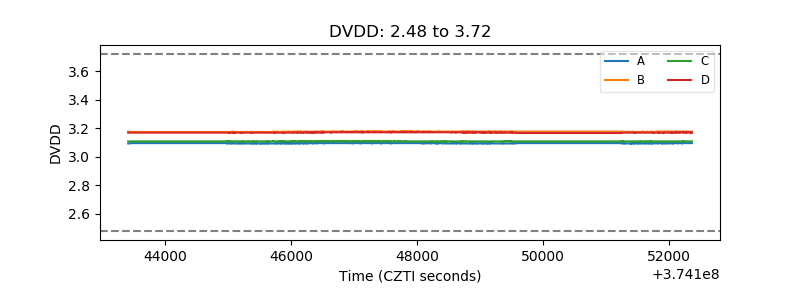 |
| Temperature 1 | 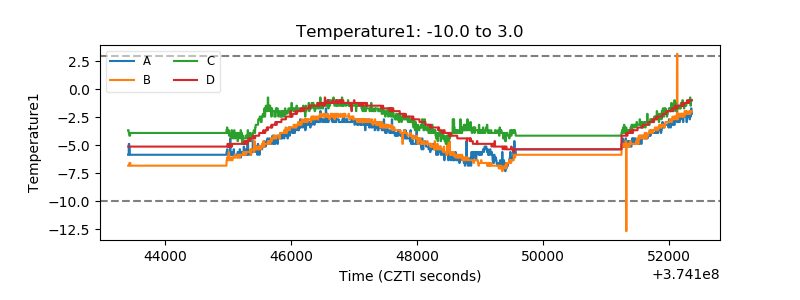 |
| Veto HV Monitor | 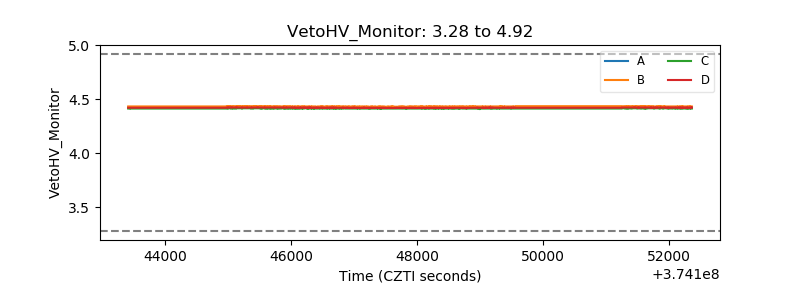 |
| Veto LLD |  |
| Alpha Counter | 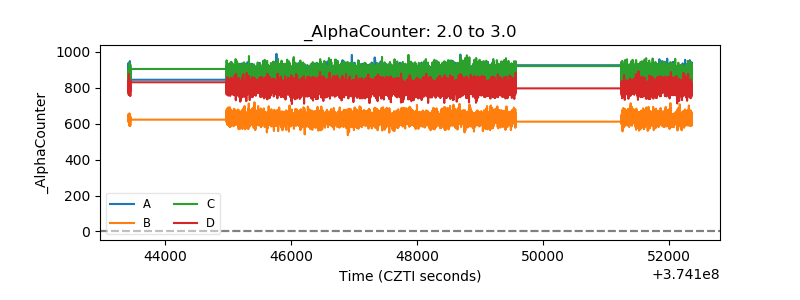 |
| _CPM_Rate | 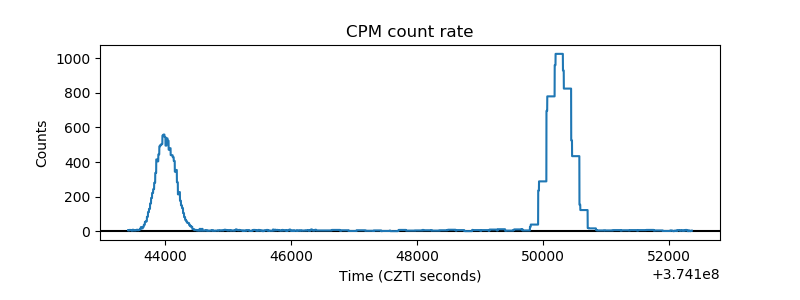 |
| CZT Counter | 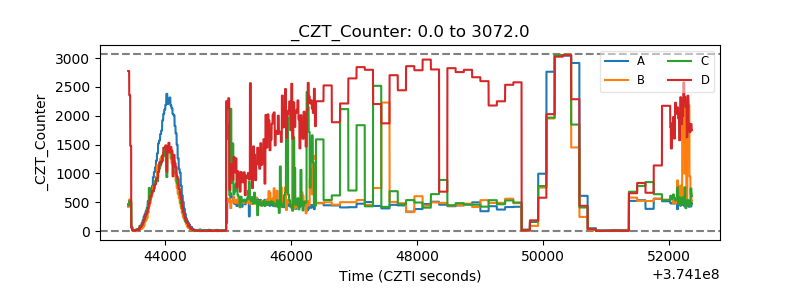 |
| +2.5 Volts monitor |  |
| +5 Volts monitor |  |
| _ROLL_ROT | 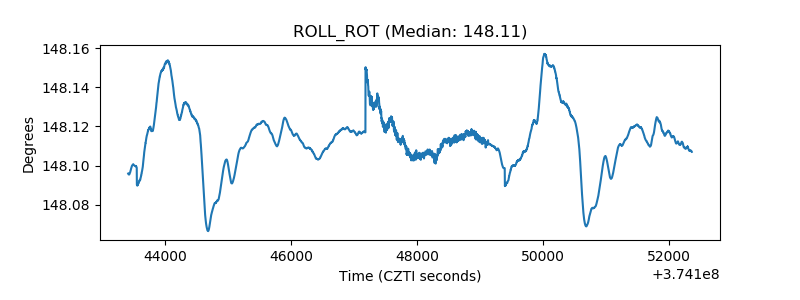 |
| _Roll_DEC | 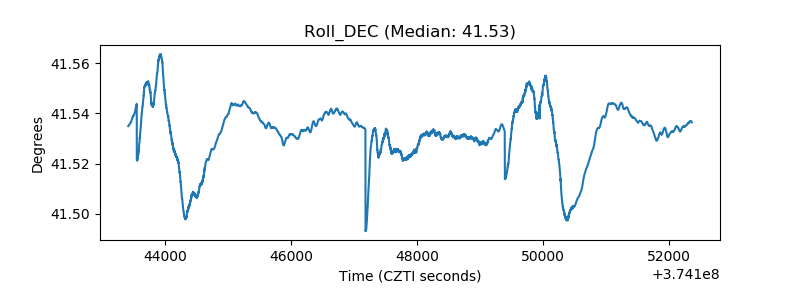 |
| _Roll_RA | 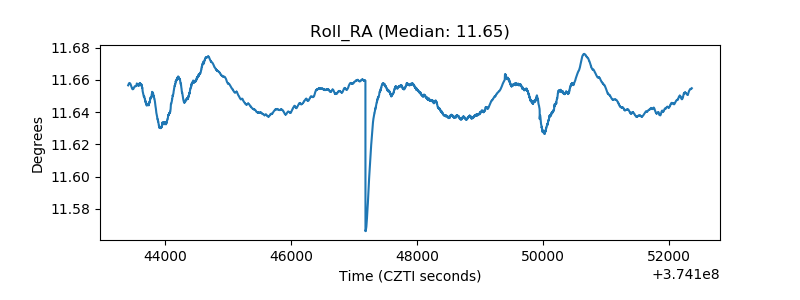 |
| Veto Counter | 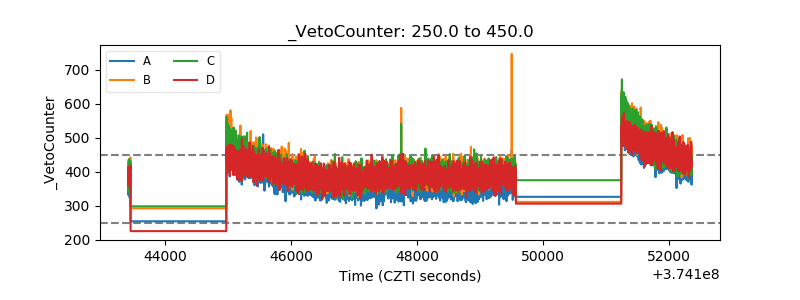 |