| Param | Original file | Final file |
|---|---|---|
| Filename | modeM0/AS1A11_007T07_9000004758_33073cztM0_level2.evt | modeM0/AS1A11_007T07_9000004758_33073cztM0_level2_quad_clean.evt |
| Size (bytes) | 734,797,440 | 86,639,040 |
| Size | 700.8 MB | 82.6 MB |
| Events in quadrant A | 2,691,868 | 642,681 |
| Events in quadrant B | 4,344,482 | 599,381 |
| Events in quadrant C | 3,856,206 | 617,496 |
| Events in quadrant D | 10,984,693 | 372,916 |
| Mode SS | |||
|---|---|---|---|
| Quadrant | BADHDUFLAG | Total packets | Discarded packets |
| A | 0 | 114 | 0 |
| B | 0 | 114 | 0 |
| C | 0 | 114 | 0 |
| D | 0 | 114 | 0 |
| Mode M0 | |||
|---|---|---|---|
| Quadrant | BADHDUFLAG | Total packets | Discarded packets |
| A | 0 | 11450 | 3 |
| B | 0 | 16448 | 2 |
| C | 0 | 14962 | 2 |
| D | 0 | 36493 | 2 |
| Mode M9 | |||
|---|---|---|---|
| Quadrant | BADHDUFLAG | Total packets | Discarded packets |
| A | 0 | 35 | 0 |
| B | 0 | 35 | 0 |
| C | 0 | 35 | 0 |
| D | 0 | 35 | 0 |
| Quadrant | Total seconds | Saturated seconds | Saturation percentage |
|---|---|---|---|
| A | 5573 | 9 | 0.161493% |
| B | 5573 | 524 | 9.402476% |
| C | 5573 | 263 | 4.719182% |
| D | 5573 | 3103 | 55.679167% |
Noise dominated data is calculated using 1-second bins in cleaned event files. If a bin has >2000 counts, and if more than 50% of those come from <1% of pixels, then it is considered to be noise-dominated and hence unusable.
| Quadrant | # 1 sec bins | Bins with >0 counts | Bins with >2000 counts | High rate bins dominated by noise | Noise dominated (total time) | Noise dominated (detector-on time) | Marked lightcurve |
|---|---|---|---|---|---|---|---|
| A | 9039 | 5575 | 0 | 0 | 0.00% | 0.00% | 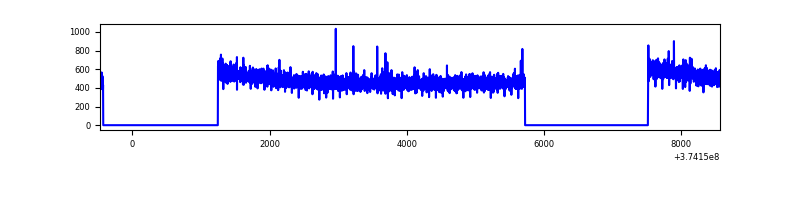 |
| B | 9039 | 5575 | 390 | 390 | 4.31% | 7.00% | 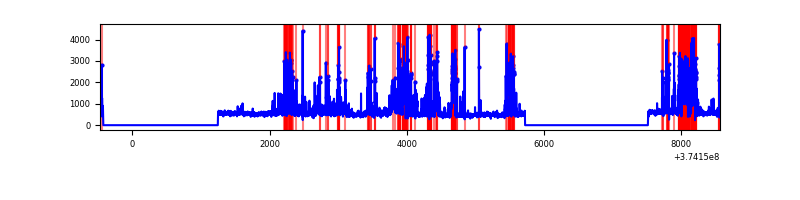 |
| C | 9039 | 5575 | 196 | 196 | 2.17% | 3.52% | 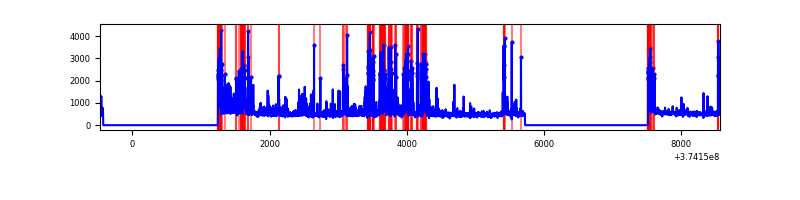 |
| D | 9039 | 5575 | 2909 | 2909 | 32.18% | 52.18% | 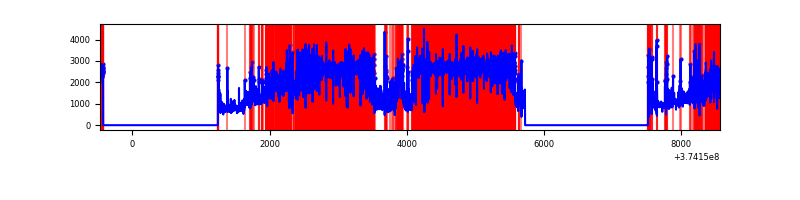 |
Top three noisy pixels from each quadrant. If the there are fewer than three noisy pixels in the level2.evt file, extra rows are filled as -1
| Pixel properties | Quadrant properties | ||||||
|---|---|---|---|---|---|---|---|
| Quadrant | DetID | PixID | Counts | Sigma | Mean | Median | Sigma |
| A | 13 | 254 | 9871 | 65.88 | 695 | 682 | 139.5 |
| A | 3 | 137 | 6139 | 39.12 | 695 | 682 | 139.5 |
| A | 0 | 226 | 6042 | 38.43 | 695 | 682 | 139.5 |
| B | 5 | 172 | 983503 | 7904.15 | 653 | 638 | 124.3 |
| B | 5 | 200 | 414203 | 3325.87 | 653 | 638 | 124.3 |
| B | 0 | 190 | 164863 | 1320.69 | 653 | 638 | 124.3 |
| C | 8 | 111 | 714748 | 4722.59 | 657 | 663 | 151.2 |
| C | 7 | 221 | 258573 | 1705.68 | 657 | 663 | 151.2 |
| C | 0 | 10 | 235860 | 1555.47 | 657 | 663 | 151.2 |
| D | 7 | 223 | 6105843 | 46459.35 | 494 | 484 | 131.4 |
| D | 12 | 218 | 1364318 | 10378.23 | 494 | 484 | 131.4 |
| D | 2 | 250 | 589115 | 4479.25 | 494 | 484 | 131.4 |
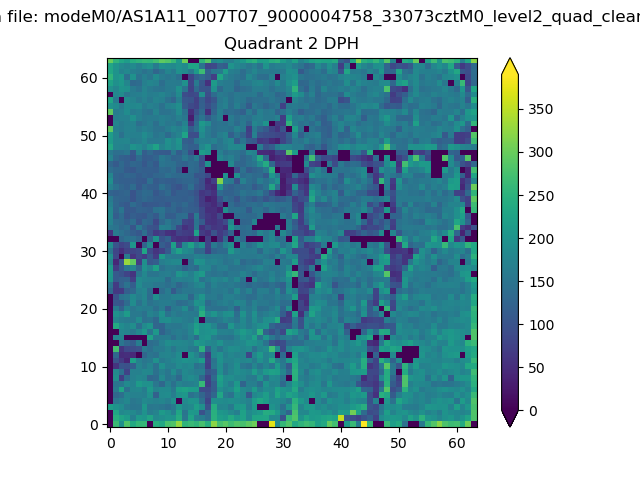
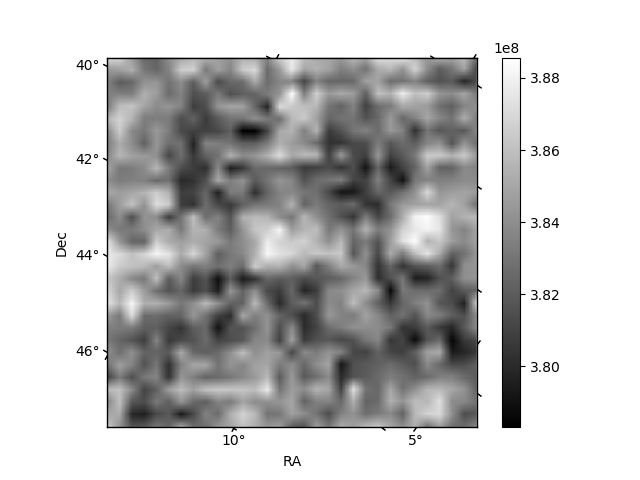
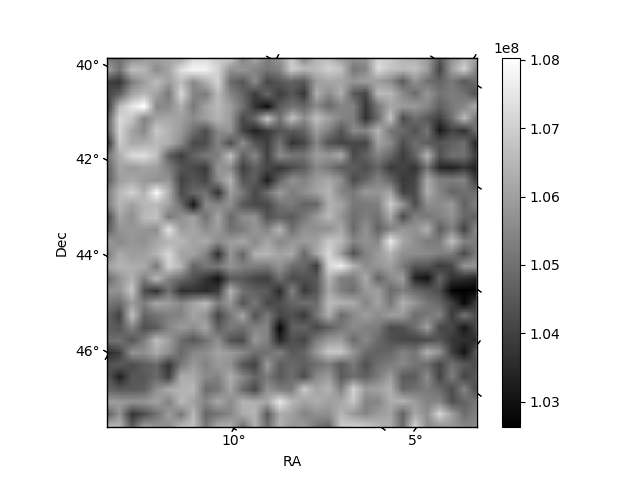
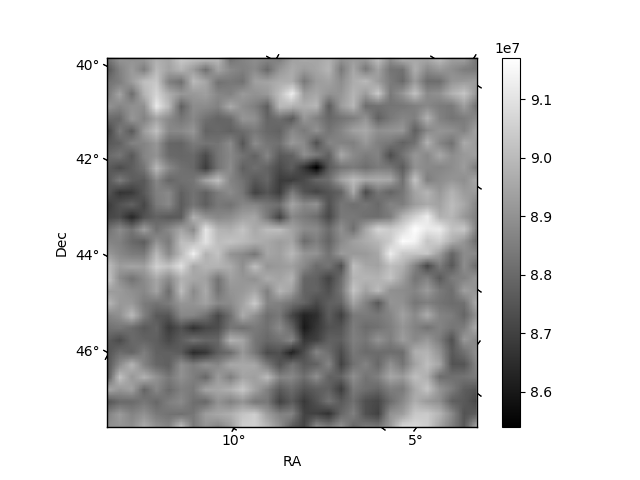
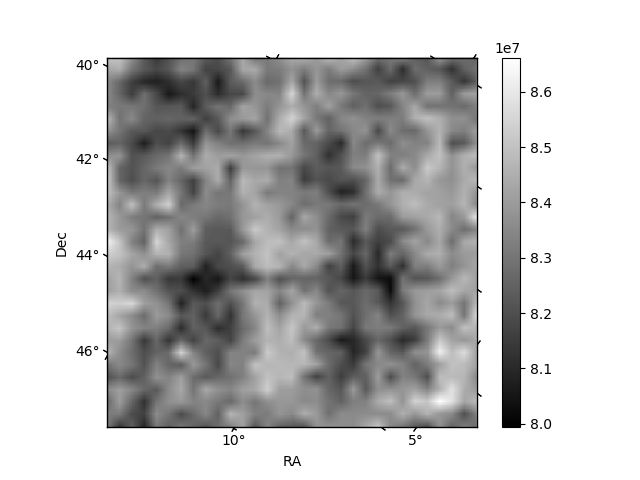
Histogram calculated using DETX and DETY for each event in the final _common_clean file
| Quadrant A | 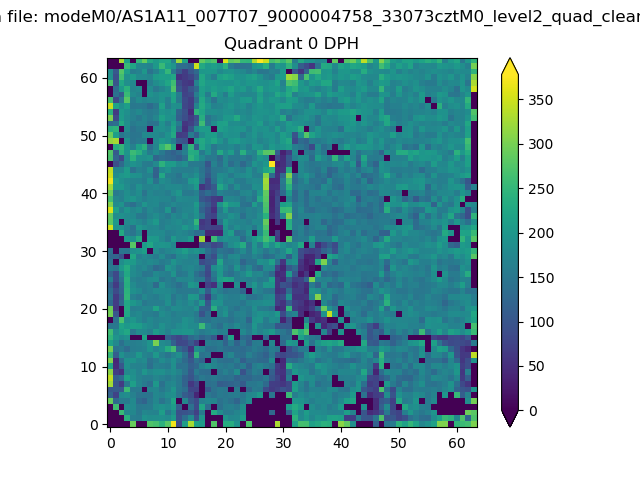 |
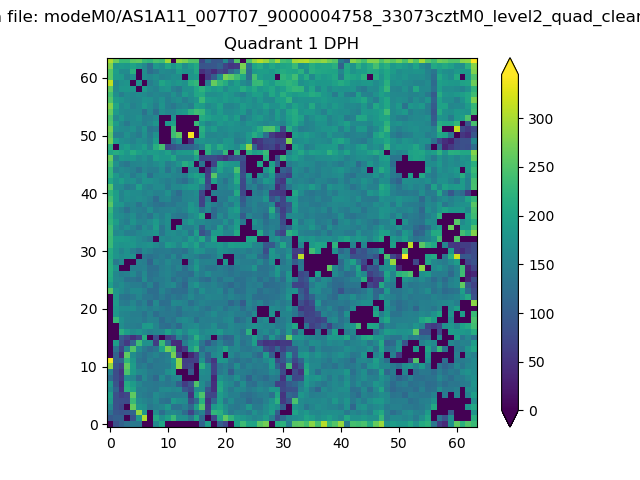 |
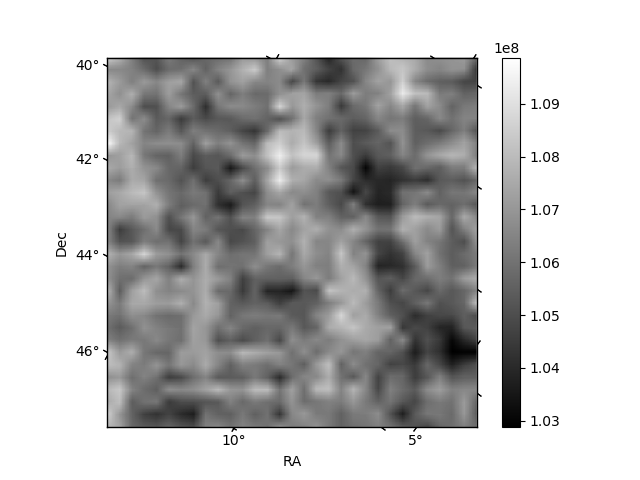
Quadrant B |
|---|---|---|---|
| Quadrant D | 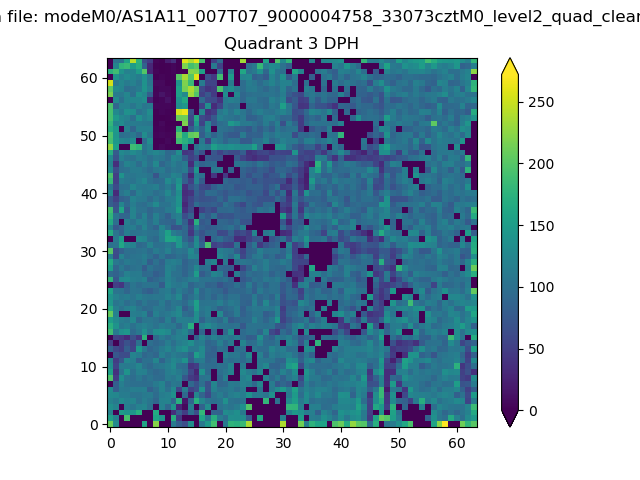 |
 |
Quadrant C |
| Plot type | Count rate plots | Images |
|---|---|---|
| Comparison with Poisson distribution Blue bars denote a histogram of data divided into 1 sec bins. Red curve is a Poisson curve with rate = median count rate of data. |
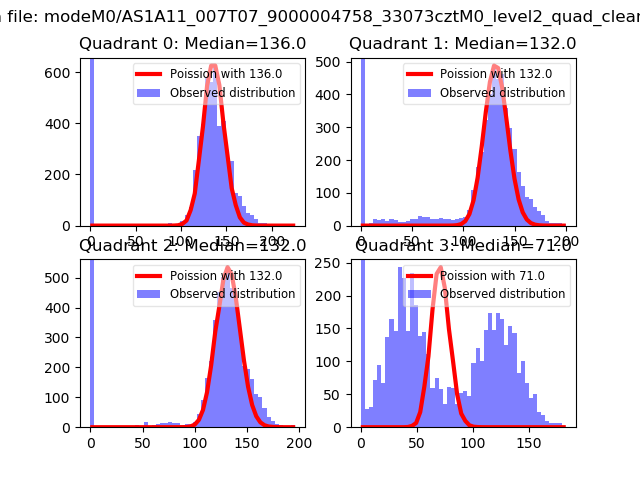 |
 |
| Quadrant-wise count rates Data is divided into 100 sec bins |
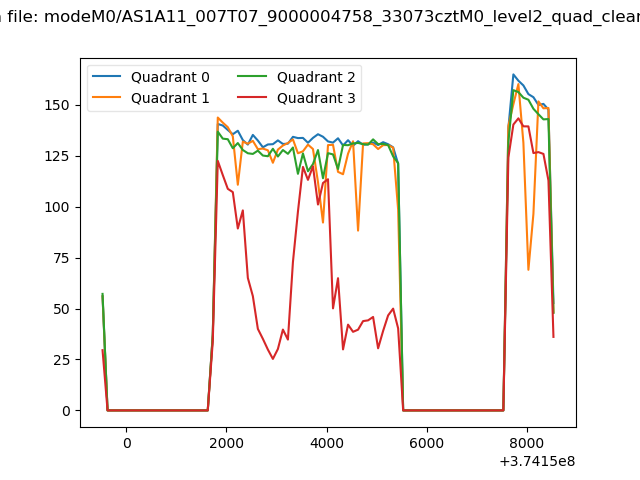 |
|
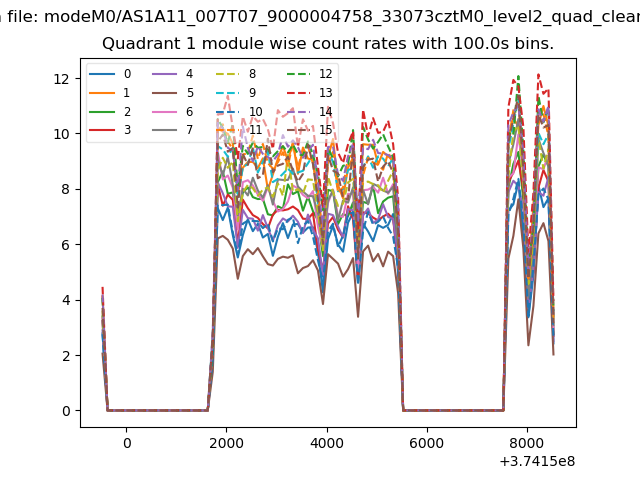
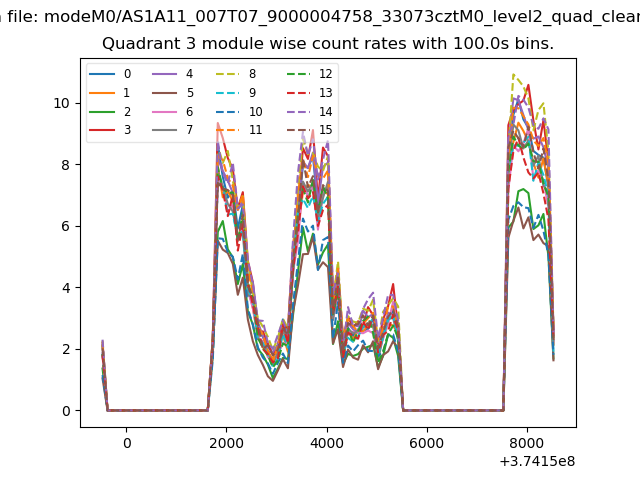
| Module-wise count rates for Quadrant A Data is divided into 100 sec bins |
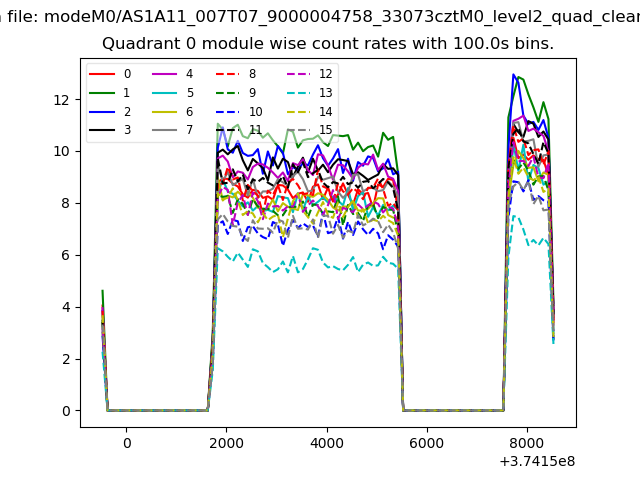 |
 |
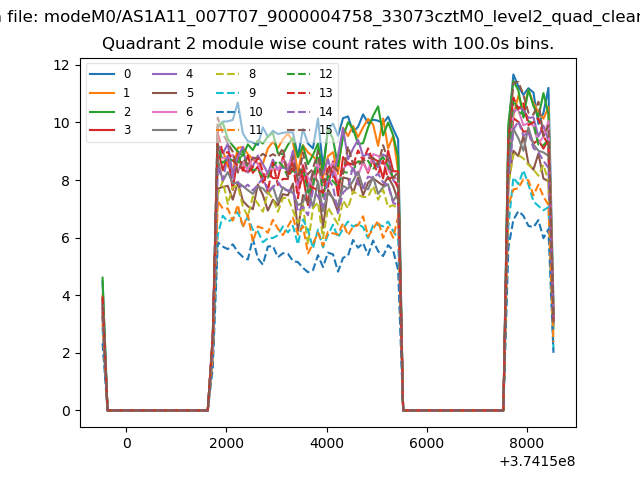
| Module-wise count rates for Quadrant B Data is divided into 100 sec bins |
 |
 |
| Module-wise count rates for Quadrant C Data is divided into 100 sec bins |
 |
 |
| Module-wise count rates for Quadrant D Data is divided into 100 sec bins |
 |
 |
| Parameter | Plot |
|---|---|
| CZT HV Monitor | 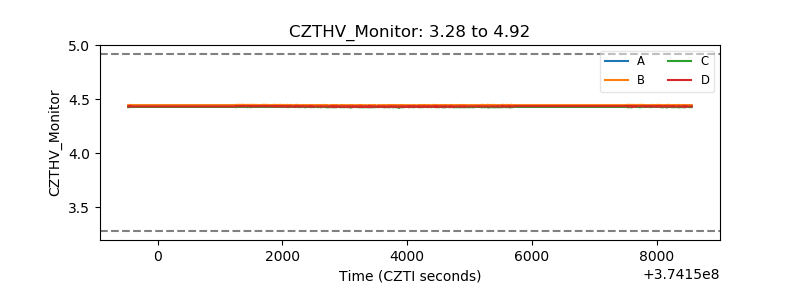 |
| D_VDD | 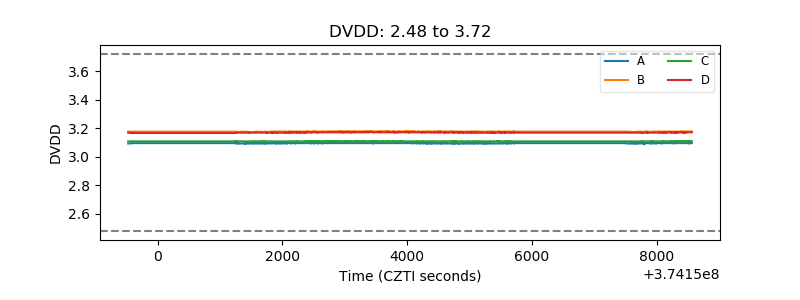 |
| Temperature 1 | 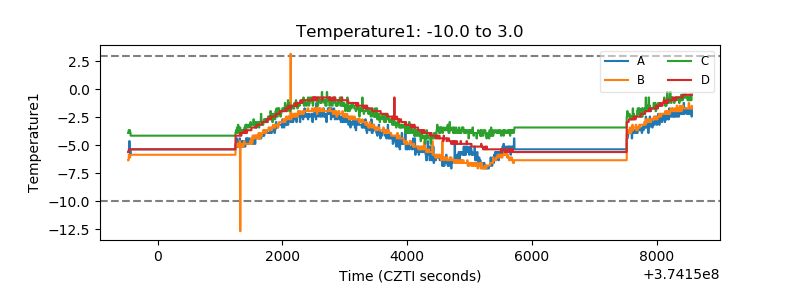 |
| Veto HV Monitor | 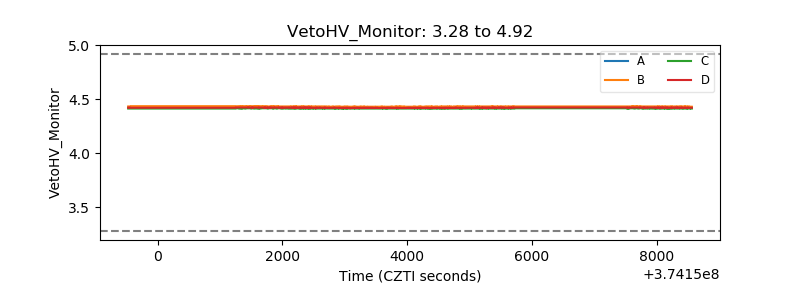 |
| Veto LLD |  |
| Alpha Counter | 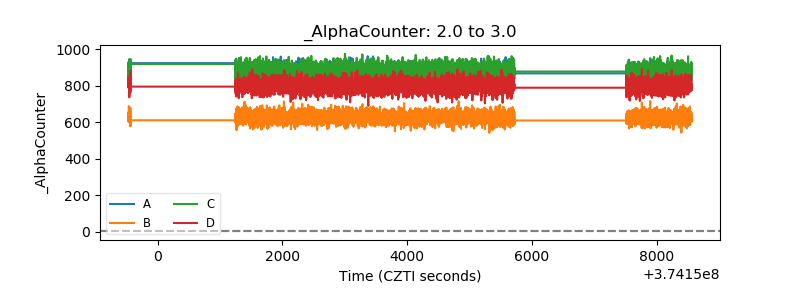 |
| _CPM_Rate | 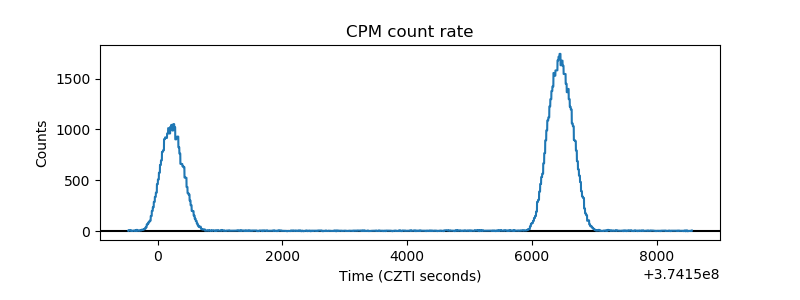 |
| CZT Counter | 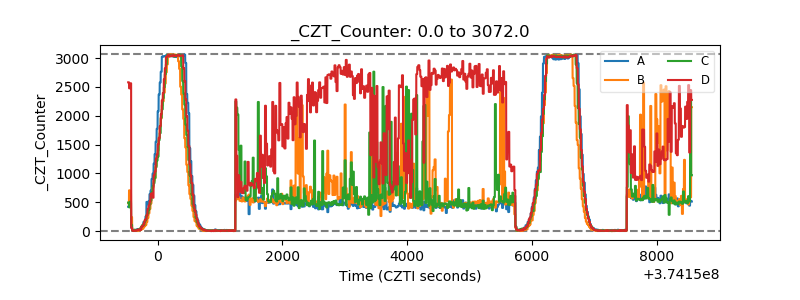 |
| +2.5 Volts monitor |  |
| +5 Volts monitor |  |
| _ROLL_ROT | 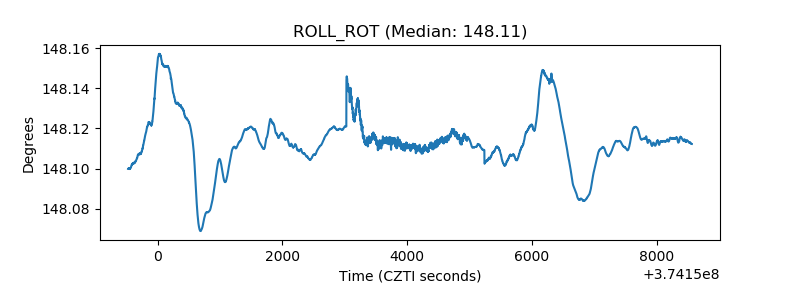 |
| _Roll_DEC | 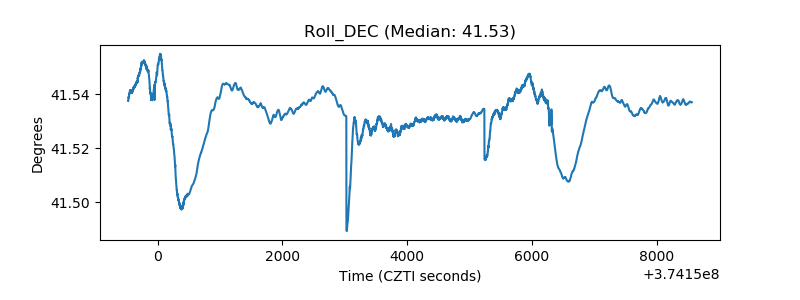 |
| _Roll_RA | 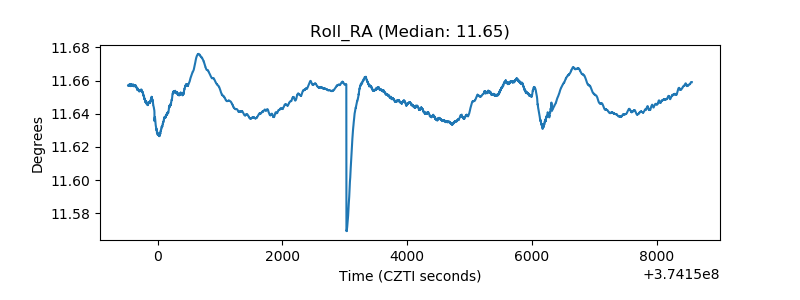 |
| Veto Counter | 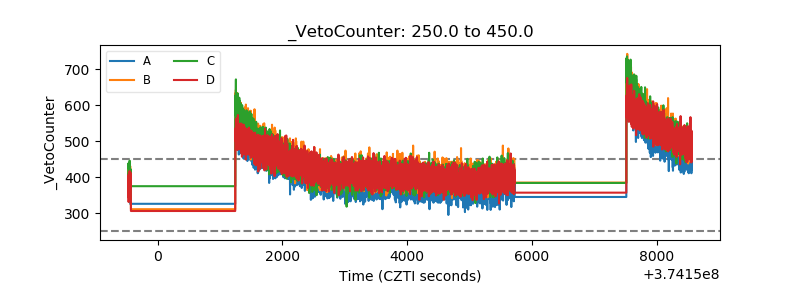 |