| Param | Original file | Final file |
|---|---|---|
| Filename | modeM0/AS1A11_007T07_9000004758_33075cztM0_level2.evt | modeM0/AS1A11_007T07_9000004758_33075cztM0_level2_quad_clean.evt |
| Size (bytes) | 734,765,760 | 86,336,640 |
| Size | 700.7 MB | 82.3 MB |
| Events in quadrant A | 2,586,958 | 662,627 |
| Events in quadrant B | 4,227,201 | 616,229 |
| Events in quadrant C | 3,096,063 | 640,397 |
| Events in quadrant D | 11,997,299 | 335,853 |
| Mode SS | |||
|---|---|---|---|
| Quadrant | BADHDUFLAG | Total packets | Discarded packets |
| A | 0 | 102 | 0 |
| B | 0 | 102 | 0 |
| C | 0 | 102 | 0 |
| D | 0 | 102 | 0 |
| Mode M0 | |||
|---|---|---|---|
| Quadrant | BADHDUFLAG | Total packets | Discarded packets |
| A | 0 | 10720 | 2 |
| B | 0 | 15801 | 1 |
| C | 0 | 12304 | 1 |
| D | 0 | 39176 | 1 |
| Mode M9 | |||
|---|---|---|---|
| Quadrant | BADHDUFLAG | Total packets | Discarded packets |
| A | 0 | 21 | 0 |
| B | 0 | 21 | 0 |
| C | 0 | 21 | 0 |
| D | 0 | 21 | 0 |
| Quadrant | Total seconds | Saturated seconds | Saturation percentage |
|---|---|---|---|
| A | 5110 | 4 | 0.078278% |
| B | 5110 | 568 | 11.115460% |
| C | 5110 | 81 | 1.585127% |
| D | 5110 | 4090 | 80.039139% |
Noise dominated data is calculated using 1-second bins in cleaned event files. If a bin has >2000 counts, and if more than 50% of those come from <1% of pixels, then it is considered to be noise-dominated and hence unusable.
| Quadrant | # 1 sec bins | Bins with >0 counts | Bins with >2000 counts | High rate bins dominated by noise | Noise dominated (total time) | Noise dominated (detector-on time) | Marked lightcurve |
|---|---|---|---|---|---|---|---|
| A | 7144 | 5111 | 1 | 1 | 0.01% | 0.02% | 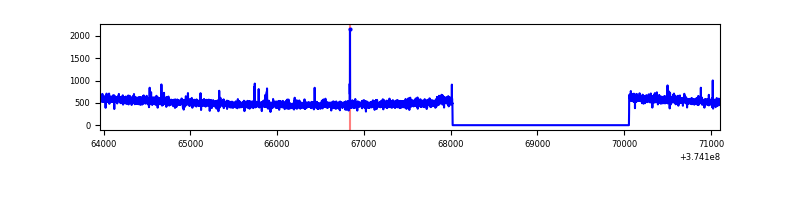 |
| B | 7144 | 5111 | 397 | 397 | 5.56% | 7.77% | 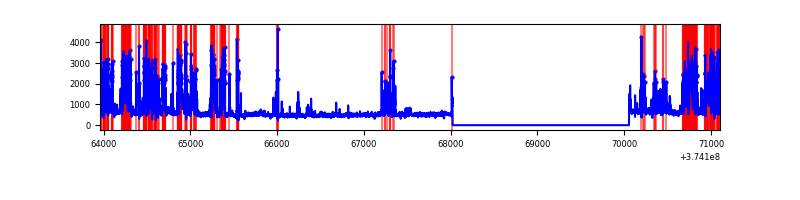 |
| C | 7144 | 5111 | 69 | 69 | 0.97% | 1.35% | 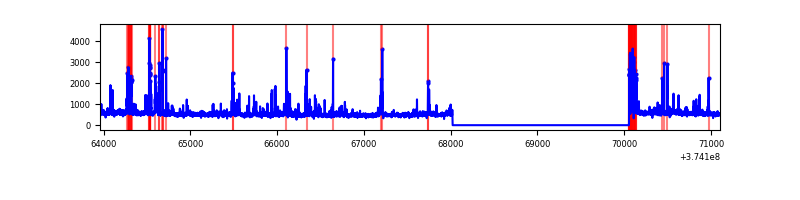 |
| D | 7144 | 5111 | 4017 | 4017 | 56.23% | 78.60% | 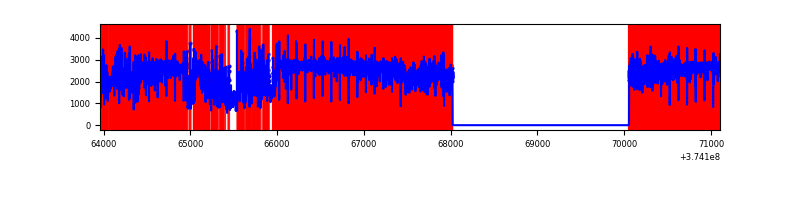 |
Top three noisy pixels from each quadrant. If the there are fewer than three noisy pixels in the level2.evt file, extra rows are filled as -1
| Pixel properties | Quadrant properties | ||||||
|---|---|---|---|---|---|---|---|
| Quadrant | DetID | PixID | Counts | Sigma | Mean | Median | Sigma |
| A | 13 | 254 | 10669 | 76.73 | 661 | 652 | 130.6 |
| A | 14 | 235 | 9896 | 70.81 | 661 | 652 | 130.6 |
| A | 15 | 169 | 8983 | 63.81 | 661 | 652 | 130.6 |
| B | 5 | 172 | 1475451 | 12820.86 | 621 | 607 | 115.0 |
| B | 5 | 200 | 116596 | 1008.3 | 621 | 607 | 115.0 |
| B | 0 | 189 | 62582 | 538.75 | 621 | 607 | 115.0 |
| C | 8 | 111 | 193200 | 1324.47 | 636 | 645 | 145.4 |
| C | 1 | 241 | 152311 | 1043.22 | 636 | 645 | 145.4 |
| C | 7 | 221 | 142734 | 977.34 | 636 | 645 | 145.4 |
| D | 7 | 223 | 7705954 | 69463.24 | 422 | 414 | 110.9 |
| D | 12 | 218 | 1168269 | 10527.88 | 422 | 414 | 110.9 |
| D | 8 | 195 | 846270 | 7625.15 | 422 | 414 | 110.9 |
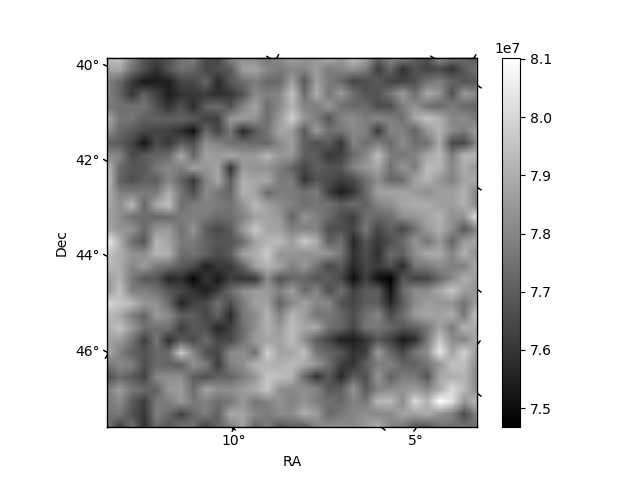
Histogram calculated using DETX and DETY for each event in the final _common_clean file
| Quadrant A |  |
 |
Quadrant B |
|---|---|---|---|
| Quadrant D |  |
 |
Quadrant C |
| Plot type | Count rate plots | Images |
|---|---|---|
| Comparison with Poisson distribution Blue bars denote a histogram of data divided into 1 sec bins. Red curve is a Poisson curve with rate = median count rate of data. |
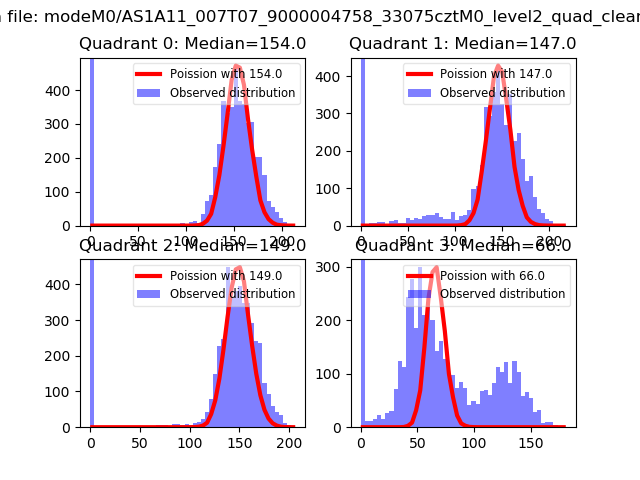 |
 |
| Quadrant-wise count rates Data is divided into 100 sec bins |
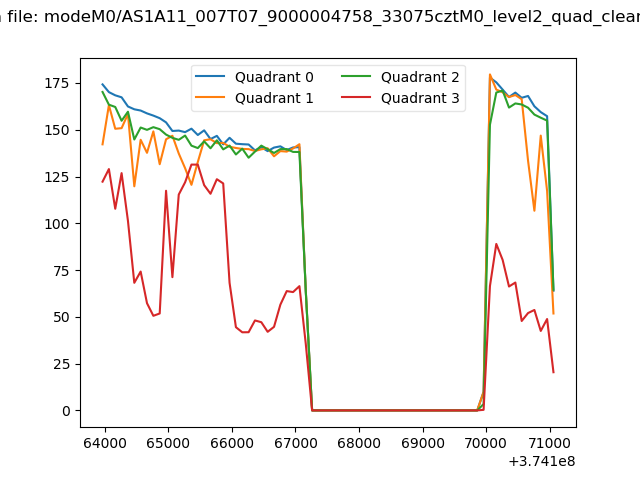 |
|
| Module-wise count rates for Quadrant A Data is divided into 100 sec bins |
 |
 |
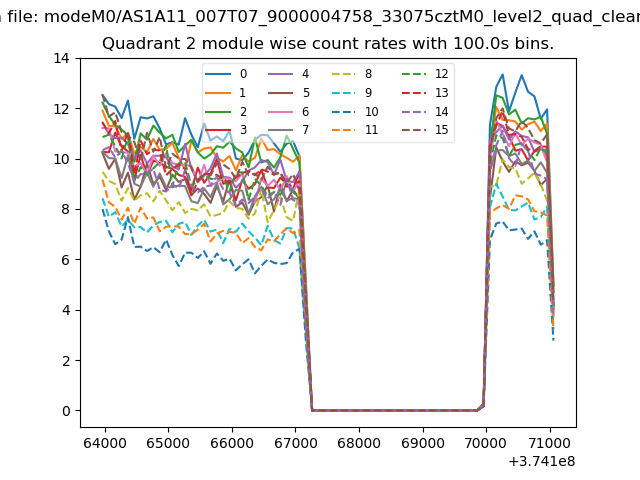
| Module-wise count rates for Quadrant B Data is divided into 100 sec bins |
 |
 |
| Module-wise count rates for Quadrant C Data is divided into 100 sec bins |
 |
 |
| Module-wise count rates for Quadrant D Data is divided into 100 sec bins |
 |
 |
| Parameter | Plot |
|---|---|
| CZT HV Monitor | 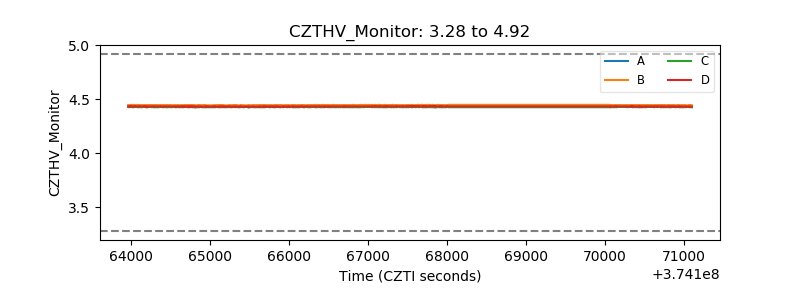 |
| D_VDD |  |
| Temperature 1 |  |
| Veto HV Monitor |  |
| Veto LLD |  |
| Alpha Counter | 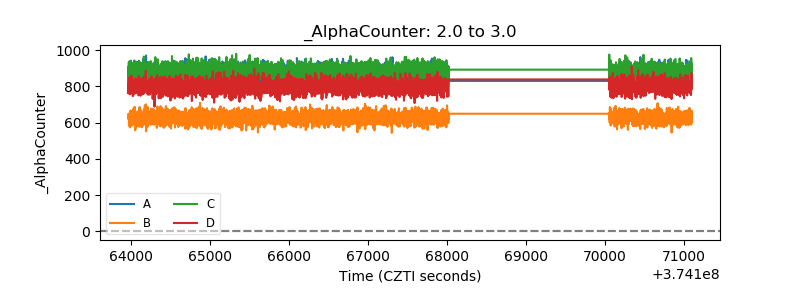 |
| _CPM_Rate | 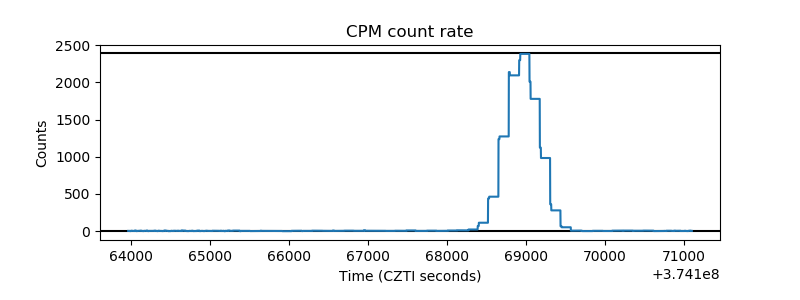 |
| CZT Counter |  |
| +2.5 Volts monitor |  |
| +5 Volts monitor |  |
| _ROLL_ROT |  |
| _Roll_DEC |  |
| _Roll_RA |  |
| Veto Counter |  |