| Param | Original file | Final file |
|---|---|---|
| Filename | modeM0/AS1A11_007T07_9000004758_33078cztM0_level2.evt | modeM0/AS1A11_007T07_9000004758_33078cztM0_level2_quad_clean.evt |
| Size (bytes) | 601,231,680 | 55,929,600 |
| Size | 573.4 MB | 53.3 MB |
| Events in quadrant A | 2,312,585 | 397,233 |
| Events in quadrant B | 2,852,231 | 392,405 |
| Events in quadrant C | 3,116,231 | 389,320 |
| Events in quadrant D | 9,585,701 | 159,781 |
| Mode SS | |||
|---|---|---|---|
| Quadrant | BADHDUFLAG | Total packets | Discarded packets |
| A | 0 | 104 | 0 |
| B | 0 | 104 | 0 |
| C | 0 | 104 | 0 |
| D | 0 | 104 | 0 |
| Mode M0 | |||
|---|---|---|---|
| Quadrant | BADHDUFLAG | Total packets | Discarded packets |
| A | 0 | 10166 | 3 |
| B | 0 | 11649 | 2 |
| C | 0 | 12544 | 2 |
| D | 0 | 31997 | 2 |
| Mode M9 | |||
|---|---|---|---|
| Quadrant | BADHDUFLAG | Total packets | Discarded packets |
| A | 0 | 32 | 0 |
| B | 0 | 32 | 0 |
| C | 0 | 32 | 0 |
| D | 0 | 33 | 0 |
| Quadrant | Total seconds | Saturated seconds | Saturation percentage |
|---|---|---|---|
| A | 5037 | 5 | 0.099265% |
| B | 5037 | 106 | 2.104427% |
| C | 5037 | 184 | 3.652968% |
| D | 5037 | 2852 | 56.621005% |
Noise dominated data is calculated using 1-second bins in cleaned event files. If a bin has >2000 counts, and if more than 50% of those come from <1% of pixels, then it is considered to be noise-dominated and hence unusable.
| Quadrant | # 1 sec bins | Bins with >0 counts | Bins with >2000 counts | High rate bins dominated by noise | Noise dominated (total time) | Noise dominated (detector-on time) | Marked lightcurve |
|---|---|---|---|---|---|---|---|
| A | 7069 | 5038 | 0 | 0 | 0.00% | 0.00% | 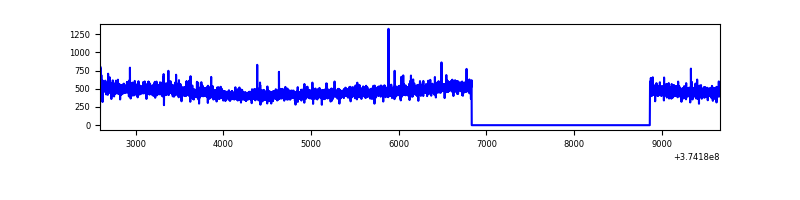 |
| B | 7069 | 5038 | 80 | 80 | 1.13% | 1.59% | 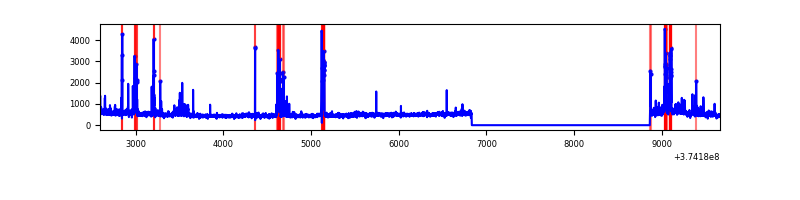 |
| C | 7069 | 5038 | 151 | 151 | 2.14% | 3.00% |  |
| D | 7069 | 5038 | 2662 | 2662 | 37.66% | 52.84% | 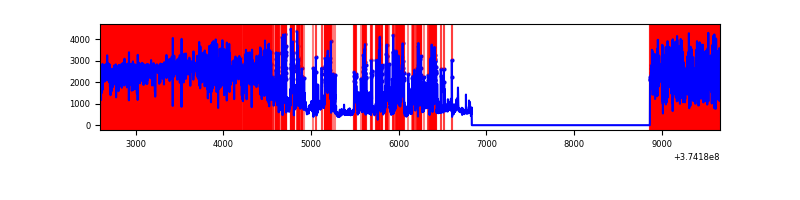 |
Top three noisy pixels from each quadrant. If the there are fewer than three noisy pixels in the level2.evt file, extra rows are filled as -1
| Pixel properties | Quadrant properties | ||||||
|---|---|---|---|---|---|---|---|
| Quadrant | DetID | PixID | Counts | Sigma | Mean | Median | Sigma |
| A | 15 | 169 | 24967 | 205.01 | 588 | 577 | 119.0 |
| A | 13 | 254 | 11437 | 91.28 | 588 | 577 | 119.0 |
| A | 3 | 137 | 5429 | 40.78 | 588 | 577 | 119.0 |
| B | 5 | 172 | 320275 | 2909.18 | 583 | 571 | 109.9 |
| B | 0 | 219 | 65483 | 590.67 | 583 | 571 | 109.9 |
| B | 0 | 189 | 42336 | 380.04 | 583 | 571 | 109.9 |
| C | 8 | 111 | 460642 | 3487.02 | 571 | 577 | 131.9 |
| C | 0 | 10 | 219463 | 1659.03 | 571 | 577 | 131.9 |
| C | 7 | 221 | 172562 | 1303.55 | 571 | 577 | 131.9 |
| D | 12 | 218 | 4617786 | 45298.77 | 386 | 378 | 101.9 |
| D | 7 | 223 | 2518442 | 24703.3 | 386 | 378 | 101.9 |
| D | 8 | 195 | 364404 | 3571.25 | 386 | 378 | 101.9 |
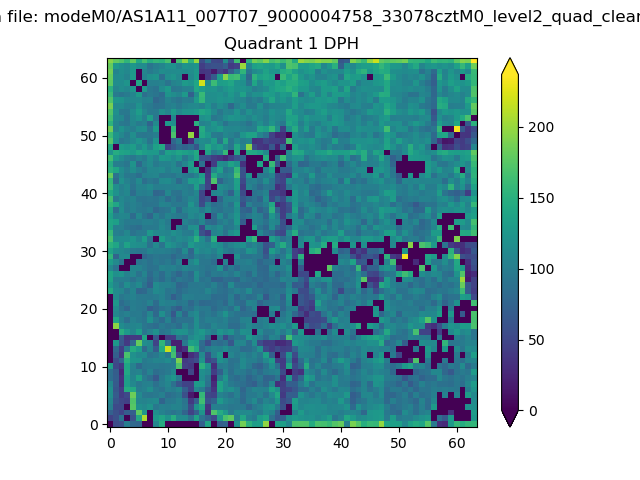
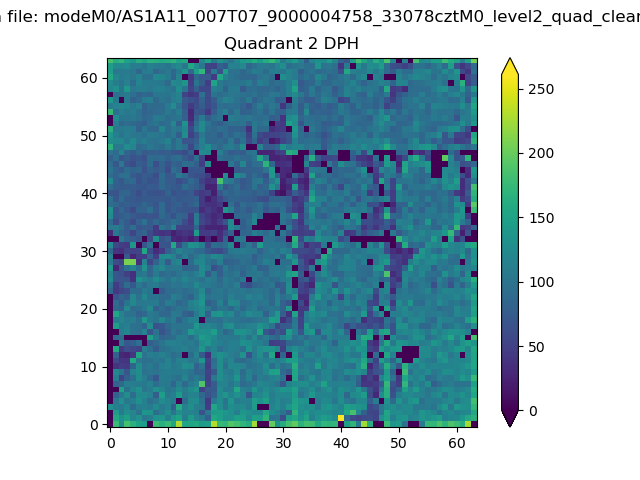
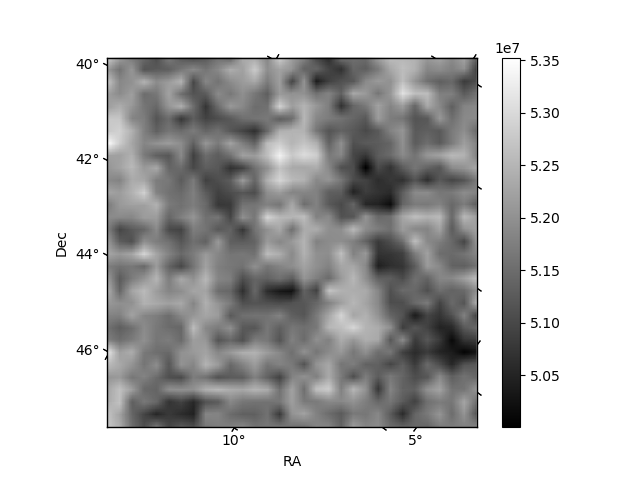
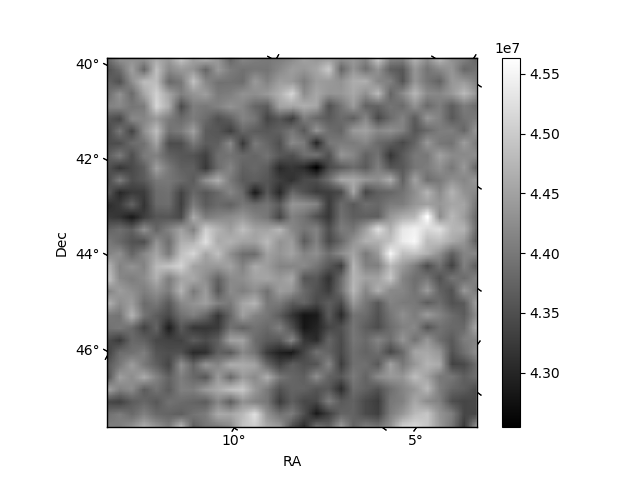
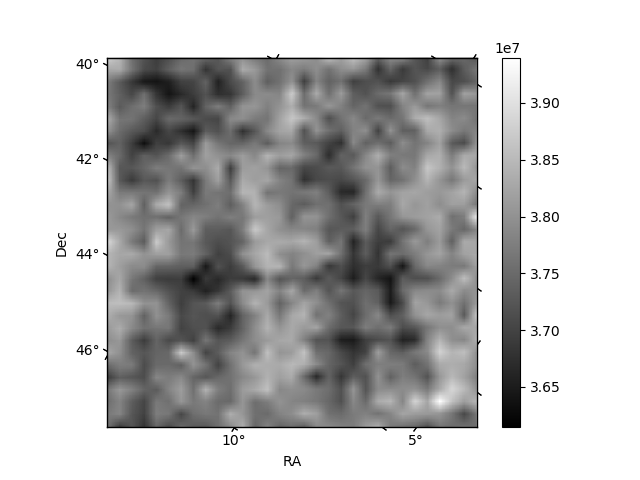
Histogram calculated using DETX and DETY for each event in the final _common_clean file
| Quadrant A | 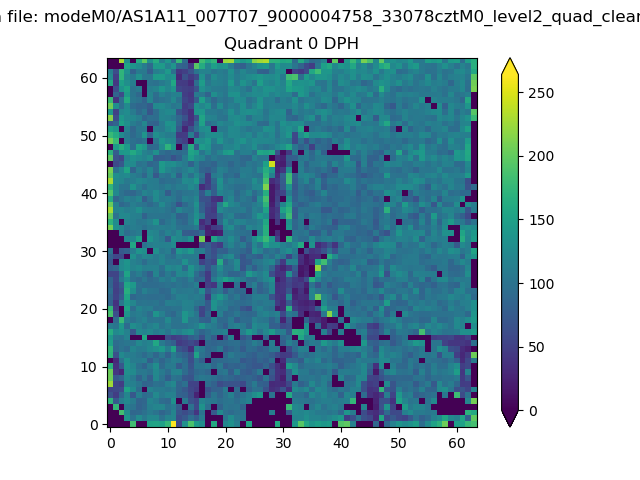 |
 |
Quadrant B |
|---|---|---|---|
| Quadrant D | 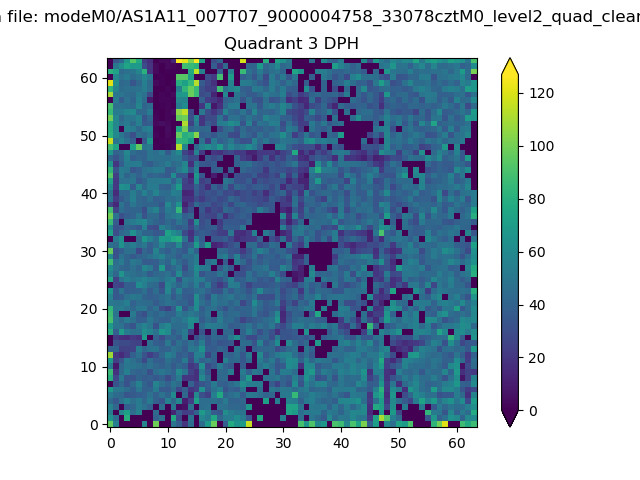 |
 |
Quadrant C |
| Plot type | Count rate plots | Images |
|---|---|---|
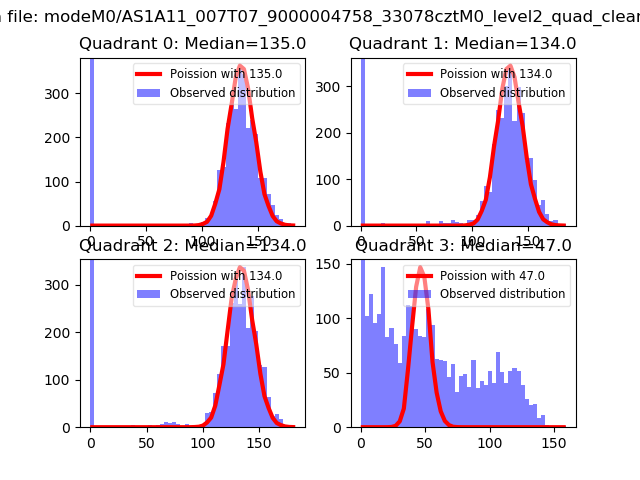
| Comparison with Poisson distribution Blue bars denote a histogram of data divided into 1 sec bins. Red curve is a Poisson curve with rate = median count rate of data. |
 |
 |
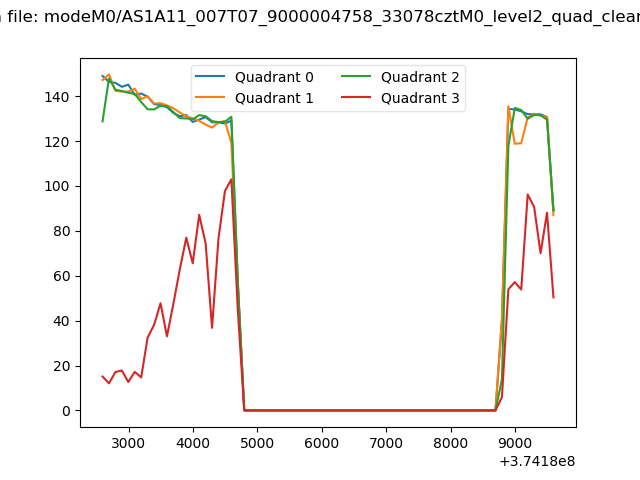
| Quadrant-wise count rates Data is divided into 100 sec bins |
 |
|
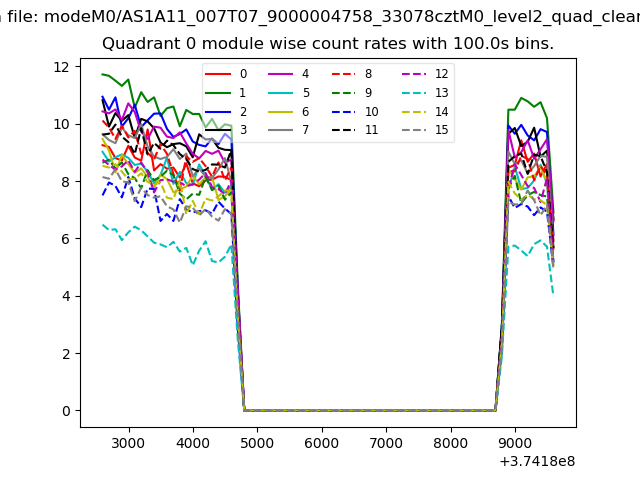
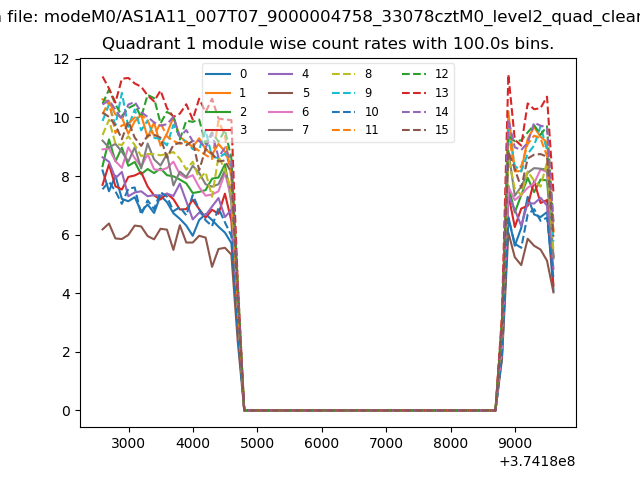
| Module-wise count rates for Quadrant A Data is divided into 100 sec bins |
 |
 |
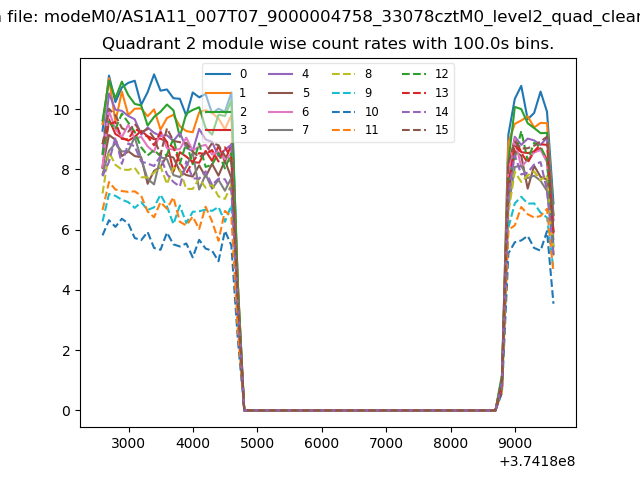
| Module-wise count rates for Quadrant B Data is divided into 100 sec bins |
 |
 |
| Module-wise count rates for Quadrant C Data is divided into 100 sec bins |
 |
 |
| Module-wise count rates for Quadrant D Data is divided into 100 sec bins |
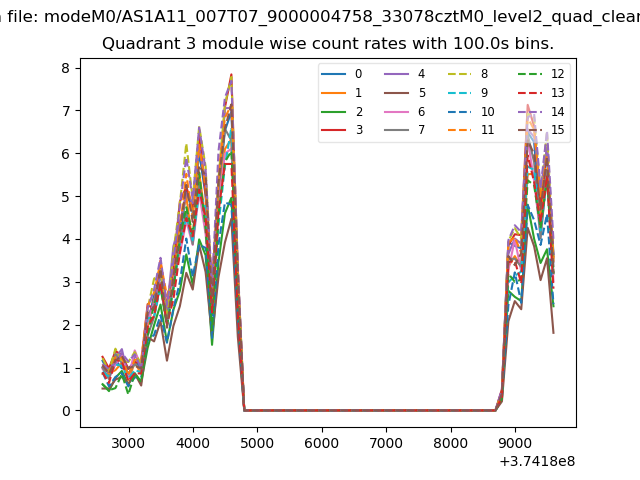 |
 |
| Parameter | Plot |
|---|---|
| CZT HV Monitor | 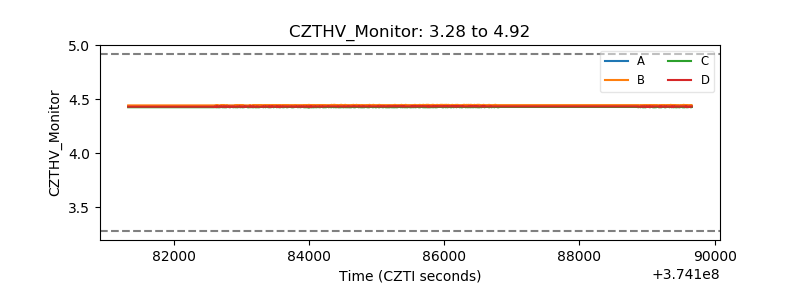 |
| D_VDD | 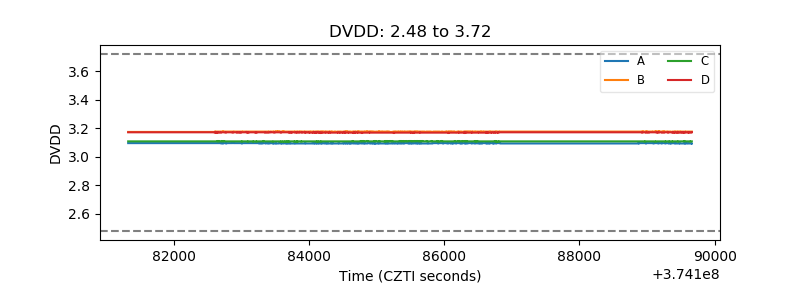 |
| Temperature 1 |  |
| Veto HV Monitor | 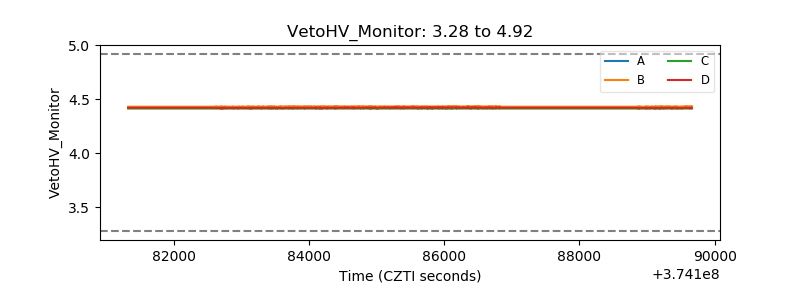 |
| Veto LLD | 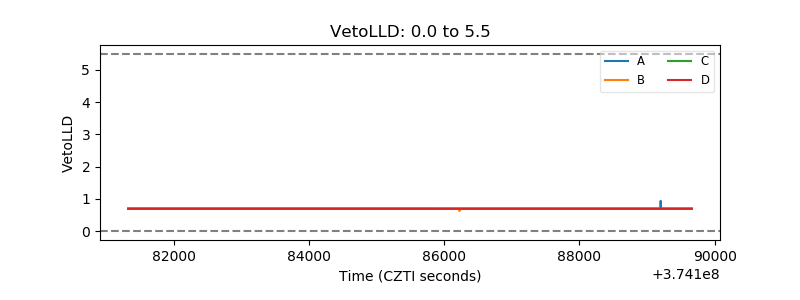 |
| Alpha Counter | 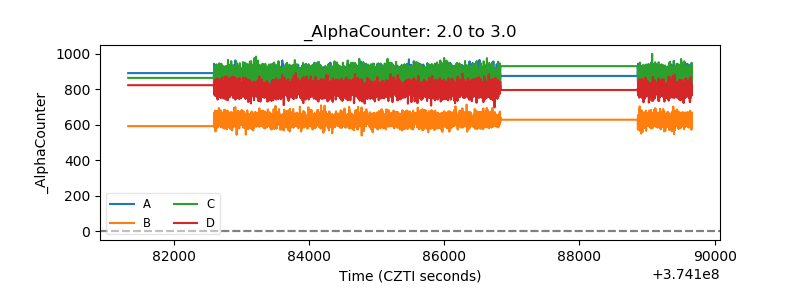 |
| _CPM_Rate | 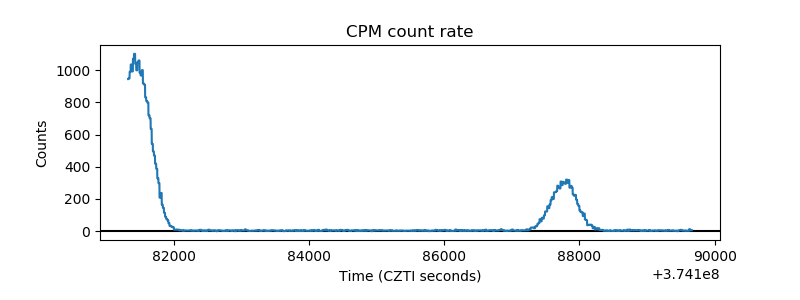 |
| CZT Counter | 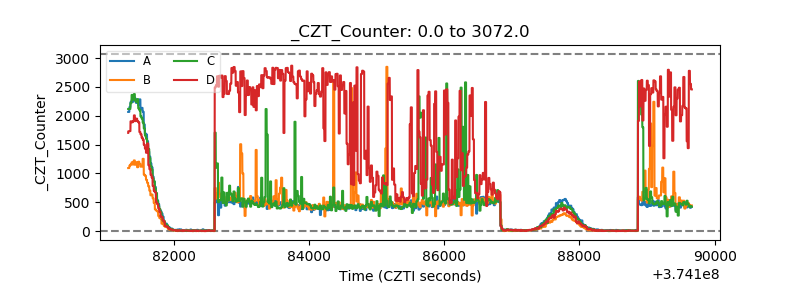 |
| +2.5 Volts monitor |  |
| +5 Volts monitor |  |
| _ROLL_ROT | 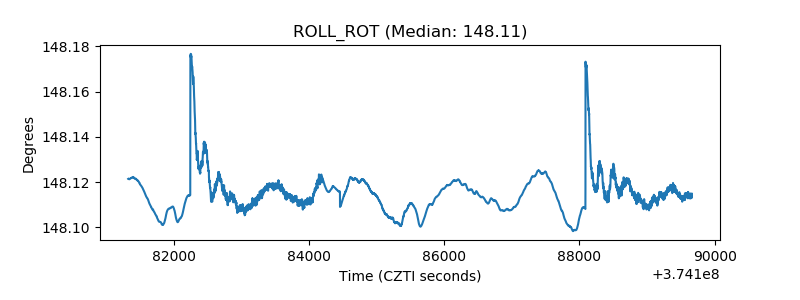 |
| _Roll_DEC | 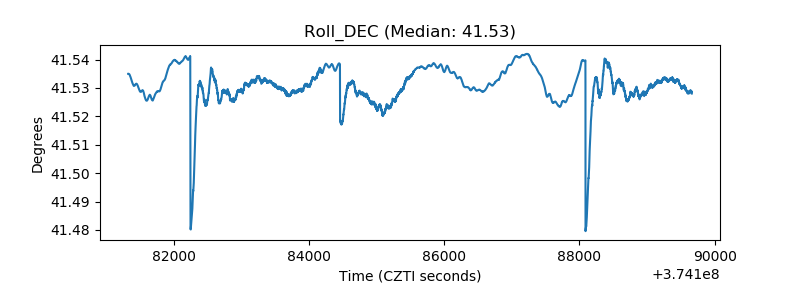 |
| _Roll_RA | 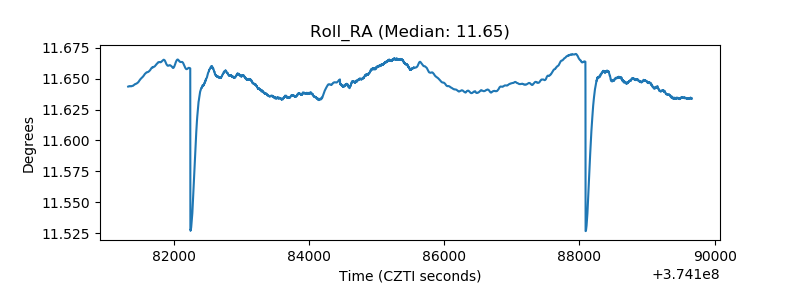 |
| Veto Counter | 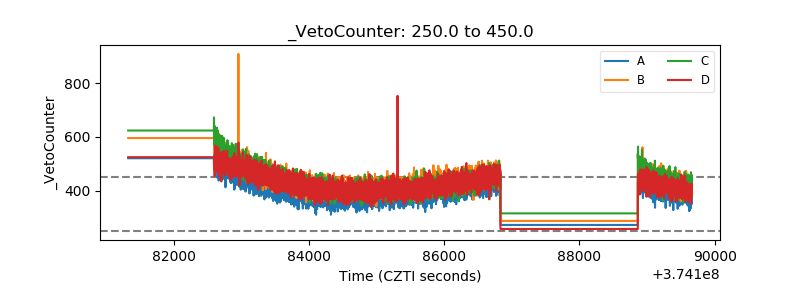 |