| Param | Original file | Final file |
|---|---|---|
| Filename | modeM0/AS1A11_007T07_9000004758_33080cztM0_level2.evt | modeM0/AS1A11_007T07_9000004758_33080cztM0_level2_quad_clean.evt |
| Size (bytes) | 599,748,480 | 69,367,680 |
| Size | 572.0 MB | 66.2 MB |
| Events in quadrant A | 2,588,718 | 456,516 |
| Events in quadrant B | 3,738,010 | 440,658 |
| Events in quadrant C | 5,567,139 | 425,195 |
| Events in quadrant D | 5,880,900 | 376,098 |
| Mode SS | |||
|---|---|---|---|
| Quadrant | BADHDUFLAG | Total packets | Discarded packets |
| A | 0 | 116 | 0 |
| B | 0 | 116 | 0 |
| C | 0 | 116 | 0 |
| D | 0 | 116 | 0 |
| Mode M0 | |||
|---|---|---|---|
| Quadrant | BADHDUFLAG | Total packets | Discarded packets |
| A | 0 | 11585 | 3 |
| B | 0 | 14944 | 2 |
| C | 0 | 20439 | 2 |
| D | 0 | 21278 | 2 |
| Mode M9 | |||
|---|---|---|---|
| Quadrant | BADHDUFLAG | Total packets | Discarded packets |
| A | 0 | 22 | 0 |
| B | 0 | 22 | 0 |
| C | 0 | 22 | 0 |
| D | 0 | 23 | 0 |
| Quadrant | Total seconds | Saturated seconds | Saturation percentage |
|---|---|---|---|
| A | 5741 | 11 | 0.191604% |
| B | 5741 | 328 | 5.713290% |
| C | 5741 | 836 | 14.561923% |
| D | 5741 | 918 | 15.990246% |
Noise dominated data is calculated using 1-second bins in cleaned event files. If a bin has >2000 counts, and if more than 50% of those come from <1% of pixels, then it is considered to be noise-dominated and hence unusable.
| Quadrant | # 1 sec bins | Bins with >0 counts | Bins with >2000 counts | High rate bins dominated by noise | Noise dominated (total time) | Noise dominated (detector-on time) | Marked lightcurve |
|---|---|---|---|---|---|---|---|
| A | 7173 | 5742 | 0 | 0 | 0.00% | 0.00% | 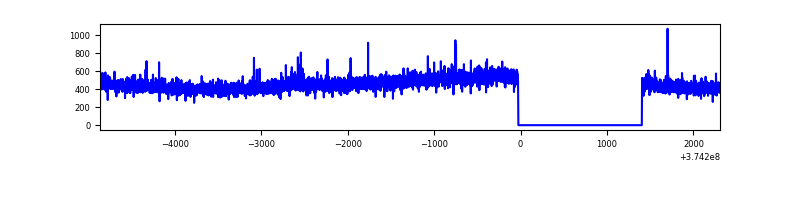 |
| B | 7173 | 5742 | 221 | 221 | 3.08% | 3.85% | 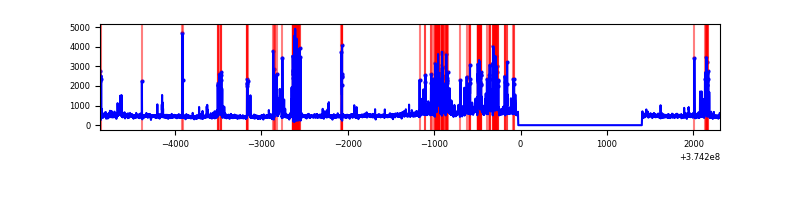 |
| C | 7173 | 5742 | 663 | 663 | 9.24% | 11.55% | 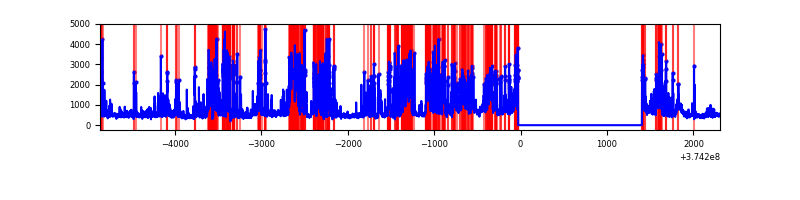 |
| D | 7173 | 5742 | 729 | 729 | 10.16% | 12.70% | 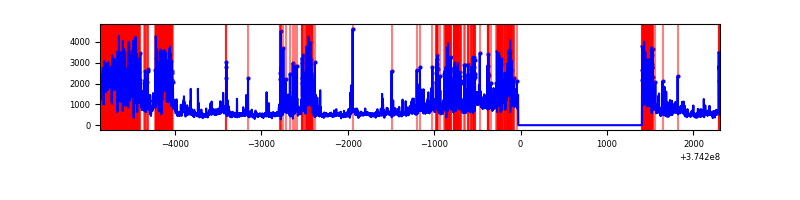 |
Top three noisy pixels from each quadrant. If the there are fewer than three noisy pixels in the level2.evt file, extra rows are filled as -1
| Pixel properties | Quadrant properties | ||||||
|---|---|---|---|---|---|---|---|
| Quadrant | DetID | PixID | Counts | Sigma | Mean | Median | Sigma |
| A | 15 | 174 | 18282 | 131.51 | 661 | 648 | 134.1 |
| A | 13 | 254 | 11882 | 83.78 | 661 | 648 | 134.1 |
| A | 13 | 6 | 6936 | 46.89 | 661 | 648 | 134.1 |
| B | 5 | 172 | 674843 | 5450.3 | 643 | 626 | 123.7 |
| B | 5 | 200 | 269586 | 2174.24 | 643 | 626 | 123.7 |
| B | 0 | 219 | 93374 | 749.76 | 643 | 626 | 123.7 |
| C | 8 | 111 | 2441842 | 17415.74 | 607 | 613 | 140.2 |
| C | 3 | 233 | 328549 | 2339.5 | 607 | 613 | 140.2 |
| C | 7 | 221 | 199886 | 1421.61 | 607 | 613 | 140.2 |
| D | 12 | 218 | 1683536 | 10743.81 | 589 | 575 | 156.6 |
| D | 8 | 195 | 876818 | 5593.82 | 589 | 575 | 156.6 |
| D | 2 | 250 | 296381 | 1888.38 | 589 | 575 | 156.6 |
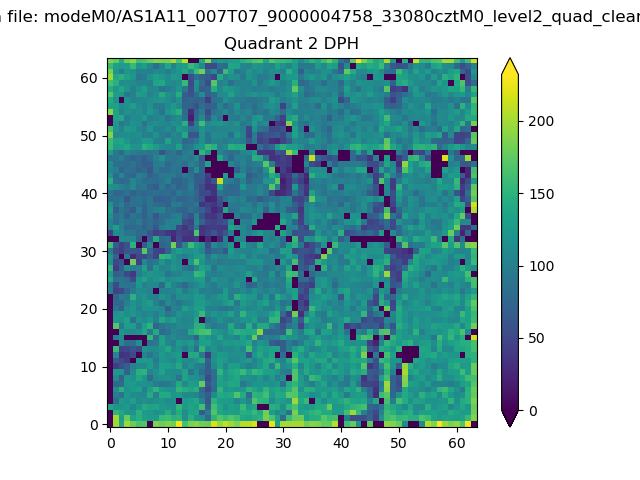
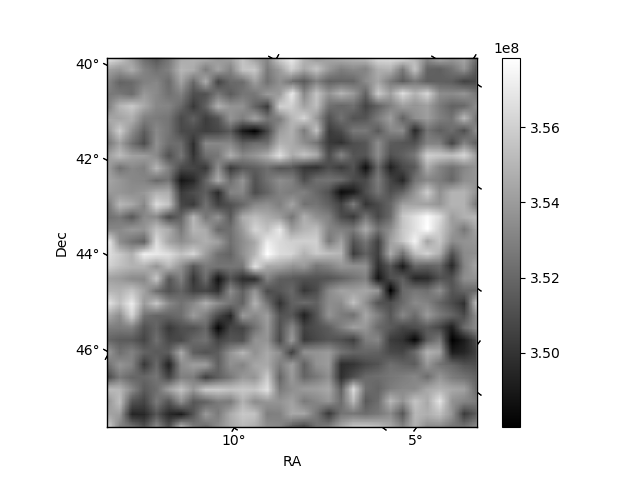
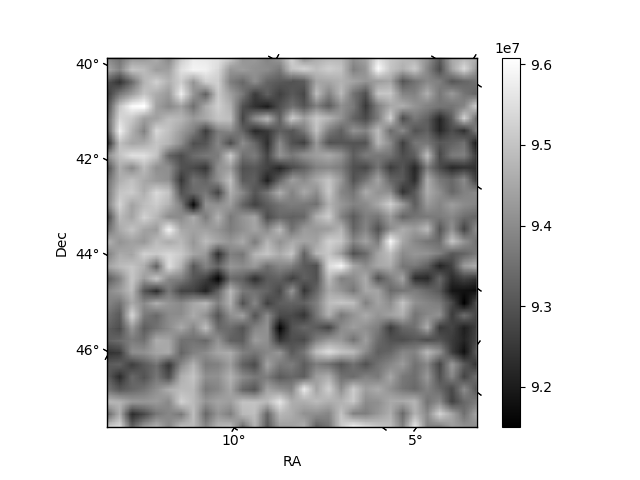
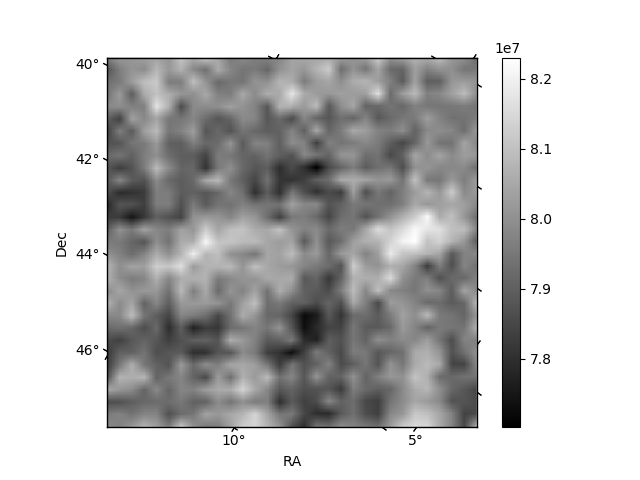
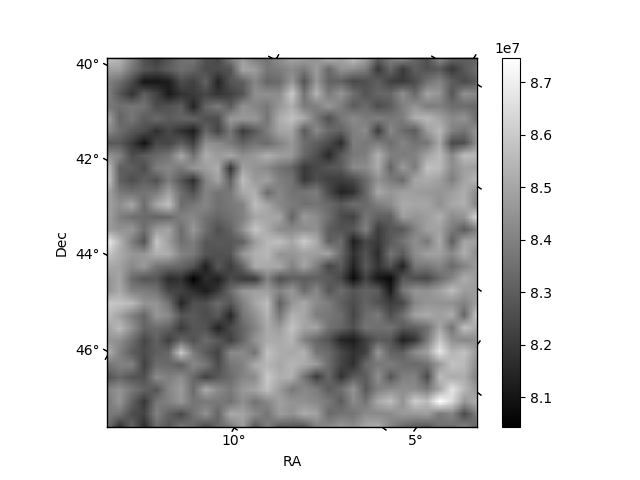
Histogram calculated using DETX and DETY for each event in the final _common_clean file
| Quadrant A | 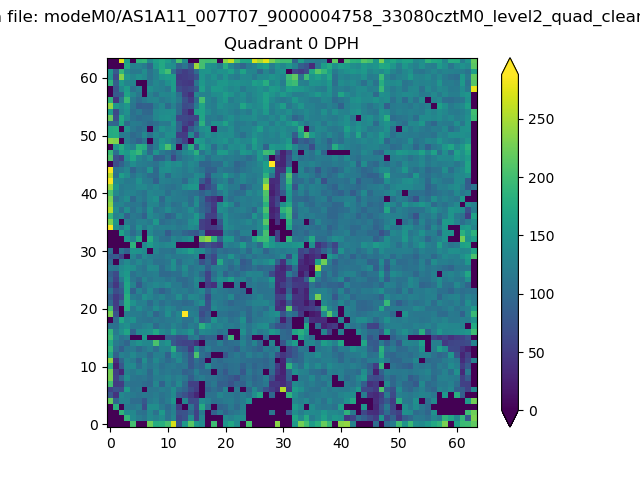 |
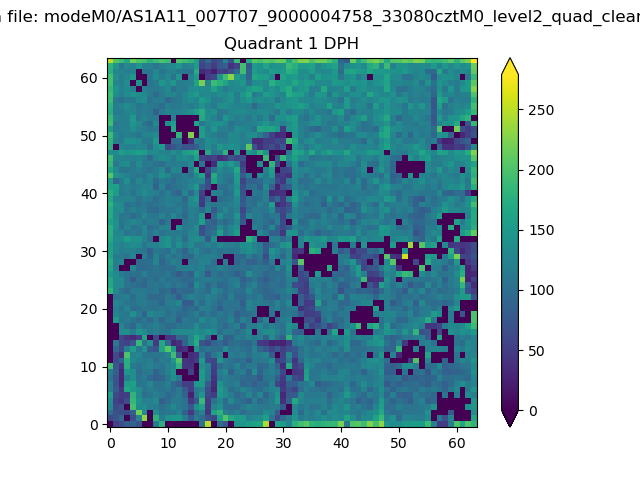 |
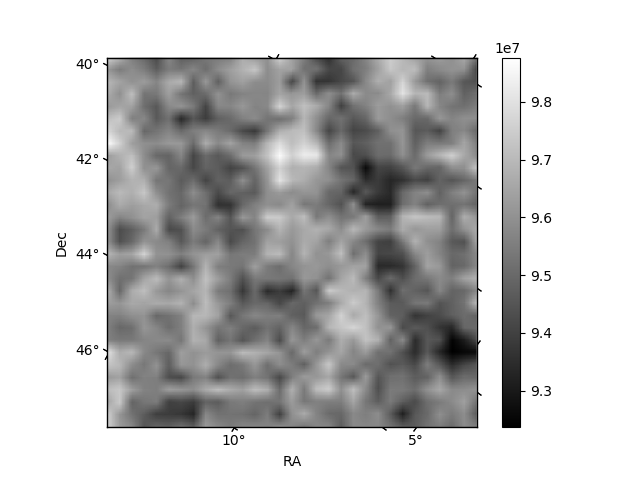
Quadrant B |
|---|---|---|---|
| Quadrant D | 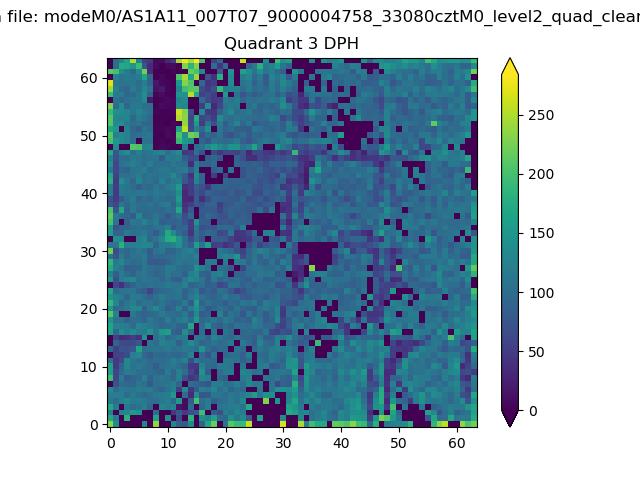 |
 |
Quadrant C |
| Plot type | Count rate plots | Images |
|---|---|---|
| Comparison with Poisson distribution Blue bars denote a histogram of data divided into 1 sec bins. Red curve is a Poisson curve with rate = median count rate of data. |
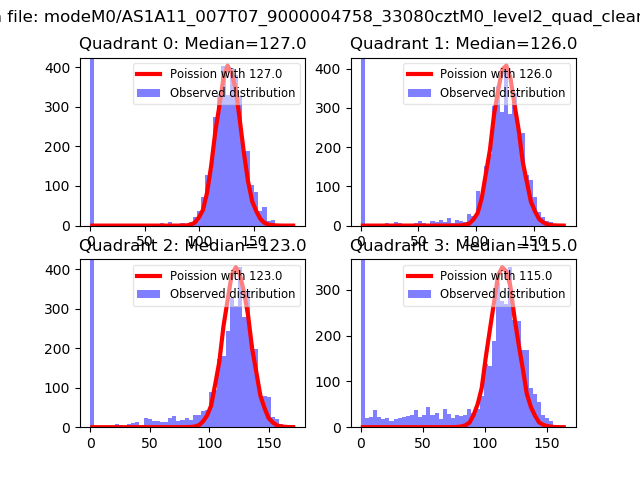 |
 |
| Quadrant-wise count rates Data is divided into 100 sec bins |
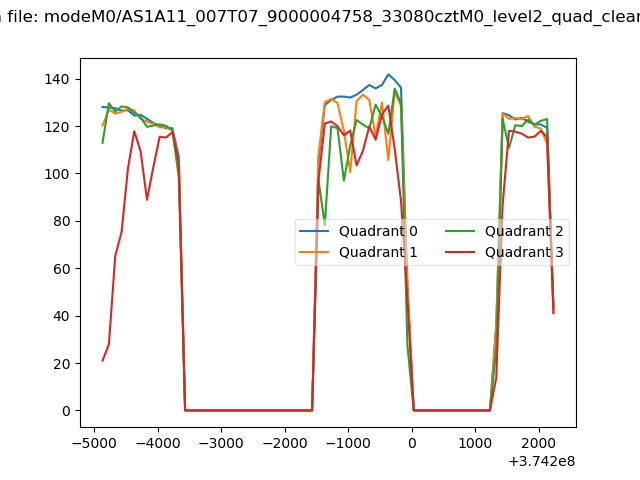 |
|
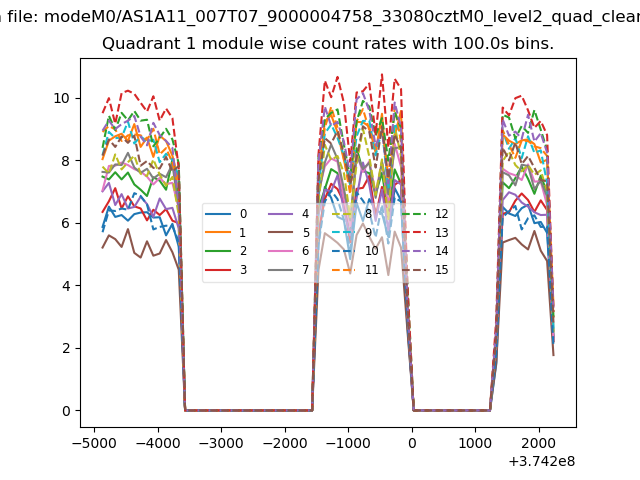
| Module-wise count rates for Quadrant A Data is divided into 100 sec bins |
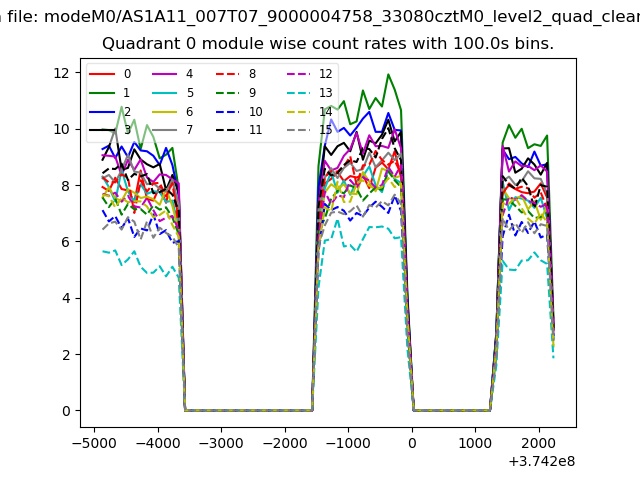 |
 |
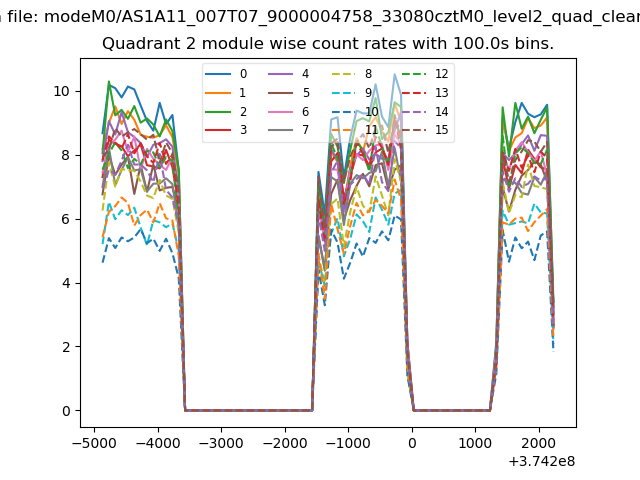
| Module-wise count rates for Quadrant B Data is divided into 100 sec bins |
 |
 |
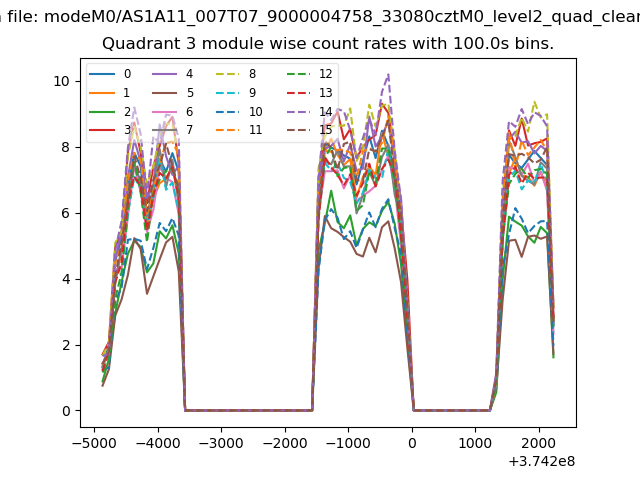
| Module-wise count rates for Quadrant C Data is divided into 100 sec bins |
 |
 |
| Module-wise count rates for Quadrant D Data is divided into 100 sec bins |
 |
 |
| Parameter | Plot |
|---|---|
| CZT HV Monitor | 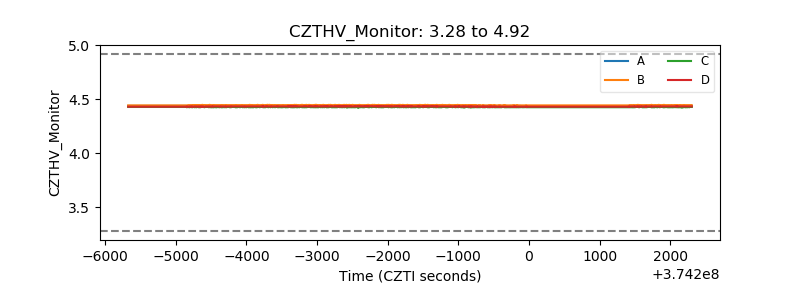 |
| D_VDD | 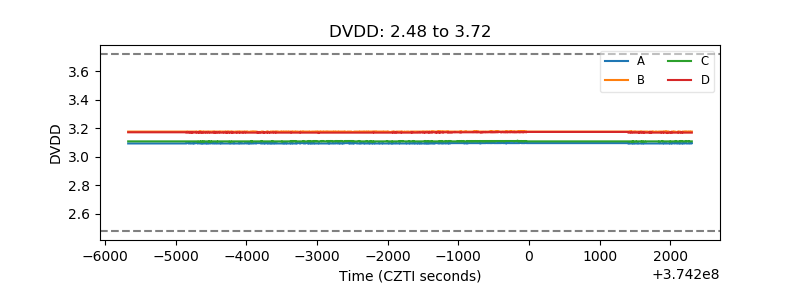 |
| Temperature 1 | 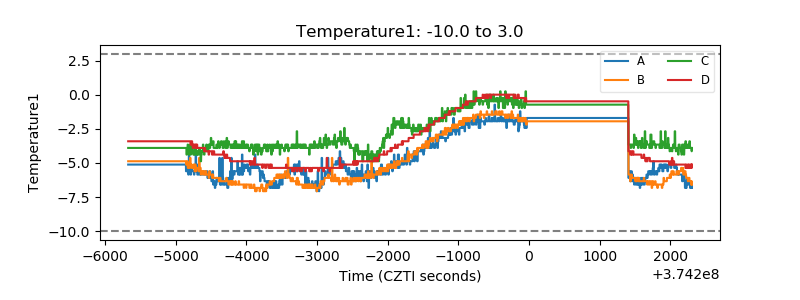 |
| Veto HV Monitor | 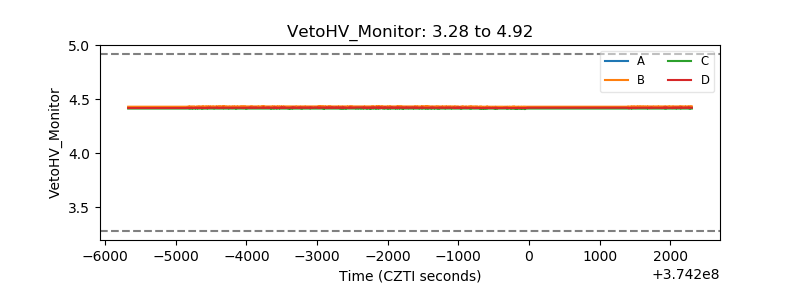 |
| Veto LLD | 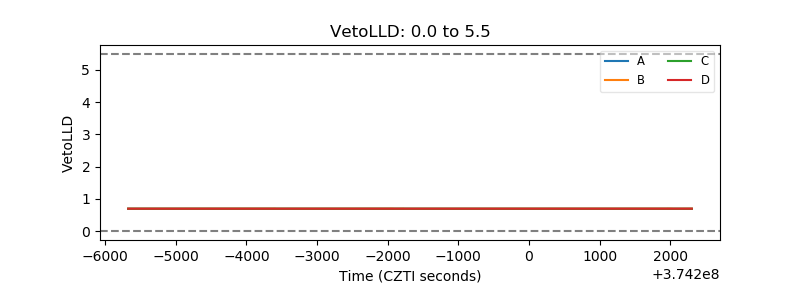 |
| Alpha Counter | 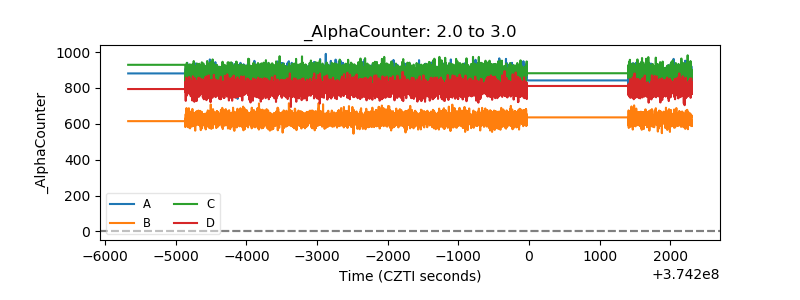 |
| _CPM_Rate | 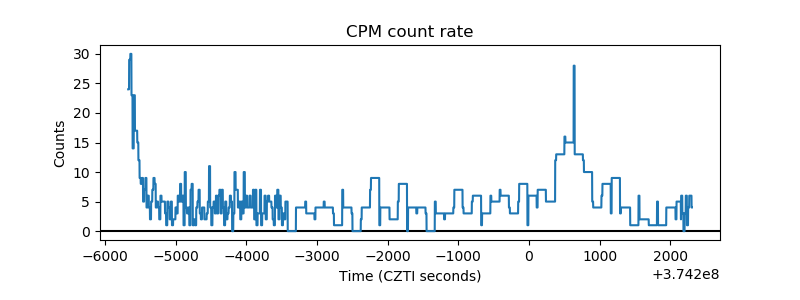 |
| CZT Counter | 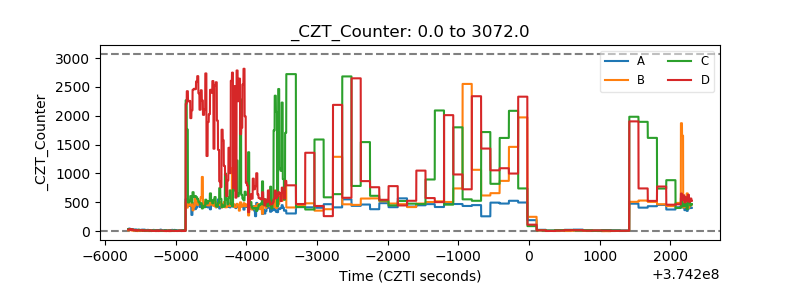 |
| +2.5 Volts monitor |  |
| +5 Volts monitor |  |
| _ROLL_ROT | 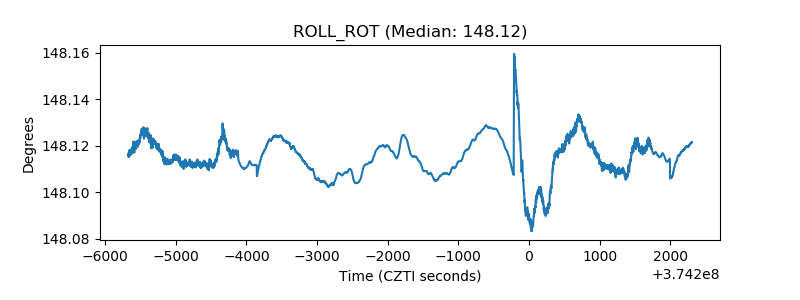 |
| _Roll_DEC | 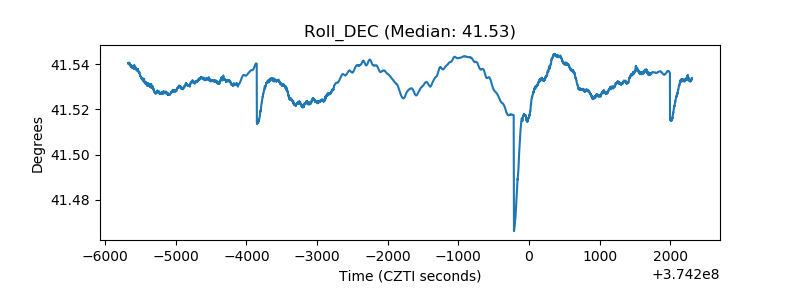 |
| _Roll_RA | 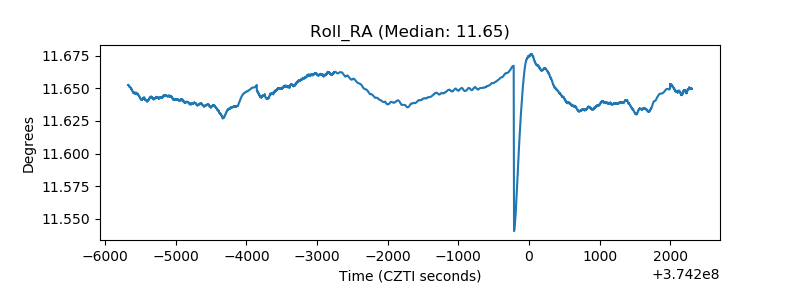 |
| Veto Counter | 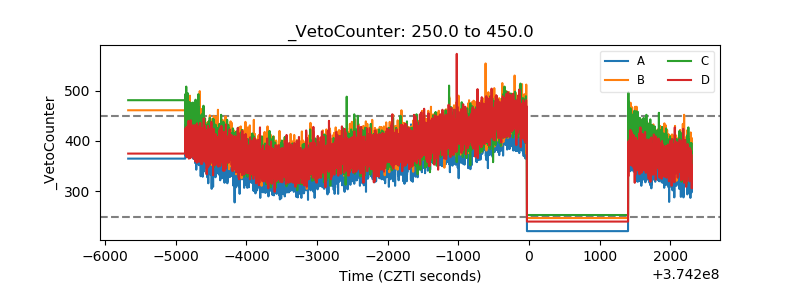 |