| Param | Original file | Final file |
|---|---|---|
| Filename | modeM0/AS1A11_007T07_9000004758_33081cztM0_level2.evt | modeM0/AS1A11_007T07_9000004758_33081cztM0_level2_quad_clean.evt |
| Size (bytes) | 693,780,480 | 77,713,920 |
| Size | 661.6 MB | 74.1 MB |
| Events in quadrant A | 2,986,412 | 504,956 |
| Events in quadrant B | 5,061,730 | 472,474 |
| Events in quadrant C | 6,195,329 | 464,386 |
| Events in quadrant D | 6,327,757 | 456,329 |
| Mode SS | |||
|---|---|---|---|
| Quadrant | BADHDUFLAG | Total packets | Discarded packets |
| A | 0 | 134 | 0 |
| B | 0 | 134 | 0 |
| C | 0 | 134 | 0 |
| D | 0 | 134 | 0 |
| Mode M0 | |||
|---|---|---|---|
| Quadrant | BADHDUFLAG | Total packets | Discarded packets |
| A | 0 | 13167 | 3 |
| B | 0 | 19404 | 2 |
| C | 0 | 22849 | 2 |
| D | 0 | 23368 | 2 |
| Mode M9 | |||
|---|---|---|---|
| Quadrant | BADHDUFLAG | Total packets | Discarded packets |
| A | 0 | 27 | 0 |
| B | 0 | 27 | 0 |
| C | 0 | 27 | 0 |
| D | 0 | 27 | 0 |
| Quadrant | Total seconds | Saturated seconds | Saturation percentage |
|---|---|---|---|
| A | 6518 | 12 | 0.184106% |
| B | 6518 | 645 | 9.895674% |
| C | 6518 | 821 | 12.595888% |
| D | 6518 | 404 | 6.198220% |
Noise dominated data is calculated using 1-second bins in cleaned event files. If a bin has >2000 counts, and if more than 50% of those come from <1% of pixels, then it is considered to be noise-dominated and hence unusable.
| Quadrant | # 1 sec bins | Bins with >0 counts | Bins with >2000 counts | High rate bins dominated by noise | Noise dominated (total time) | Noise dominated (detector-on time) | Marked lightcurve |
|---|---|---|---|---|---|---|---|
| A | 9263 | 6520 | 0 | 0 | 0.00% | 0.00% | 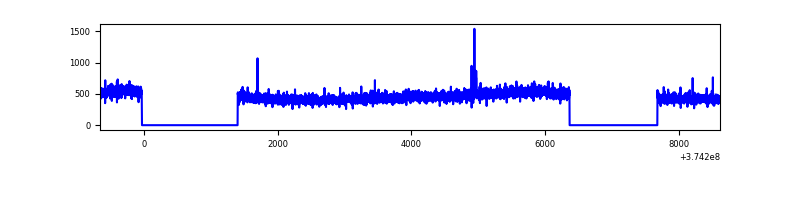 |
| B | 9263 | 6520 | 440 | 440 | 4.75% | 6.75% | 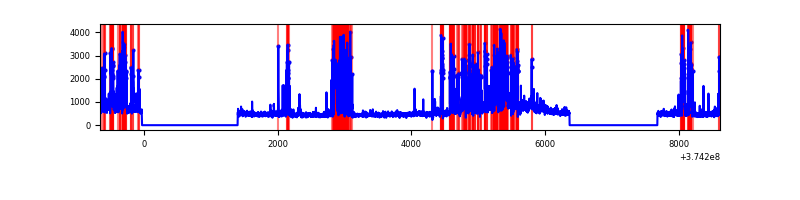 |
| C | 9263 | 6520 | 629 | 629 | 6.79% | 9.65% | 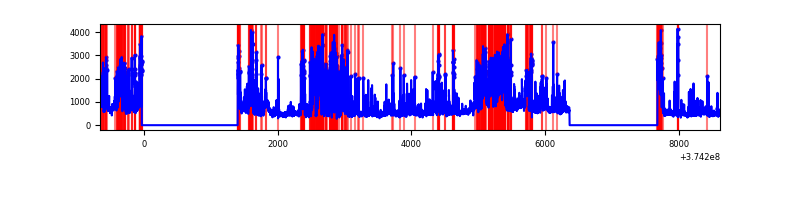 |
| D | 9263 | 6520 | 276 | 276 | 2.98% | 4.23% | 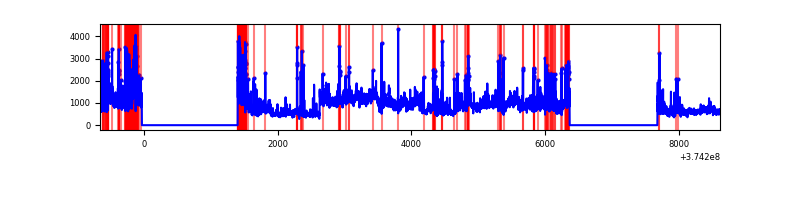 |
Top three noisy pixels from each quadrant. If the there are fewer than three noisy pixels in the level2.evt file, extra rows are filled as -1
| Pixel properties | Quadrant properties | ||||||
|---|---|---|---|---|---|---|---|
| Quadrant | DetID | PixID | Counts | Sigma | Mean | Median | Sigma |
| A | 13 | 254 | 13794 | 84.31 | 765 | 748 | 154.7 |
| A | 13 | 6 | 11662 | 70.53 | 765 | 748 | 154.7 |
| A | 15 | 174 | 8049 | 47.18 | 765 | 748 | 154.7 |
| B | 5 | 172 | 1334075 | 9435.45 | 731 | 712 | 141.3 |
| B | 5 | 200 | 344547 | 2433.12 | 731 | 712 | 141.3 |
| B | 0 | 189 | 167283 | 1178.73 | 731 | 712 | 141.3 |
| C | 8 | 111 | 2320889 | 13985.72 | 714 | 721 | 165.9 |
| C | 3 | 233 | 500745 | 3014.09 | 714 | 721 | 165.9 |
| C | 0 | 10 | 248103 | 1491.19 | 714 | 721 | 165.9 |
| D | 8 | 195 | 1021848 | 5398.95 | 723 | 709 | 189.1 |
| D | 7 | 223 | 964078 | 5093.51 | 723 | 709 | 189.1 |
| D | 12 | 218 | 532099 | 2809.56 | 723 | 709 | 189.1 |
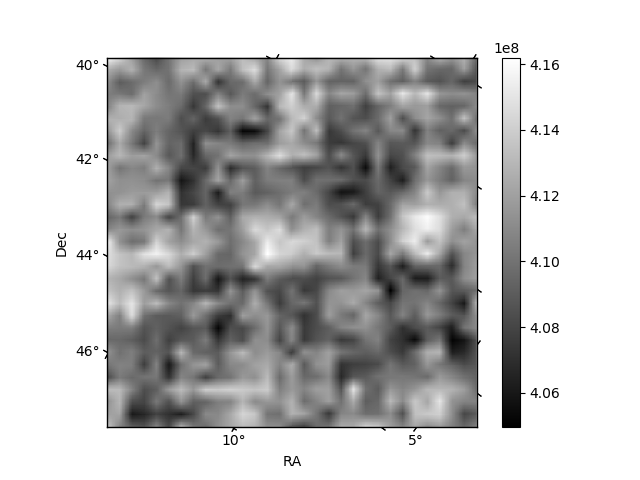
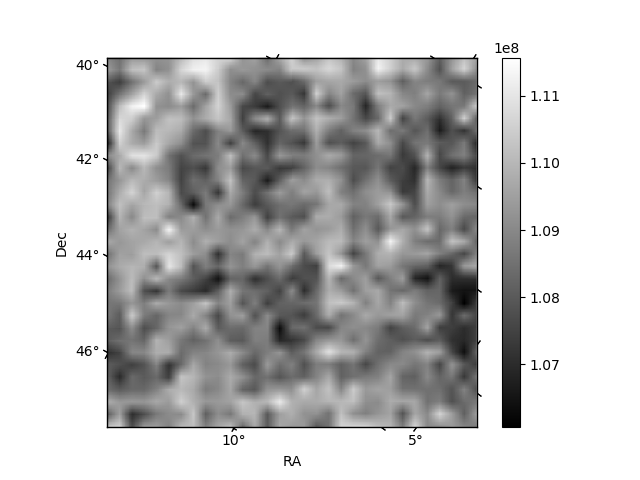
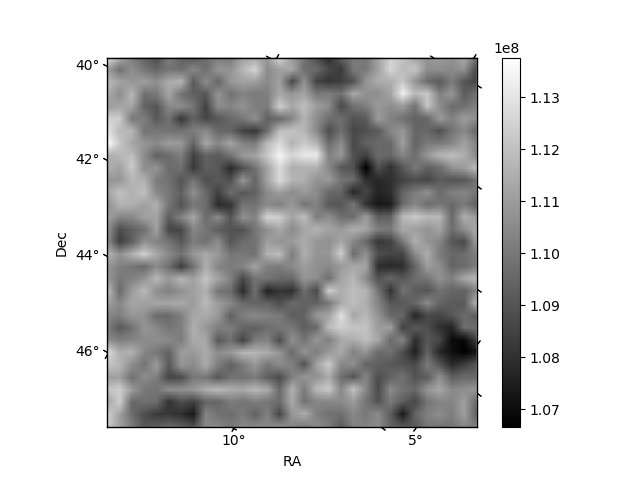
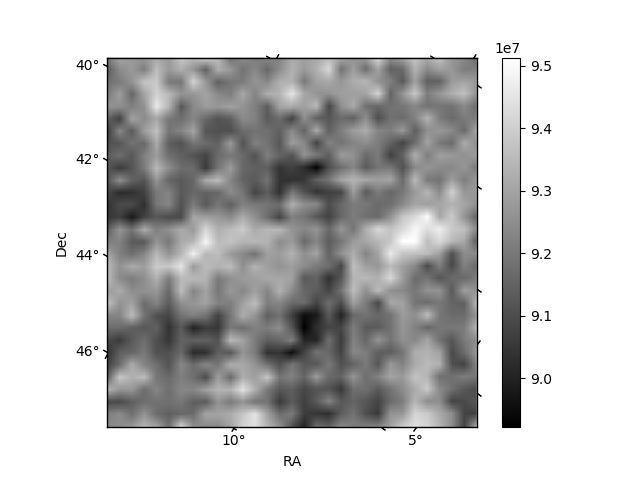
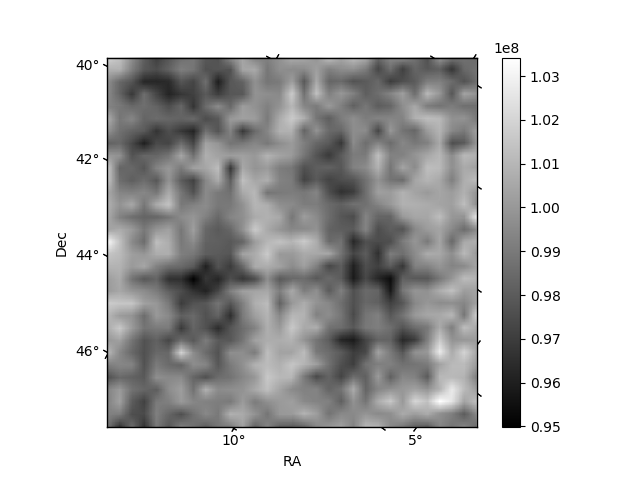
Histogram calculated using DETX and DETY for each event in the final _common_clean file
| Quadrant A | 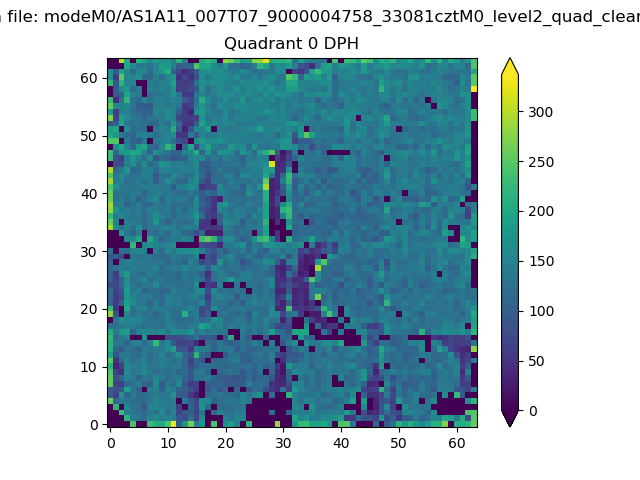 |
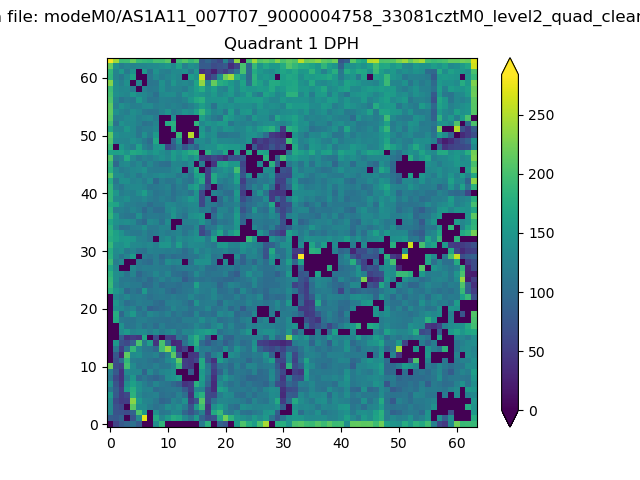 |
Quadrant B |
|---|---|---|---|
| Quadrant D | 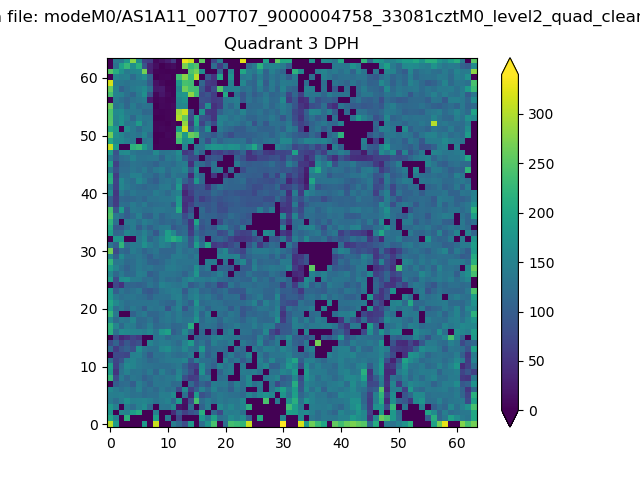 |
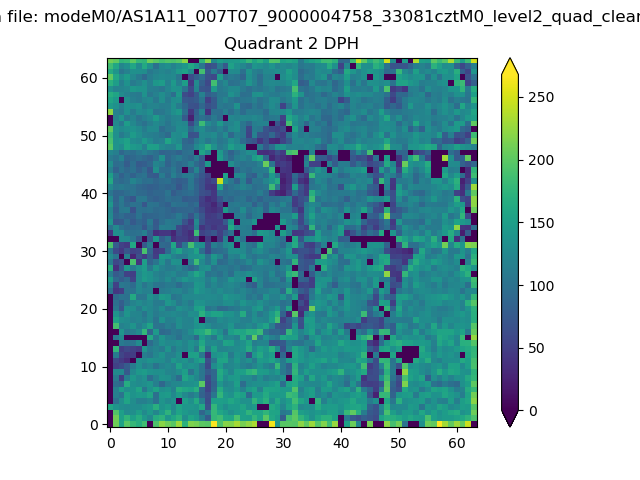 |
Quadrant C |
| Plot type | Count rate plots | Images |
|---|---|---|
| Comparison with Poisson distribution Blue bars denote a histogram of data divided into 1 sec bins. Red curve is a Poisson curve with rate = median count rate of data. |
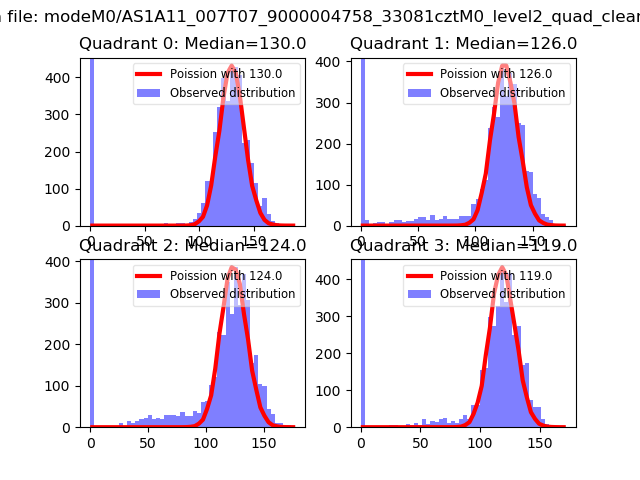 |
 |
| Quadrant-wise count rates Data is divided into 100 sec bins |
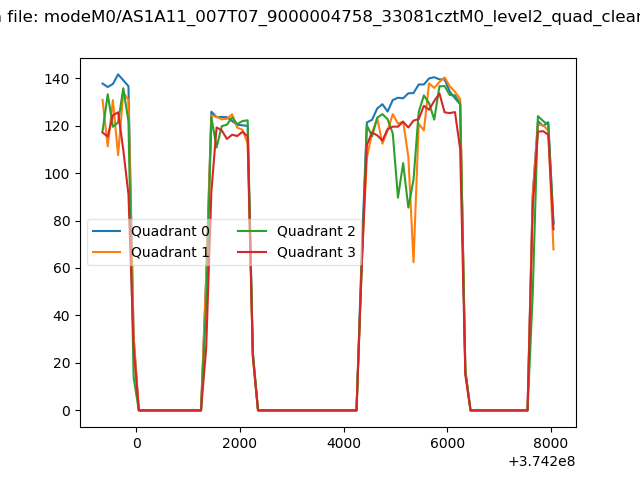 |
|
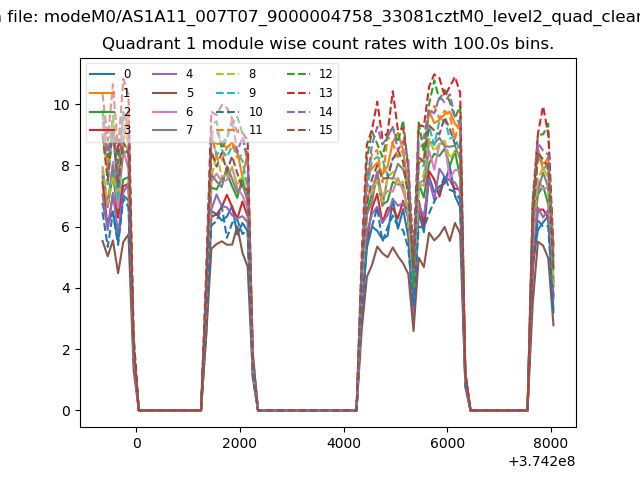
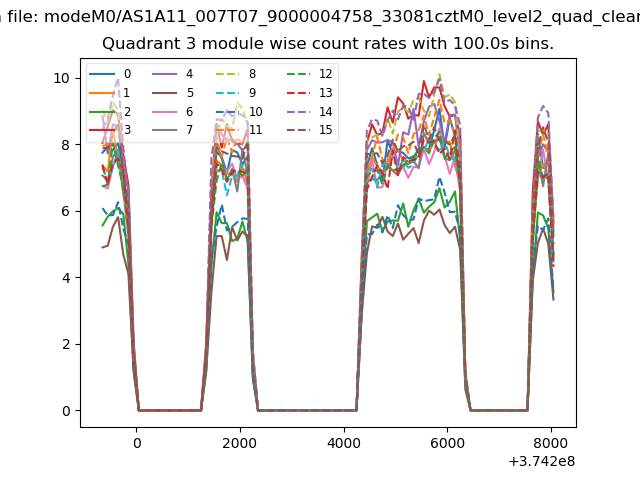
| Module-wise count rates for Quadrant A Data is divided into 100 sec bins |
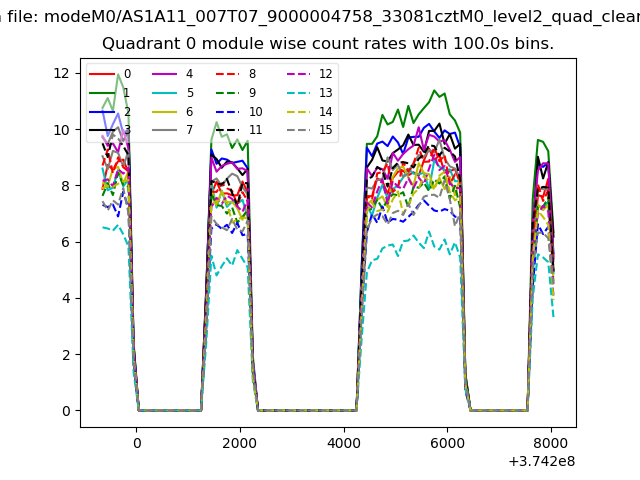 |
 |
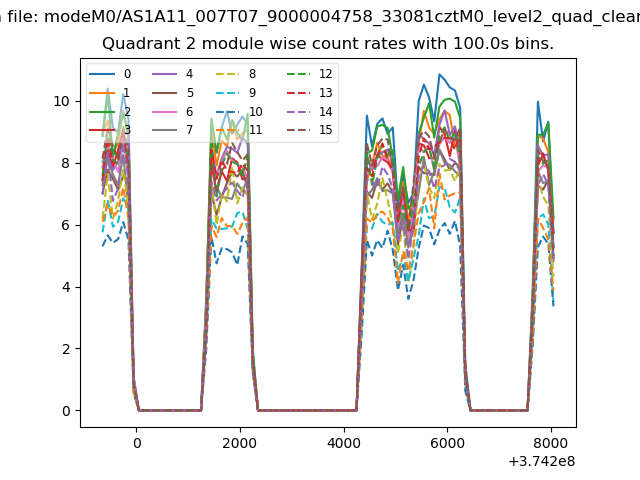
| Module-wise count rates for Quadrant B Data is divided into 100 sec bins |
 |
 |
| Module-wise count rates for Quadrant C Data is divided into 100 sec bins |
 |
 |
| Module-wise count rates for Quadrant D Data is divided into 100 sec bins |
 |
 |
| Parameter | Plot |
|---|---|
| CZT HV Monitor |  |
| D_VDD | 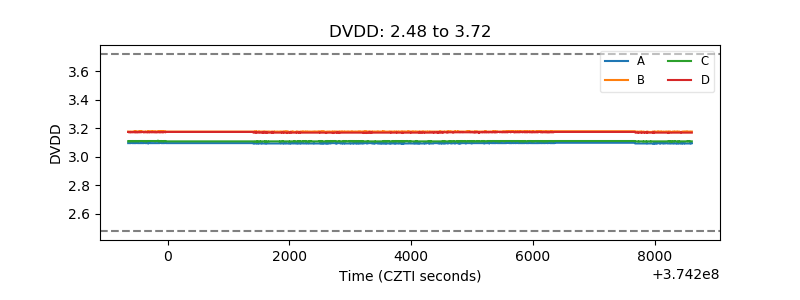 |
| Temperature 1 | 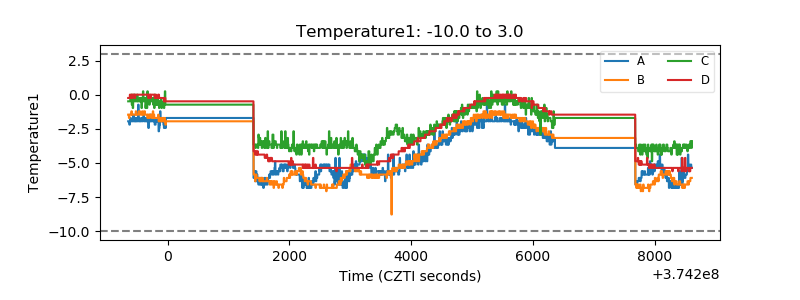 |
| Veto HV Monitor | 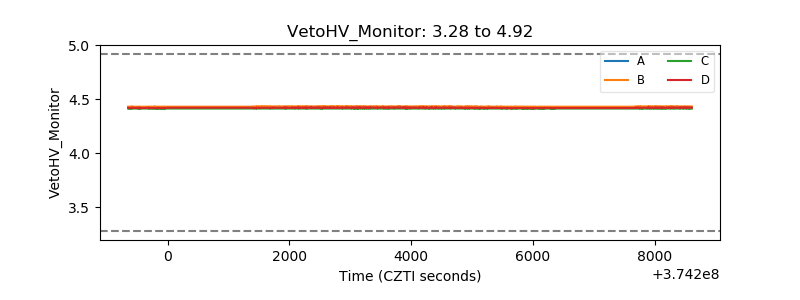 |
| Veto LLD | 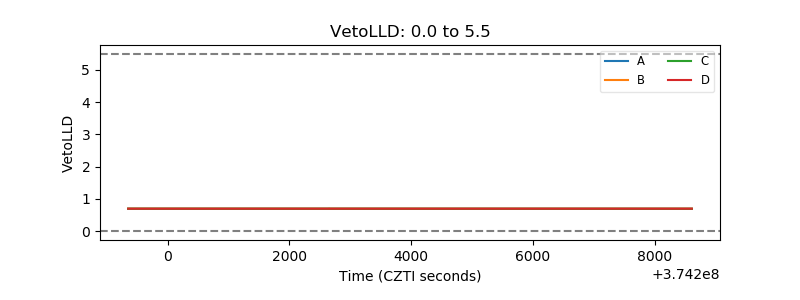 |
| Alpha Counter | 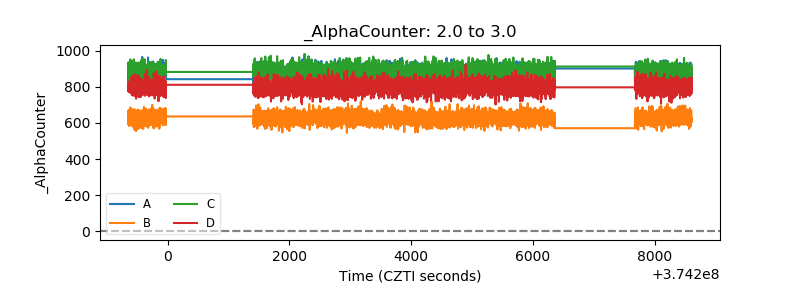 |
| _CPM_Rate | 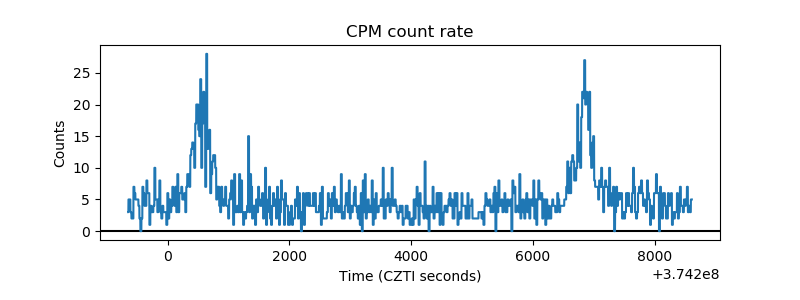 |
| CZT Counter | 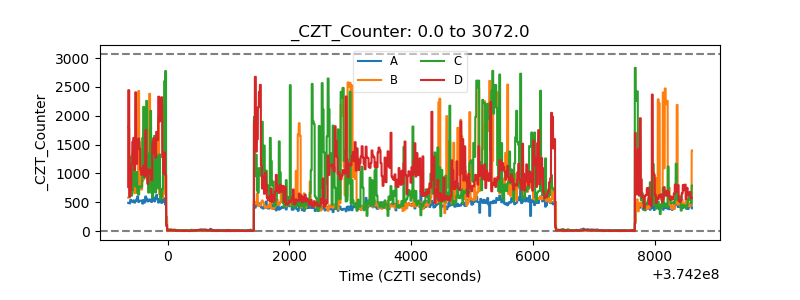 |
| +2.5 Volts monitor |  |
| +5 Volts monitor |  |
| _ROLL_ROT | 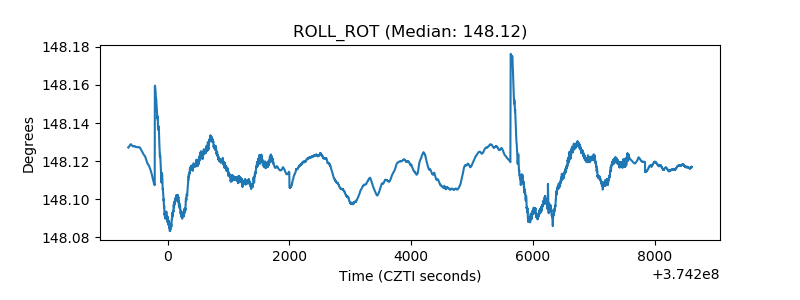 |
| _Roll_DEC | 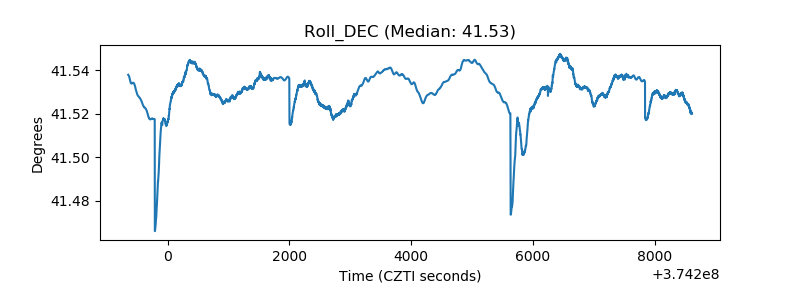 |
| _Roll_RA | 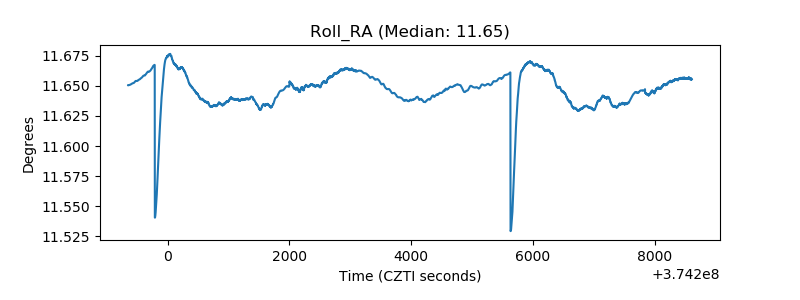 |
| Veto Counter | 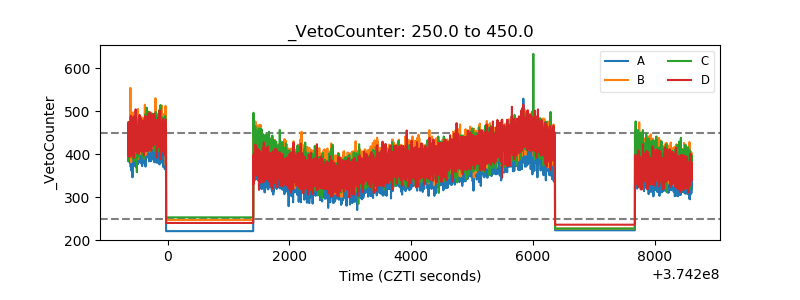 |