| Param | Original file | Final file |
|---|---|---|
| Filename | modeM0/AS1A11_007T07_9000004758_33084cztM0_level2.evt | modeM0/AS1A11_007T07_9000004758_33084cztM0_level2_quad_clean.evt |
| Size (bytes) | 444,821,760 | 57,516,480 |
| Size | 424.2 MB | 54.9 MB |
| Events in quadrant A | 2,258,727 | 363,796 |
| Events in quadrant B | 3,398,499 | 342,375 |
| Events in quadrant C | 3,608,596 | 350,258 |
| Events in quadrant D | 3,870,106 | 337,940 |
| Mode SS | |||
|---|---|---|---|
| Quadrant | BADHDUFLAG | Total packets | Discarded packets |
| A | 0 | 102 | 0 |
| B | 0 | 102 | 0 |
| C | 0 | 102 | 0 |
| D | 0 | 102 | 0 |
| Mode M0 | |||
|---|---|---|---|
| Quadrant | BADHDUFLAG | Total packets | Discarded packets |
| A | 0 | 9946 | 1 |
| B | 0 | 13392 | 1 |
| C | 0 | 14091 | 1 |
| D | 0 | 15105 | 1 |
| Mode M9 | |||
|---|---|---|---|
| Quadrant | BADHDUFLAG | Total packets | Discarded packets |
| A | 0 | 13 | 0 |
| B | 0 | 13 | 0 |
| C | 0 | 13 | 0 |
| D | 0 | 13 | 0 |
| Quadrant | Total seconds | Saturated seconds | Saturation percentage |
|---|---|---|---|
| A | 4940 | 5 | 0.101215% |
| B | 4940 | 356 | 7.206478% |
| C | 4940 | 214 | 4.331984% |
| D | 4940 | 125 | 2.530364% |
Noise dominated data is calculated using 1-second bins in cleaned event files. If a bin has >2000 counts, and if more than 50% of those come from <1% of pixels, then it is considered to be noise-dominated and hence unusable.
| Quadrant | # 1 sec bins | Bins with >0 counts | Bins with >2000 counts | High rate bins dominated by noise | Noise dominated (total time) | Noise dominated (detector-on time) | Marked lightcurve |
|---|---|---|---|---|---|---|---|
| A | 6253 | 4941 | 0 | 0 | 0.00% | 0.00% | 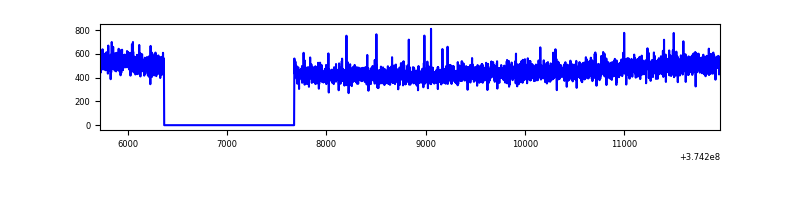 |
| B | 6253 | 4941 | 230 | 230 | 3.68% | 4.65% | 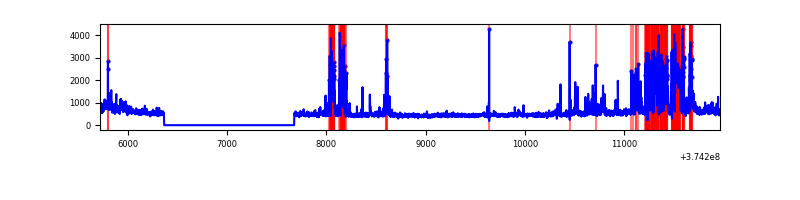 |
| C | 6253 | 4941 | 162 | 162 | 2.59% | 3.28% | 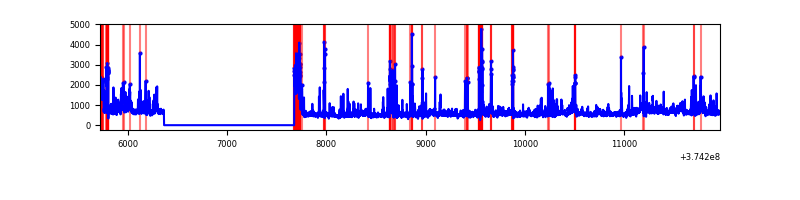 |
| D | 6253 | 4941 | 94 | 94 | 1.50% | 1.90% | 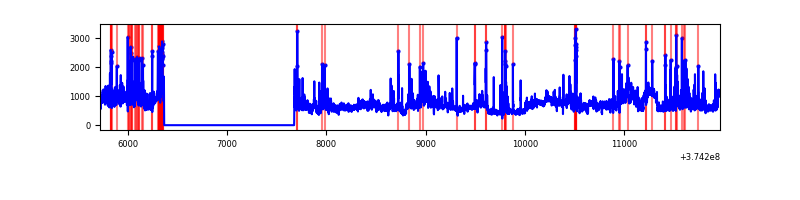 |
Top three noisy pixels from each quadrant. If the there are fewer than three noisy pixels in the level2.evt file, extra rows are filled as -1
| Pixel properties | Quadrant properties | ||||||
|---|---|---|---|---|---|---|---|
| Quadrant | DetID | PixID | Counts | Sigma | Mean | Median | Sigma |
| A | 13 | 254 | 10186 | 81.21 | 580 | 569 | 118.4 |
| A | 15 | 169 | 6115 | 46.83 | 580 | 569 | 118.4 |
| A | 3 | 137 | 5507 | 41.7 | 580 | 569 | 118.4 |
| B | 5 | 172 | 658718 | 6079.48 | 559 | 544 | 108.3 |
| B | 5 | 200 | 227237 | 2093.94 | 559 | 544 | 108.3 |
| B | 0 | 189 | 112415 | 1033.34 | 559 | 544 | 108.3 |
| C | 7 | 221 | 438055 | 3359.87 | 555 | 558 | 130.2 |
| C | 3 | 233 | 419450 | 3216.99 | 555 | 558 | 130.2 |
| C | 8 | 111 | 268439 | 2057.26 | 555 | 558 | 130.2 |
| D | 8 | 195 | 914596 | 6245.32 | 557 | 544 | 146.4 |
| D | 2 | 249 | 198552 | 1352.9 | 557 | 544 | 146.4 |
| D | 12 | 218 | 143662 | 977.86 | 557 | 544 | 146.4 |
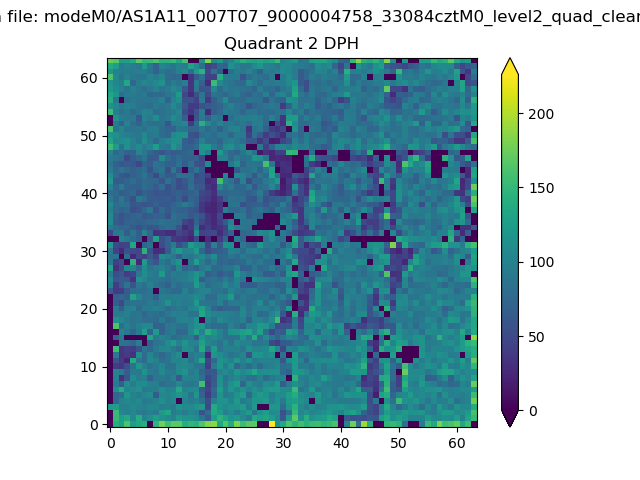
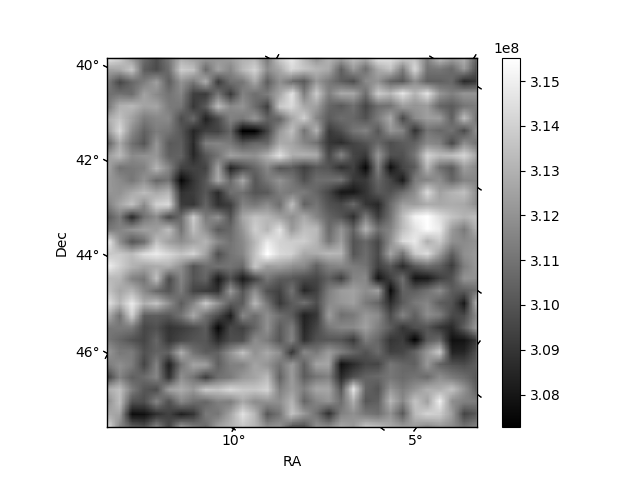
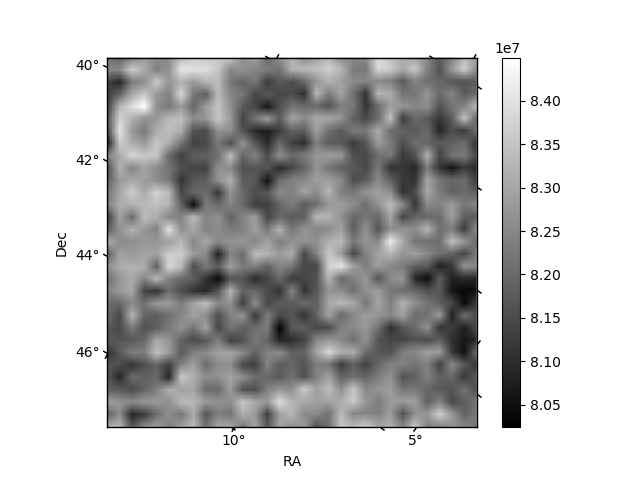
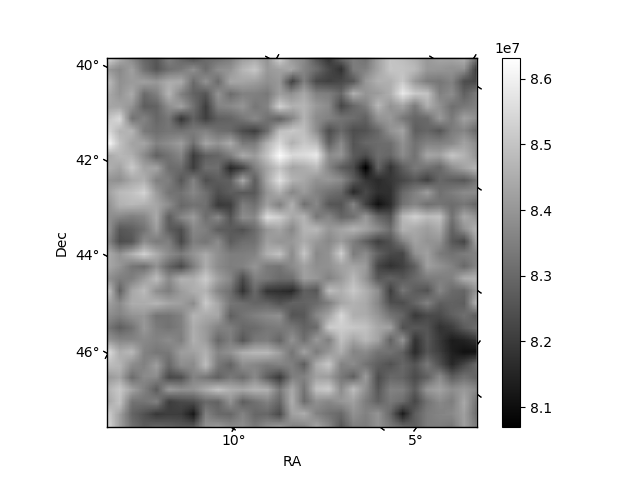
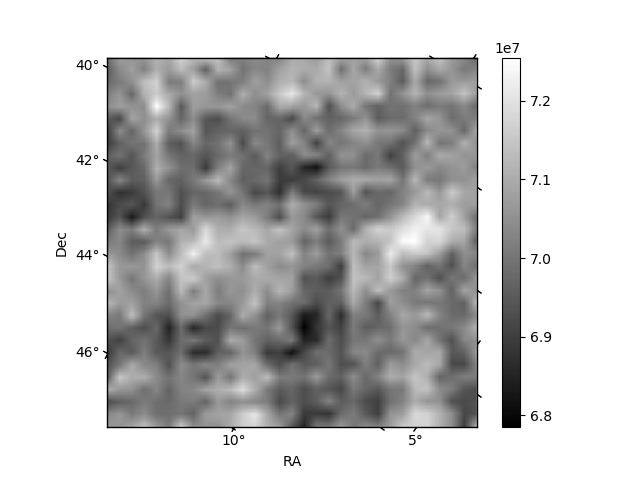
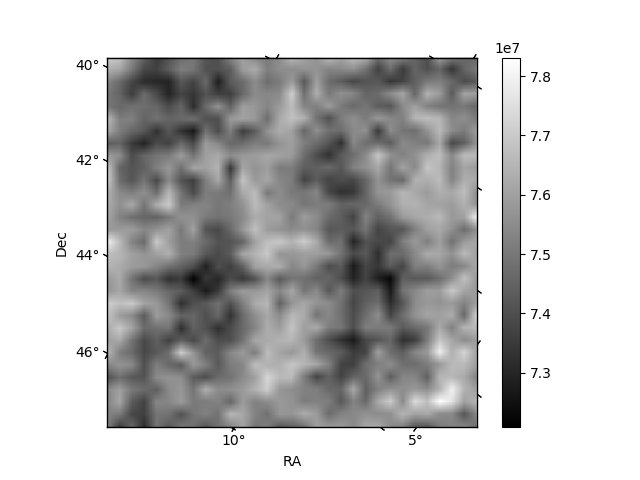
Histogram calculated using DETX and DETY for each event in the final _common_clean file
| Quadrant A | 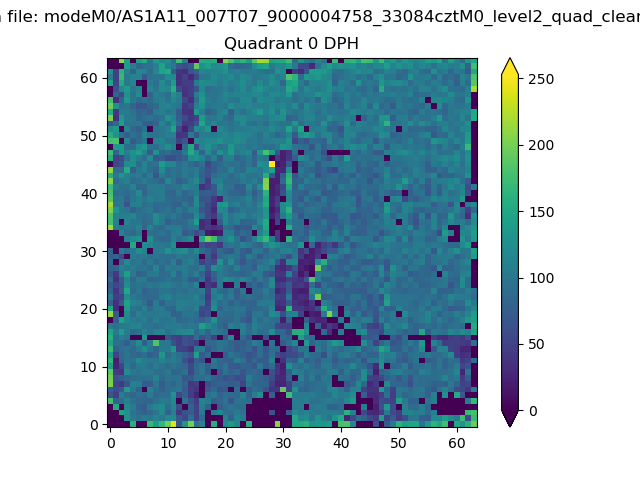 |
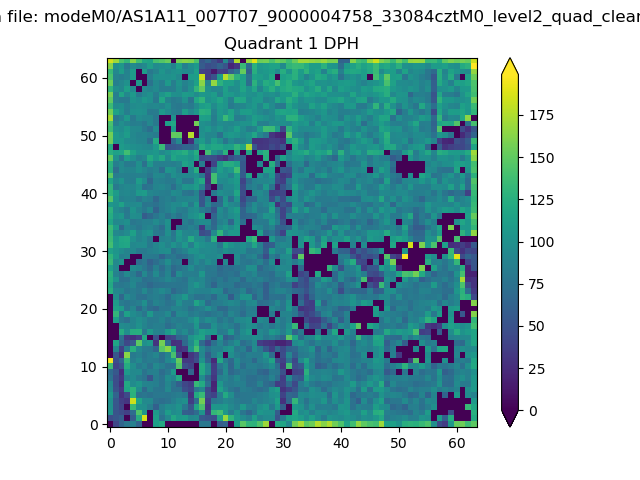 |
Quadrant B |
|---|---|---|---|
| Quadrant D | 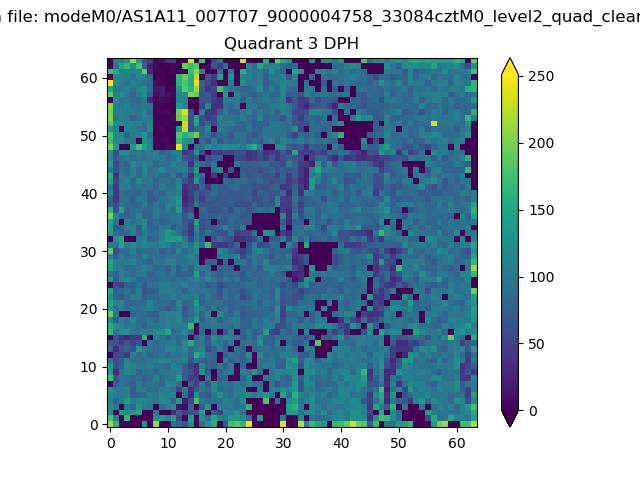 |
 |
Quadrant C |
| Plot type | Count rate plots | Images |
|---|---|---|
| Comparison with Poisson distribution Blue bars denote a histogram of data divided into 1 sec bins. Red curve is a Poisson curve with rate = median count rate of data. |
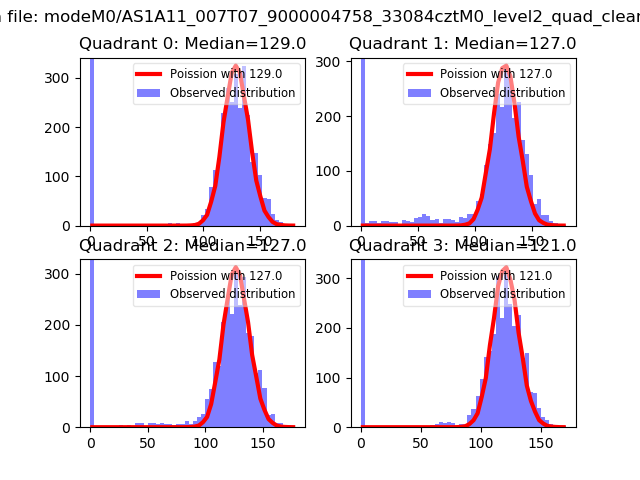 |
 |
| Quadrant-wise count rates Data is divided into 100 sec bins |
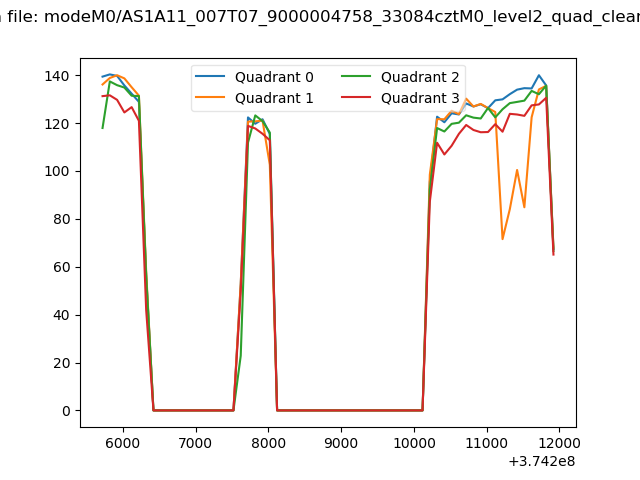 |
|
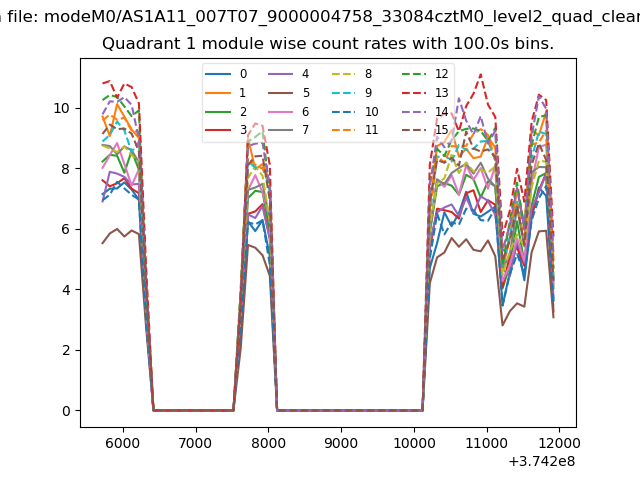
| Module-wise count rates for Quadrant A Data is divided into 100 sec bins |
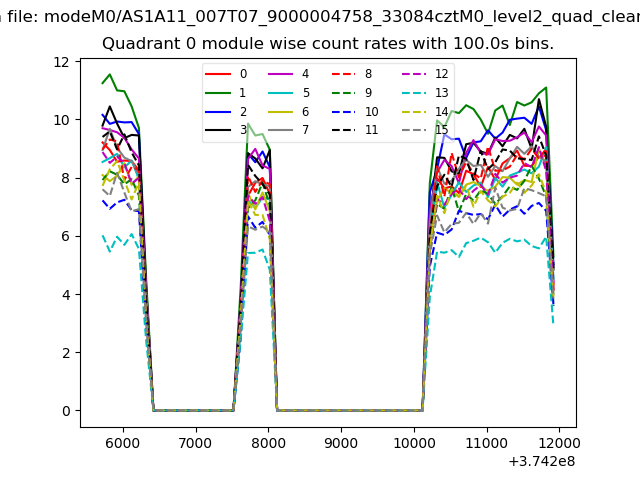 |
 |
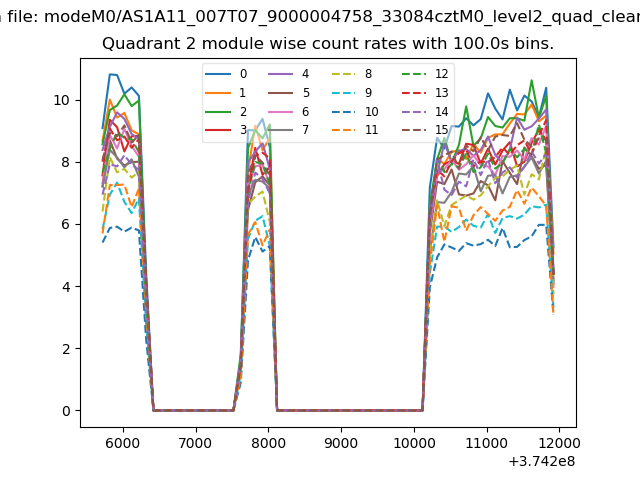
| Module-wise count rates for Quadrant B Data is divided into 100 sec bins |
 |
 |
| Module-wise count rates for Quadrant C Data is divided into 100 sec bins |
 |
 |
| Module-wise count rates for Quadrant D Data is divided into 100 sec bins |
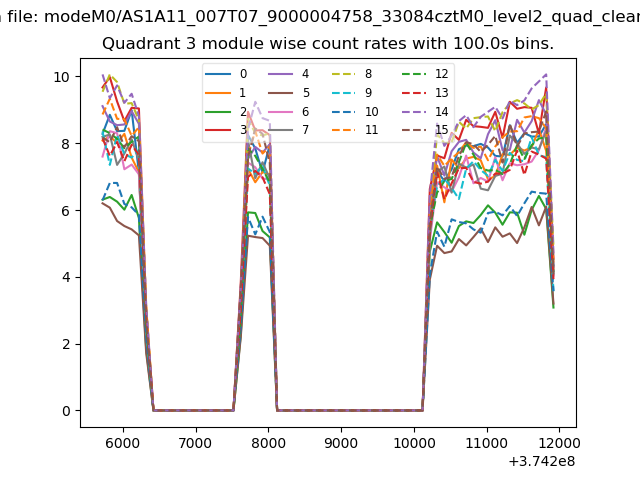 |
 |
| Parameter | Plot |
|---|---|
| CZT HV Monitor | 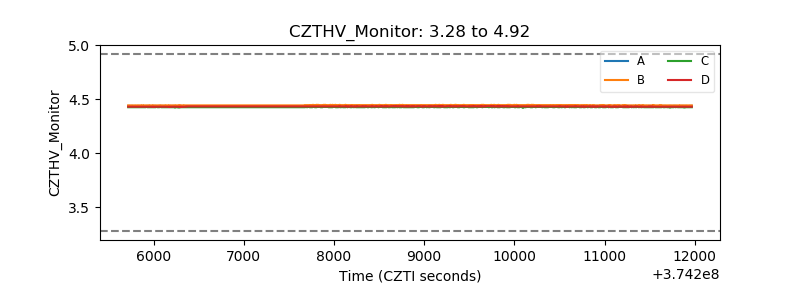 |
| D_VDD | 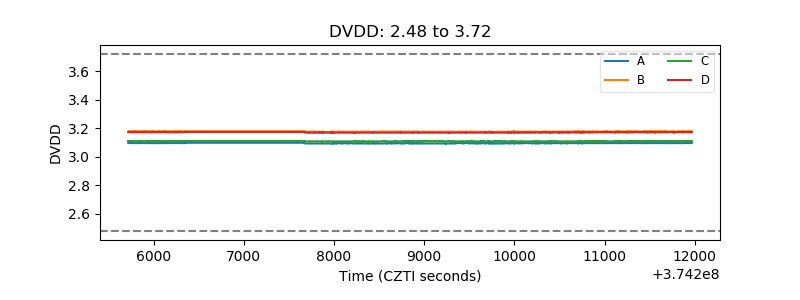 |
| Temperature 1 | 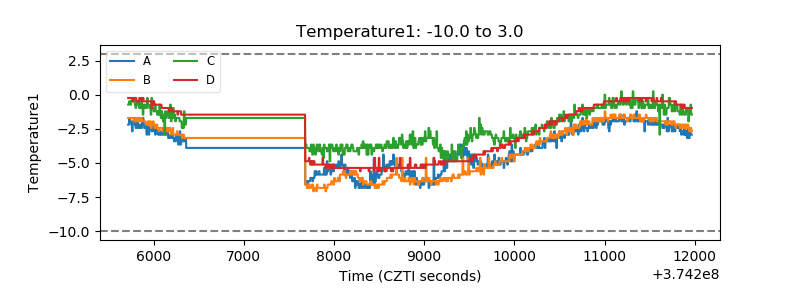 |
| Veto HV Monitor | 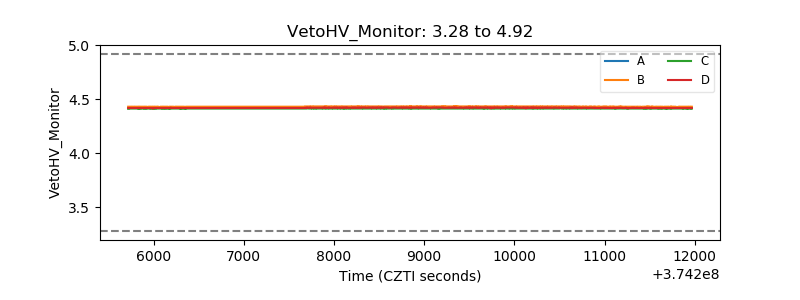 |
| Veto LLD | 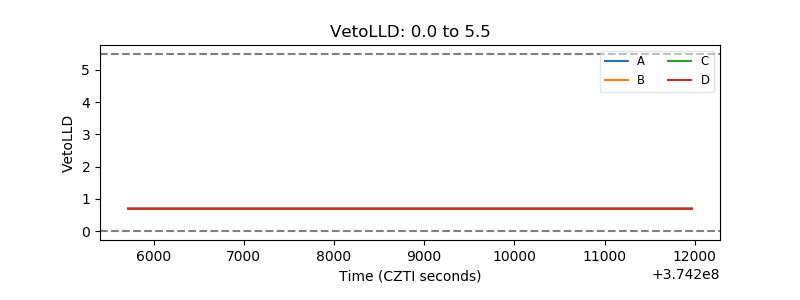 |
| Alpha Counter | 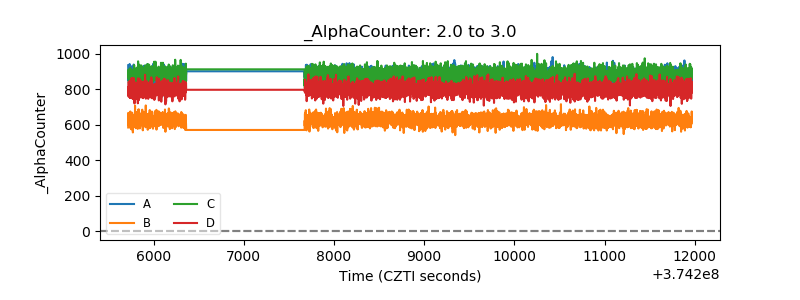 |
| _CPM_Rate | 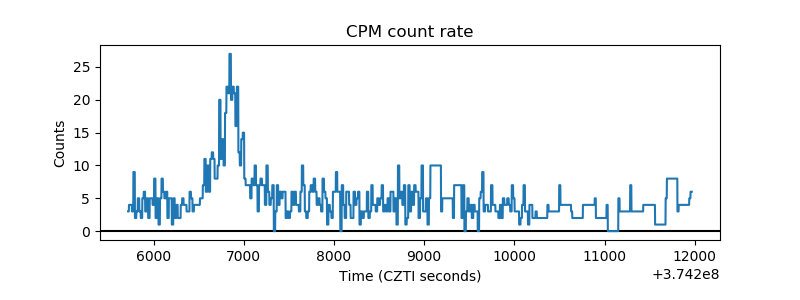 |
| CZT Counter | 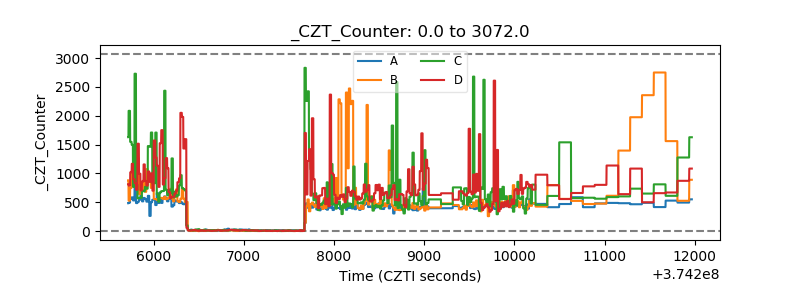 |
| +2.5 Volts monitor |  |
| +5 Volts monitor |  |
| _ROLL_ROT | 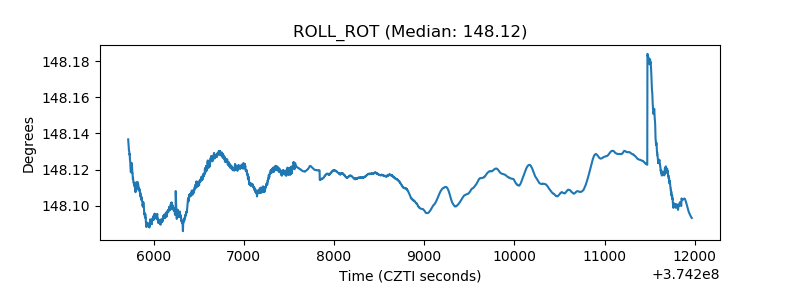 |
| _Roll_DEC |  |
| _Roll_RA | 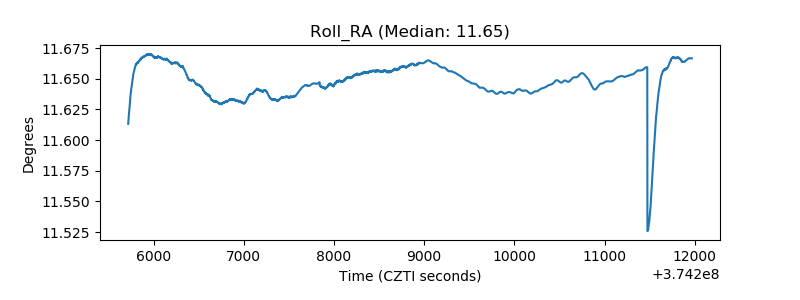 |
| Veto Counter | 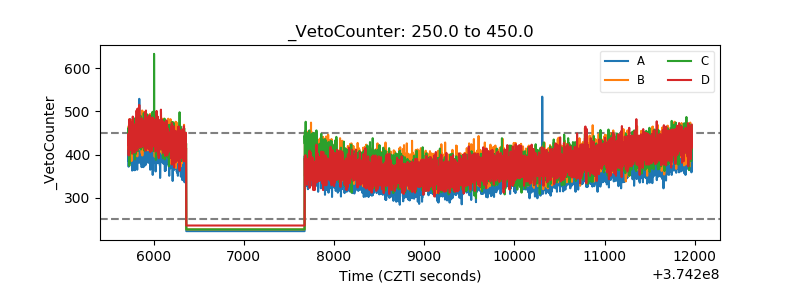 |