| Param | Original file | Final file |
|---|---|---|
| Filename | modeM0/AS1A11_008T06_9000004762_33094cztM0_level2.evt | modeM0/AS1A11_008T06_9000004762_33094cztM0_level2_quad_clean.evt |
| Size (bytes) | 370,031,040 | 36,178,560 |
| Size | 352.9 MB | 34.5 MB |
| Events in quadrant A | 1,621,678 | 230,496 |
| Events in quadrant B | 2,240,222 | 212,685 |
| Events in quadrant C | 2,013,836 | 224,061 |
| Events in quadrant D | 5,094,521 | 181,295 |
| Mode M9 | |||
|---|---|---|---|
| Quadrant | BADHDUFLAG | Total packets | Discarded packets |
| A | 0 | 15 | 0 |
| B | 0 | 15 | 0 |
| C | 0 | 15 | 0 |
| D | 0 | 15 | 0 |
| Mode SS | |||
|---|---|---|---|
| Quadrant | BADHDUFLAG | Total packets | Discarded packets |
| A | 0 | 72 | 0 |
| B | 0 | 72 | 0 |
| C | 0 | 72 | 0 |
| D | 0 | 72 | 0 |
| Mode M0 | |||
|---|---|---|---|
| Quadrant | BADHDUFLAG | Total packets | Discarded packets |
| A | 0 | 7029 | 2 |
| B | 0 | 8882 | 1 |
| C | 0 | 8203 | 1 |
| D | 0 | 17572 | 1 |
| Quadrant | Total seconds | Saturated seconds | Saturation percentage |
|---|---|---|---|
| A | 3467 | 4 | 0.115374% |
| B | 3467 | 246 | 7.095472% |
| C | 3467 | 76 | 2.192097% |
| D | 3467 | 871 | 25.122584% |
Noise dominated data is calculated using 1-second bins in cleaned event files. If a bin has >2000 counts, and if more than 50% of those come from <1% of pixels, then it is considered to be noise-dominated and hence unusable.
| Quadrant | # 1 sec bins | Bins with >0 counts | Bins with >2000 counts | High rate bins dominated by noise | Noise dominated (total time) | Noise dominated (detector-on time) | Marked lightcurve |
|---|---|---|---|---|---|---|---|
| A | 5050 | 3468 | 0 | 0 | 0.00% | 0.00% | 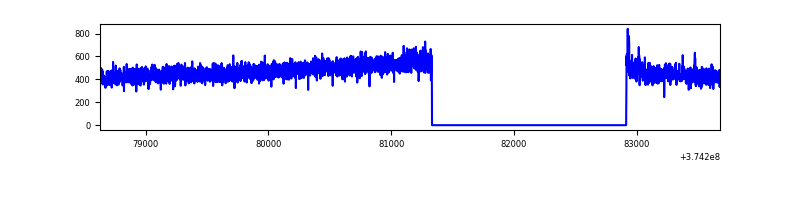 |
| B | 5050 | 3468 | 158 | 158 | 3.13% | 4.56% | 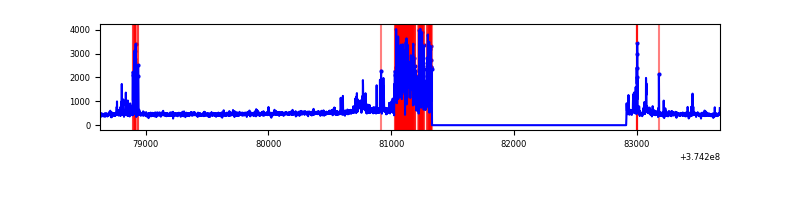 |
| C | 5050 | 3468 | 62 | 62 | 1.23% | 1.79% | 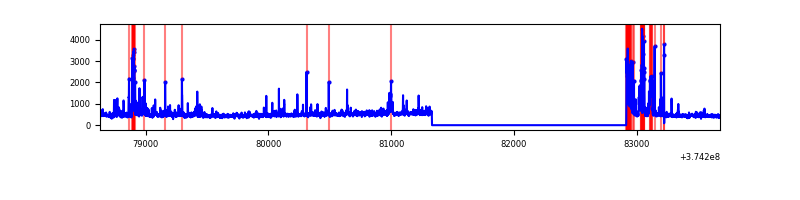 |
| D | 5050 | 3468 | 824 | 824 | 16.32% | 23.76% | 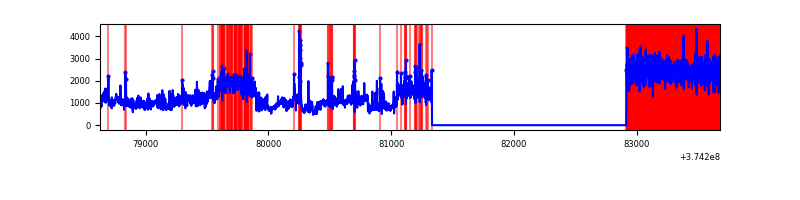 |
Top three noisy pixels from each quadrant. If the there are fewer than three noisy pixels in the level2.evt file, extra rows are filled as -1
| Pixel properties | Quadrant properties | ||||||
|---|---|---|---|---|---|---|---|
| Quadrant | DetID | PixID | Counts | Sigma | Mean | Median | Sigma |
| A | 13 | 254 | 6551 | 72.79 | 415 | 405 | 84.4 |
| A | 15 | 169 | 6024 | 66.55 | 415 | 405 | 84.4 |
| A | 13 | 6 | 5097 | 55.57 | 415 | 405 | 84.4 |
| B | 5 | 172 | 533328 | 6895.72 | 397 | 387 | 77.3 |
| B | 0 | 189 | 42496 | 544.85 | 397 | 387 | 77.3 |
| B | 5 | 200 | 24904 | 317.23 | 397 | 387 | 77.3 |
| C | 1 | 23 | 132832 | 1427.34 | 396 | 398 | 92.8 |
| C | 8 | 111 | 115772 | 1243.47 | 396 | 398 | 92.8 |
| C | 0 | 10 | 78572 | 842.54 | 396 | 398 | 92.8 |
| D | 7 | 223 | 2102840 | 21682.86 | 369 | 361 | 97.0 |
| D | 8 | 195 | 846099 | 8722.09 | 369 | 361 | 97.0 |
| D | 2 | 120 | 347428 | 3579.3 | 369 | 361 | 97.0 |
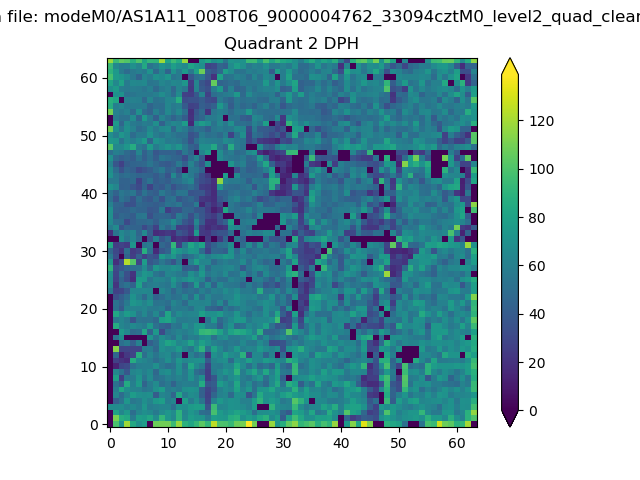
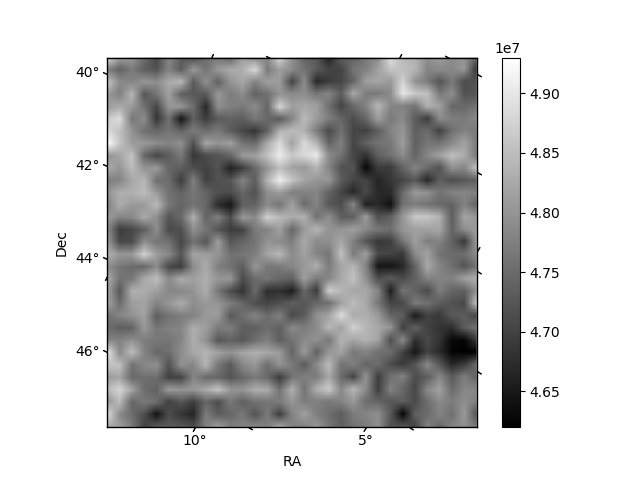
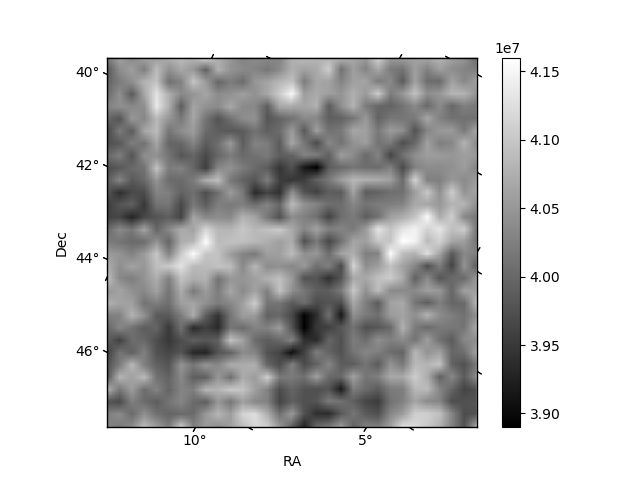
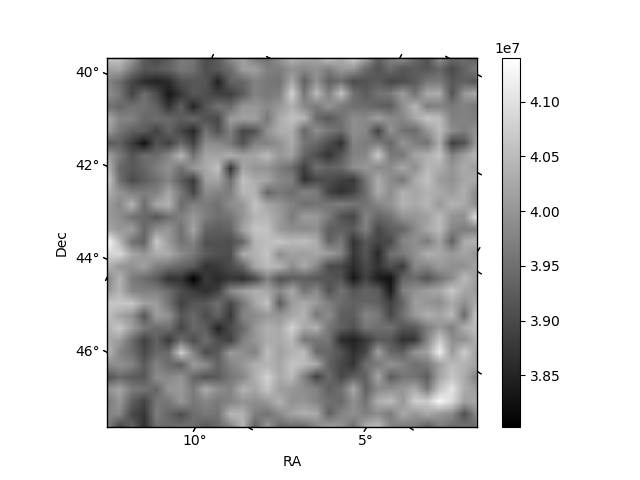
Histogram calculated using DETX and DETY for each event in the final _common_clean file
| Quadrant A | 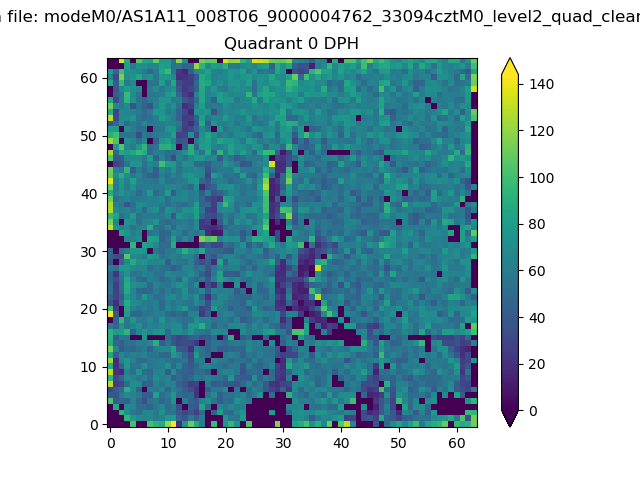 |
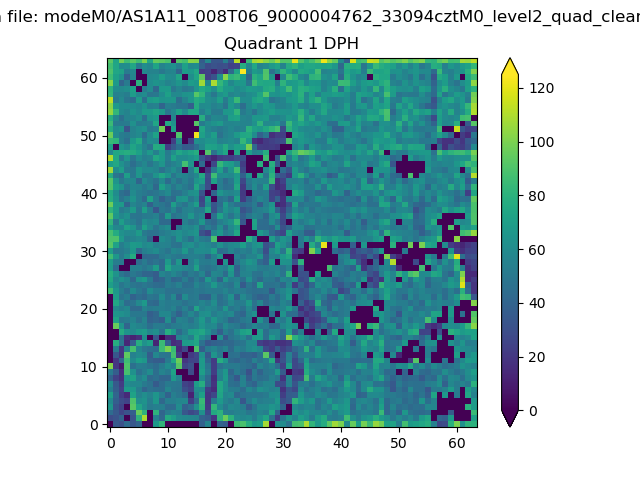 |
Quadrant B |
|---|---|---|---|
| Quadrant D | 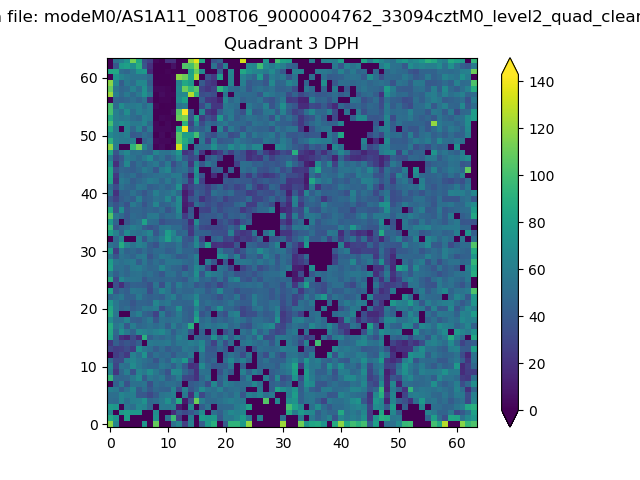 |
 |
Quadrant C |
| Plot type | Count rate plots | Images |
|---|---|---|
| Comparison with Poisson distribution Blue bars denote a histogram of data divided into 1 sec bins. Red curve is a Poisson curve with rate = median count rate of data. |
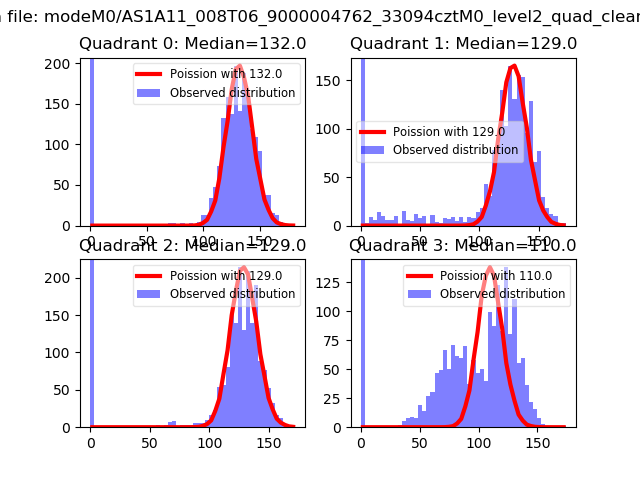 |
 |
| Quadrant-wise count rates Data is divided into 100 sec bins |
 |
|
| Module-wise count rates for Quadrant A Data is divided into 100 sec bins |
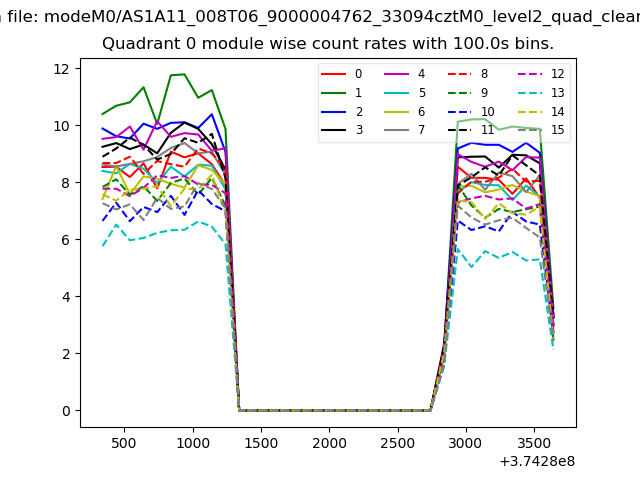 |
 |
| Module-wise count rates for Quadrant B Data is divided into 100 sec bins |
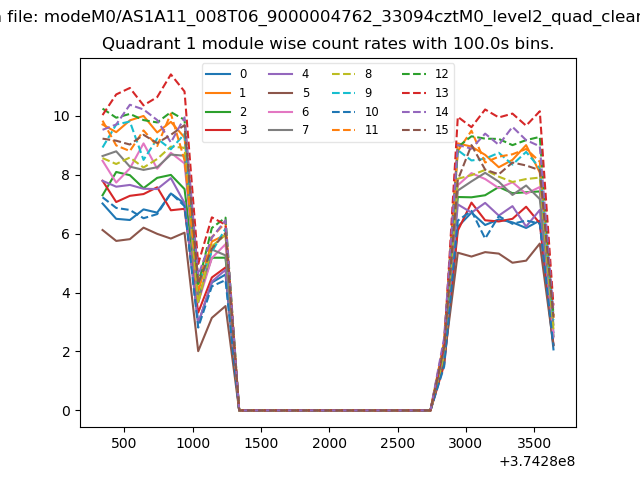 |
 |
| Module-wise count rates for Quadrant C Data is divided into 100 sec bins |
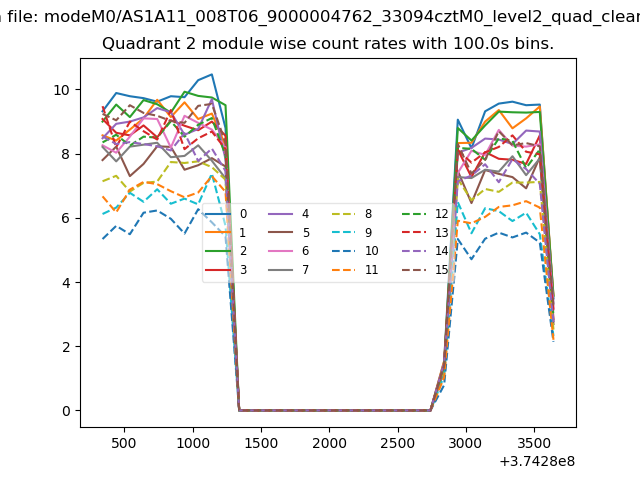 |
 |
| Module-wise count rates for Quadrant D Data is divided into 100 sec bins |
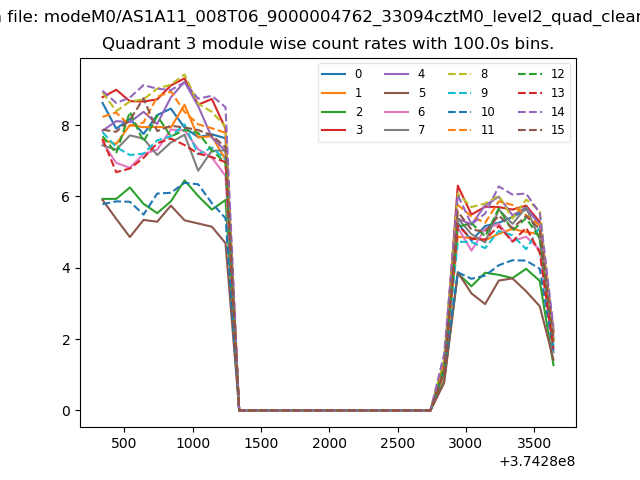 |
 |
| Parameter | Plot |
|---|---|
| CZT HV Monitor |  |
| D_VDD | 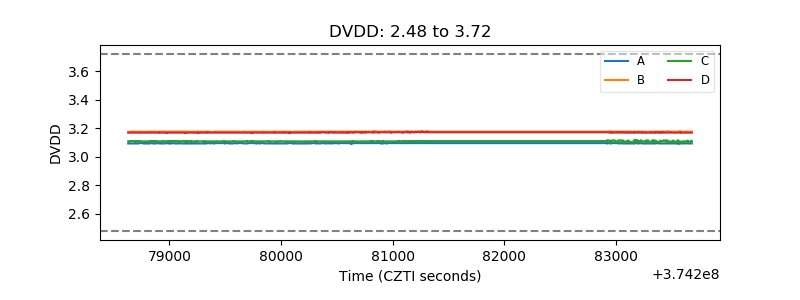 |
| Temperature 1 | 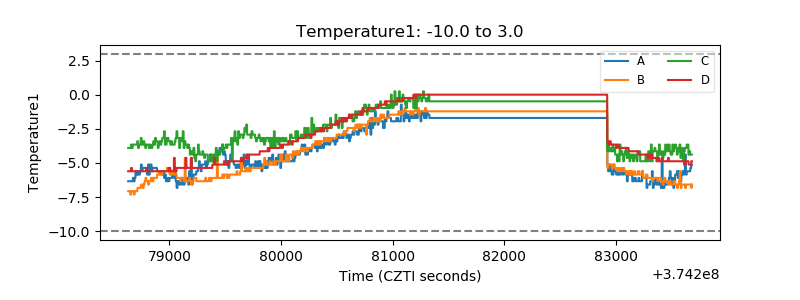 |
| Veto HV Monitor | 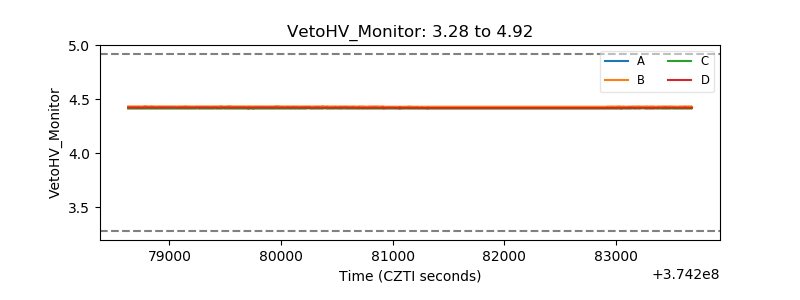 |
| Veto LLD | 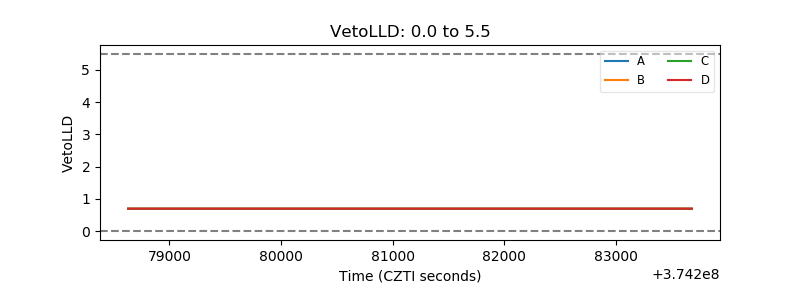 |
| Alpha Counter | 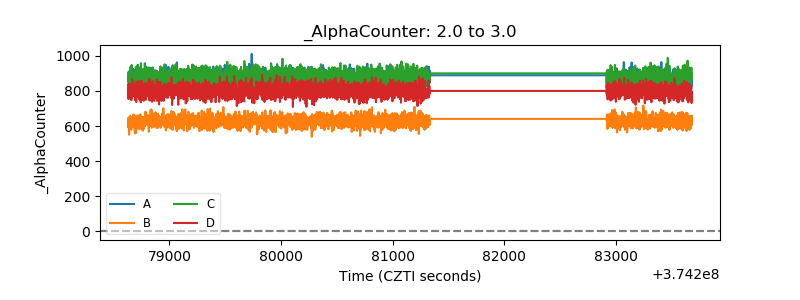 |
| _CPM_Rate | 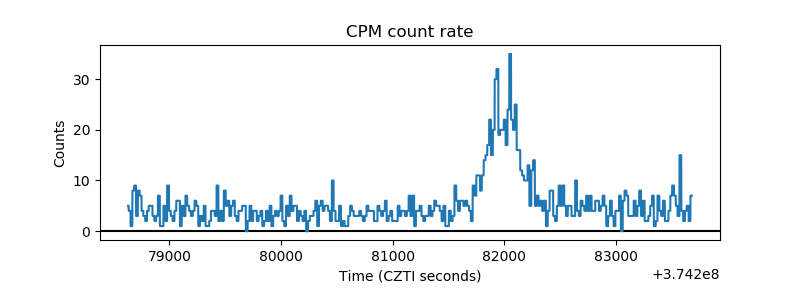 |
| CZT Counter |  |
| +2.5 Volts monitor |  |
| +5 Volts monitor |  |
| _ROLL_ROT | 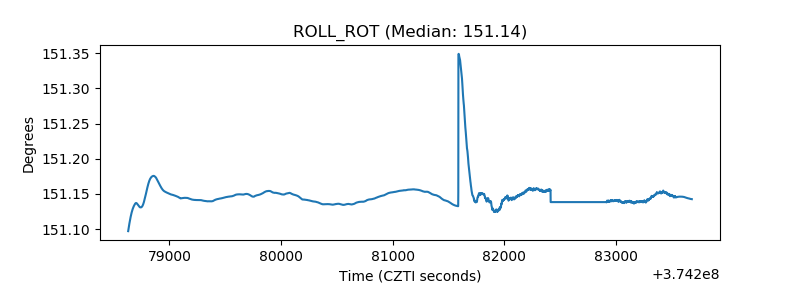 |
| _Roll_DEC | 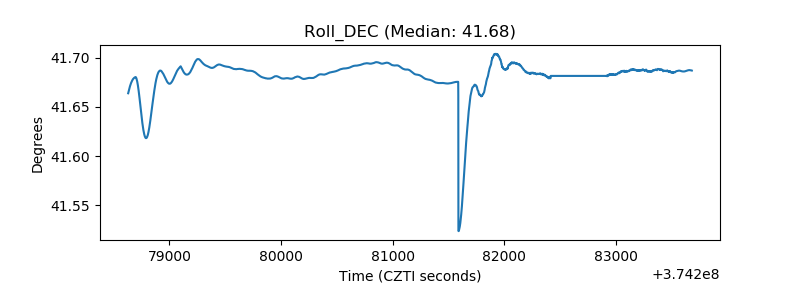 |
| _Roll_RA |  |
| Veto Counter | 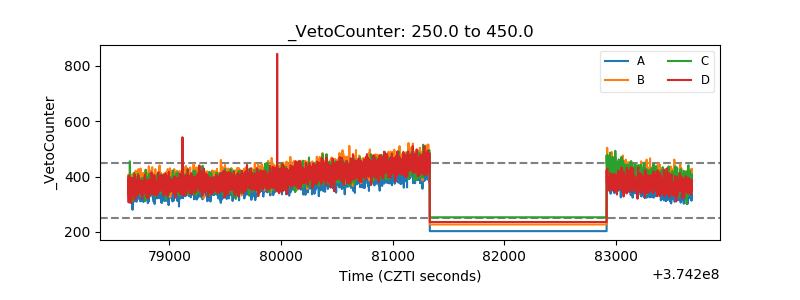 |