| Param | Original file | Final file |
|---|---|---|
| Filename | modeM0/AS1A11_008T06_9000004762_33095cztM0_level2.evt | modeM0/AS1A11_008T06_9000004762_33095cztM0_level2_quad_clean.evt |
| Size (bytes) | 669,991,680 | 69,514,560 |
| Size | 639.0 MB | 66.3 MB |
| Events in quadrant A | 2,657,125 | 456,790 |
| Events in quadrant B | 3,895,253 | 436,416 |
| Events in quadrant C | 3,335,346 | 447,314 |
| Events in quadrant D | 10,004,380 | 351,522 |
| Mode M9 | |||
|---|---|---|---|
| Quadrant | BADHDUFLAG | Total packets | Discarded packets |
| A | 0 | 28 | 0 |
| B | 0 | 28 | 0 |
| C | 0 | 28 | 0 |
| D | 0 | 28 | 0 |
| Mode SS | |||
|---|---|---|---|
| Quadrant | BADHDUFLAG | Total packets | Discarded packets |
| A | 0 | 124 | 0 |
| B | 0 | 124 | 0 |
| C | 0 | 124 | 0 |
| D | 0 | 124 | 0 |
| Mode M0 | |||
|---|---|---|---|
| Quadrant | BADHDUFLAG | Total packets | Discarded packets |
| A | 0 | 11895 | 3 |
| B | 0 | 15590 | 2 |
| C | 0 | 13956 | 2 |
| D | 0 | 33783 | 2 |
| Quadrant | Total seconds | Saturated seconds | Saturation percentage |
|---|---|---|---|
| A | 5884 | 8 | 0.135962% |
| B | 5884 | 409 | 6.951054% |
| C | 5884 | 137 | 2.328348% |
| D | 5884 | 2320 | 39.428960% |
Noise dominated data is calculated using 1-second bins in cleaned event files. If a bin has >2000 counts, and if more than 50% of those come from <1% of pixels, then it is considered to be noise-dominated and hence unusable.
| Quadrant | # 1 sec bins | Bins with >0 counts | Bins with >2000 counts | High rate bins dominated by noise | Noise dominated (total time) | Noise dominated (detector-on time) | Marked lightcurve |
|---|---|---|---|---|---|---|---|
| A | 8809 | 5886 | 1 | 1 | 0.01% | 0.02% | 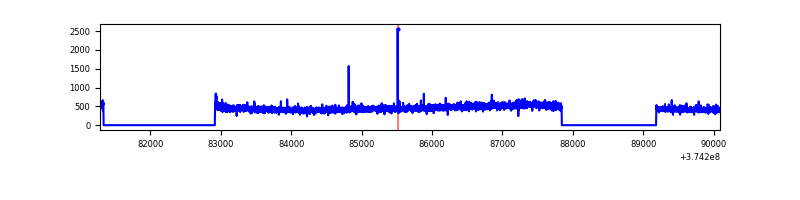 |
| B | 8809 | 5886 | 262 | 262 | 2.97% | 4.45% | 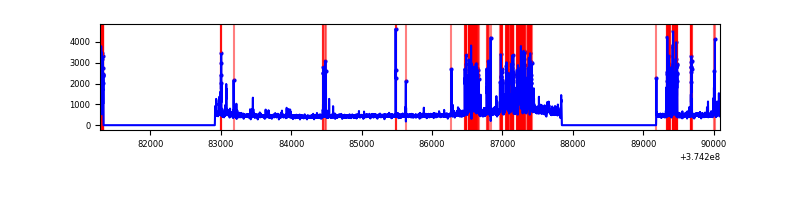 |
| C | 8809 | 5886 | 103 | 103 | 1.17% | 1.75% | 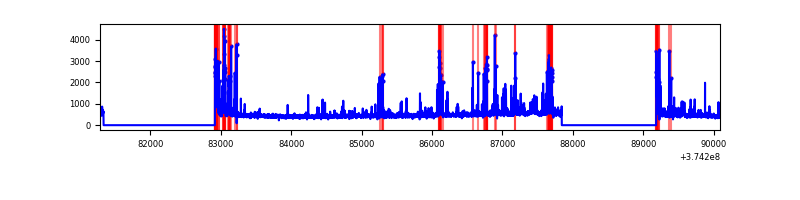 |
| D | 8809 | 5886 | 2198 | 2198 | 24.95% | 37.34% | 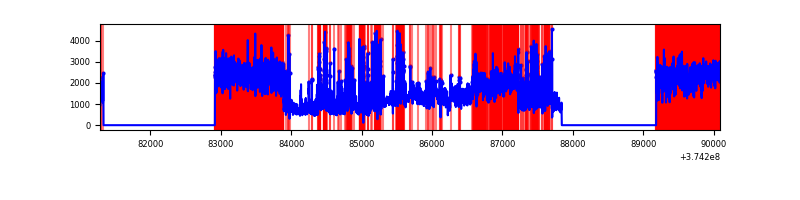 |
Top three noisy pixels from each quadrant. If the there are fewer than three noisy pixels in the level2.evt file, extra rows are filled as -1
| Pixel properties | Quadrant properties | ||||||
|---|---|---|---|---|---|---|---|
| Quadrant | DetID | PixID | Counts | Sigma | Mean | Median | Sigma |
| A | 13 | 254 | 11600 | 78.98 | 681 | 667 | 138.4 |
| A | 15 | 169 | 9940 | 66.99 | 681 | 667 | 138.4 |
| A | 13 | 6 | 7329 | 48.13 | 681 | 667 | 138.4 |
| B | 5 | 172 | 792925 | 6289.42 | 661 | 645 | 126.0 |
| B | 5 | 200 | 216088 | 1710.27 | 661 | 645 | 126.0 |
| B | 0 | 189 | 116834 | 922.35 | 661 | 645 | 126.0 |
| C | 8 | 111 | 214524 | 1406.7 | 657 | 663 | 152.0 |
| C | 7 | 221 | 197943 | 1297.64 | 657 | 663 | 152.0 |
| C | 0 | 10 | 142702 | 934.28 | 657 | 663 | 152.0 |
| D | 7 | 223 | 5162092 | 33287.09 | 588 | 576 | 155.1 |
| D | 8 | 195 | 1038291 | 6692.32 | 588 | 576 | 155.1 |
| D | 12 | 218 | 635152 | 4092.44 | 588 | 576 | 155.1 |
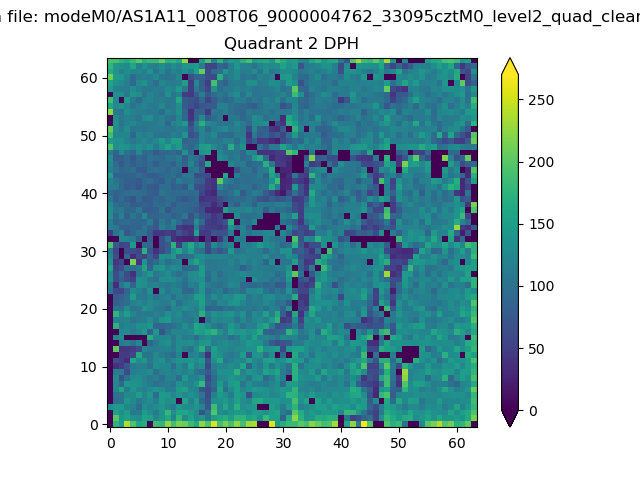
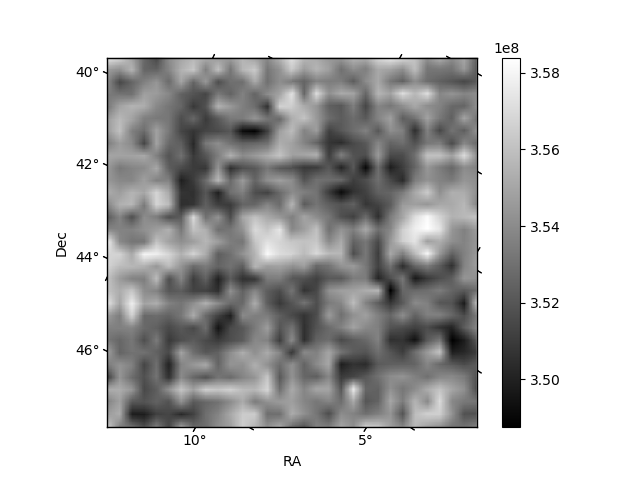
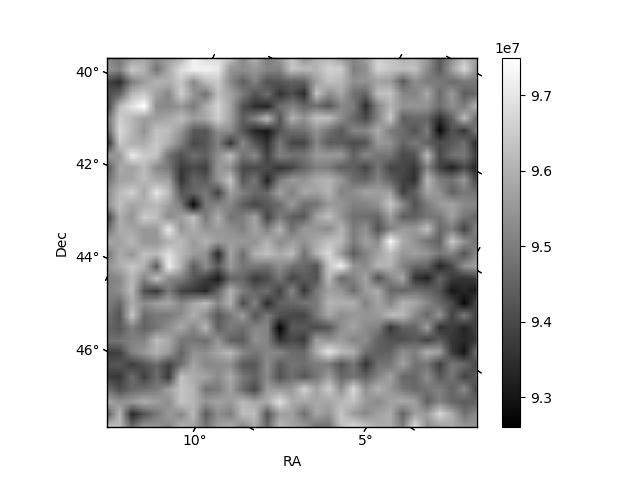
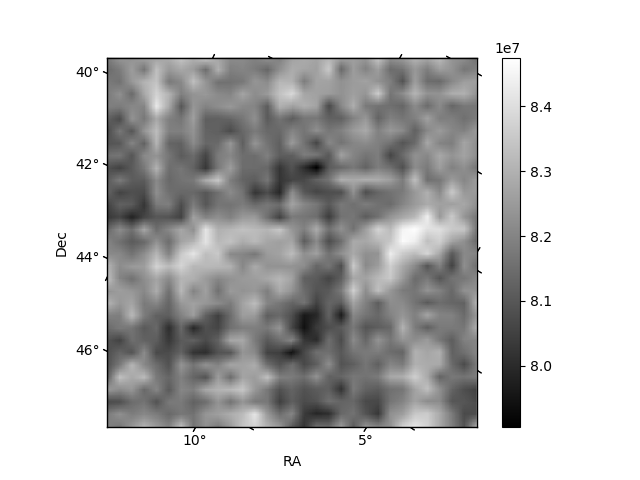
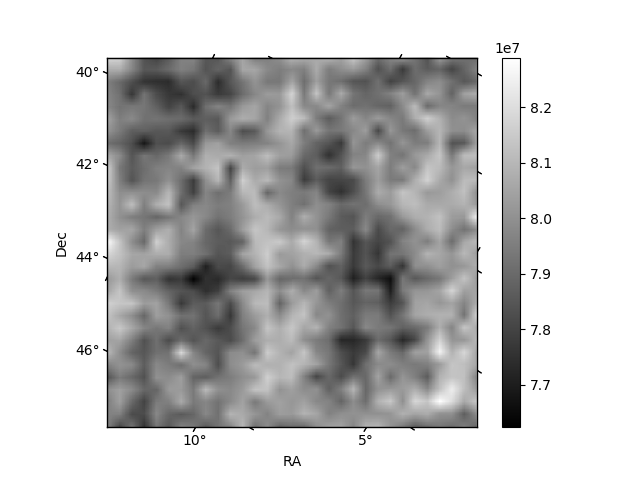
Histogram calculated using DETX and DETY for each event in the final _common_clean file
| Quadrant A | 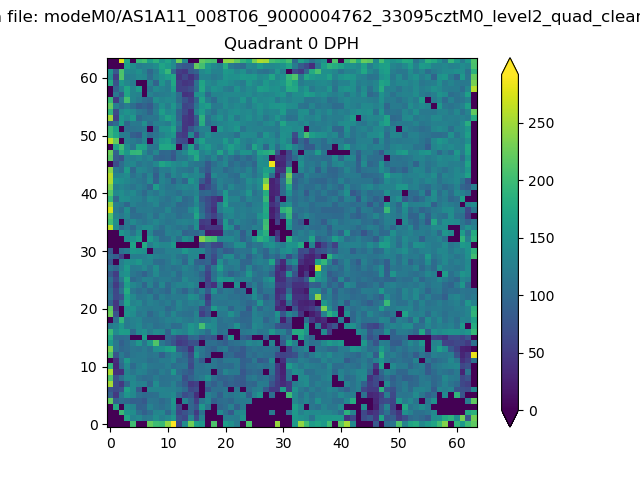 |
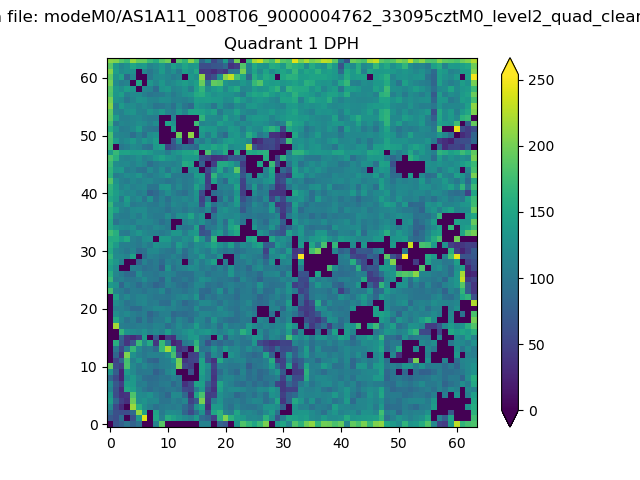 |
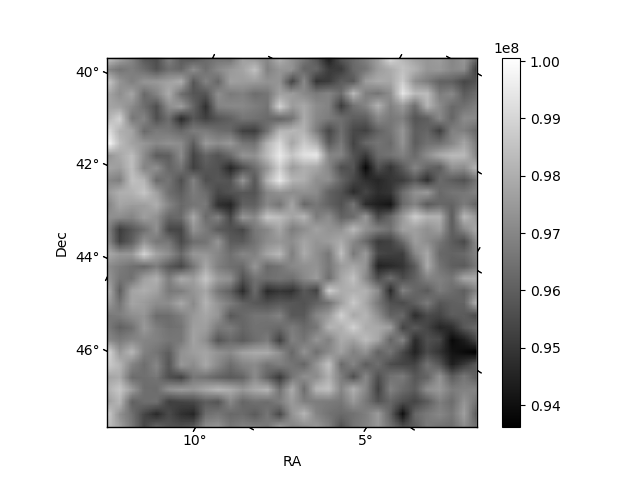
Quadrant B |
|---|---|---|---|
| Quadrant D | 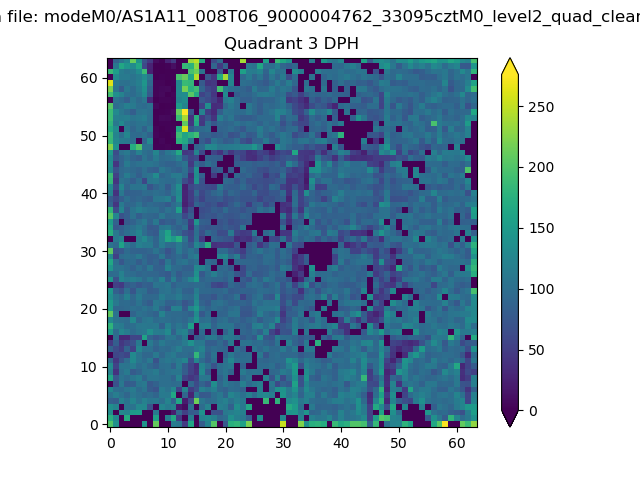 |
 |
Quadrant C |
| Plot type | Count rate plots | Images |
|---|---|---|
| Comparison with Poisson distribution Blue bars denote a histogram of data divided into 1 sec bins. Red curve is a Poisson curve with rate = median count rate of data. |
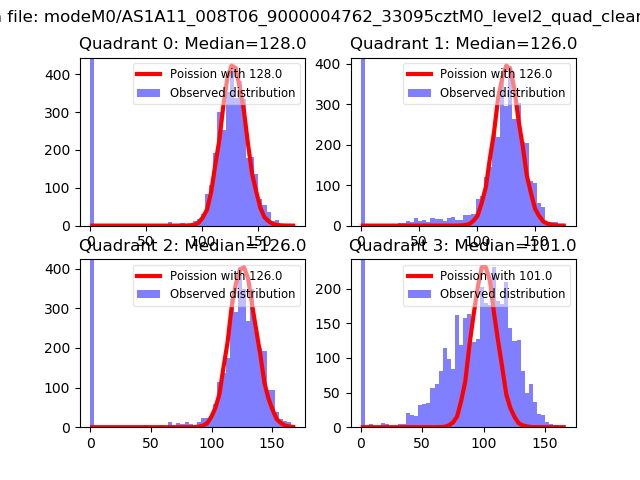 |
 |
| Quadrant-wise count rates Data is divided into 100 sec bins |
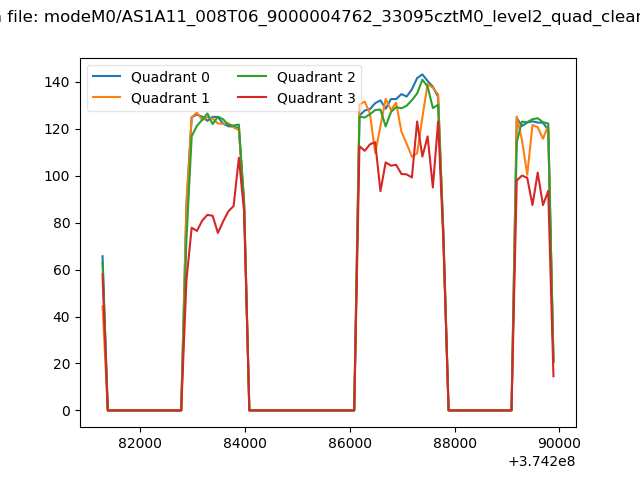 |
|
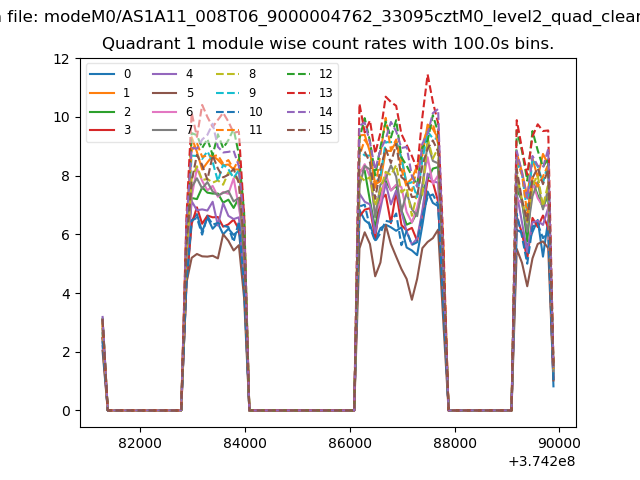
| Module-wise count rates for Quadrant A Data is divided into 100 sec bins |
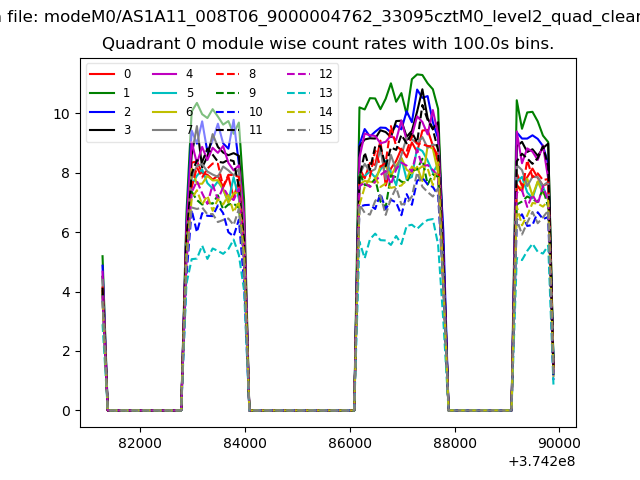 |
 |
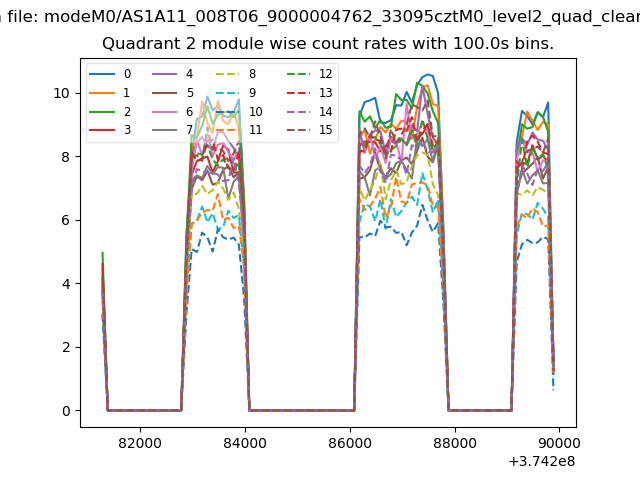
| Module-wise count rates for Quadrant B Data is divided into 100 sec bins |
 |
 |
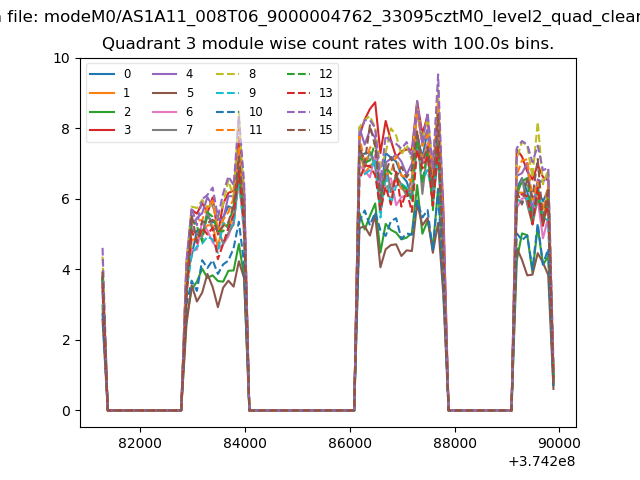
| Module-wise count rates for Quadrant C Data is divided into 100 sec bins |
 |
 |
| Module-wise count rates for Quadrant D Data is divided into 100 sec bins |
 |
 |
| Parameter | Plot |
|---|---|
| CZT HV Monitor | 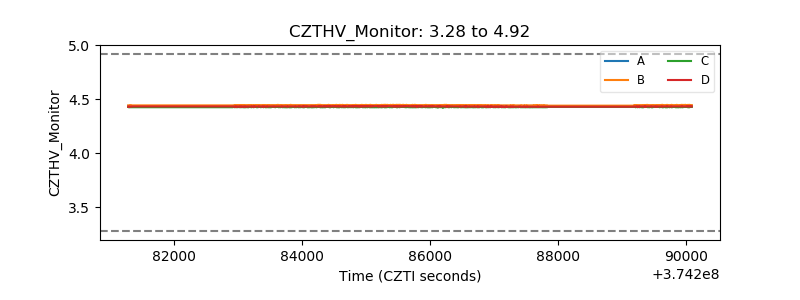 |
| D_VDD | 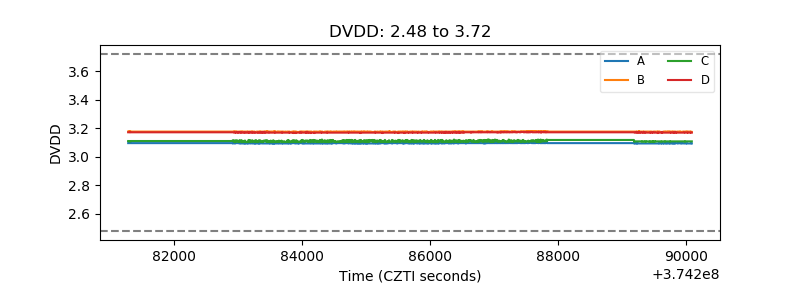 |
| Temperature 1 |  |
| Veto HV Monitor | 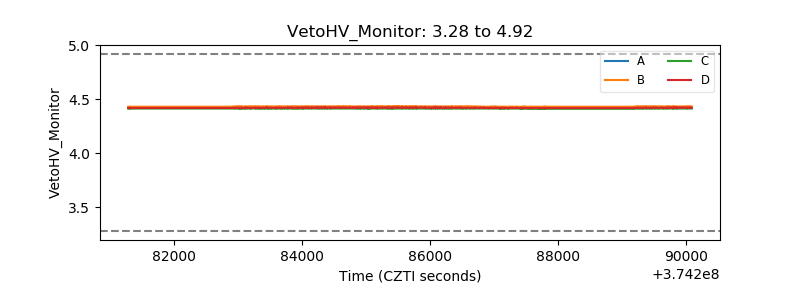 |
| Veto LLD | 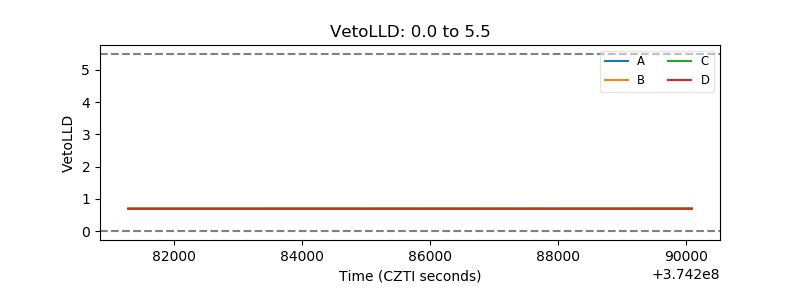 |
| Alpha Counter | 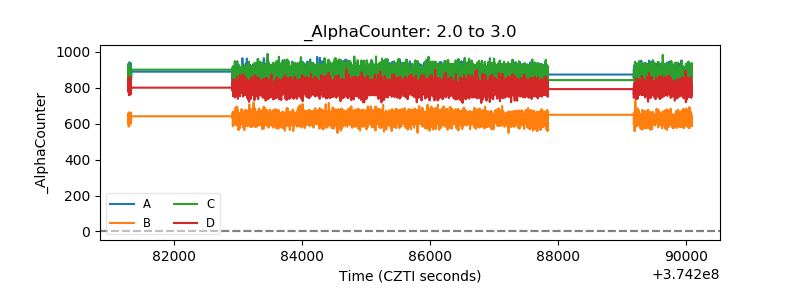 |
| _CPM_Rate | 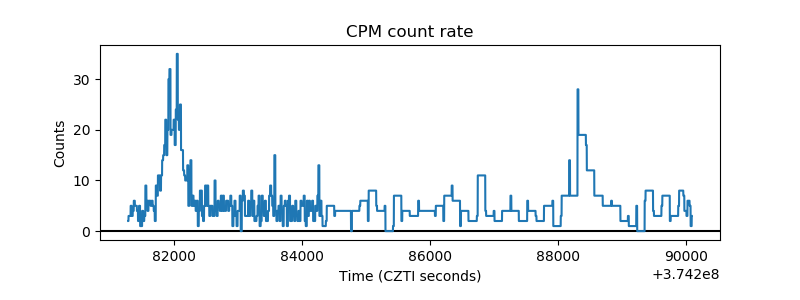 |
| CZT Counter | 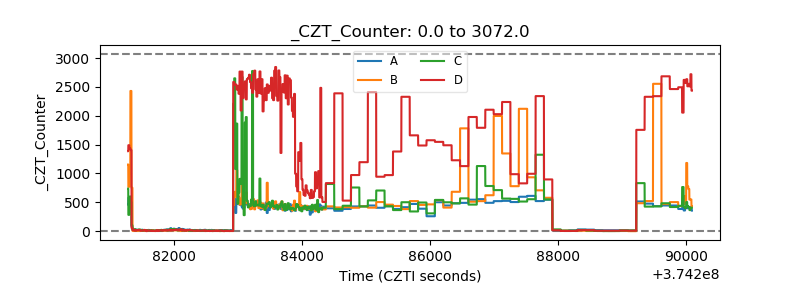 |
| +2.5 Volts monitor |  |
| +5 Volts monitor |  |
| _ROLL_ROT | 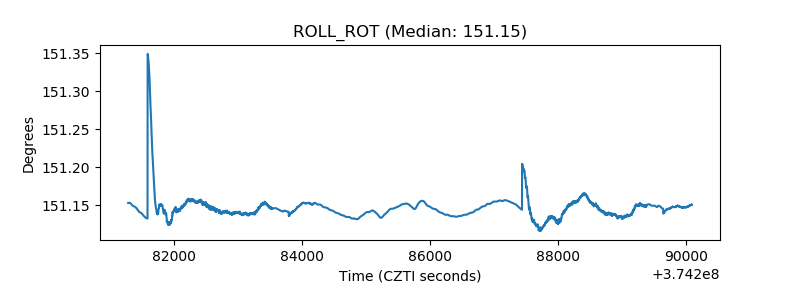 |
| _Roll_DEC |  |
| _Roll_RA | 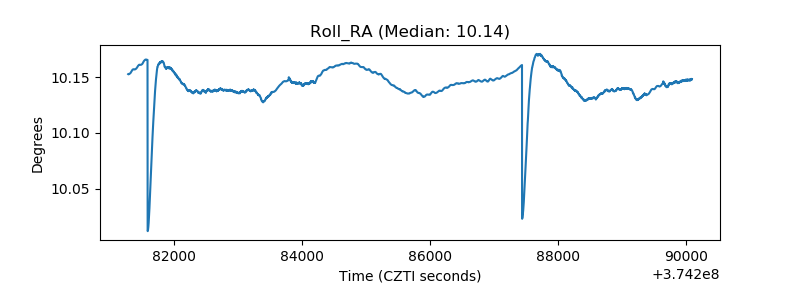 |
| Veto Counter | 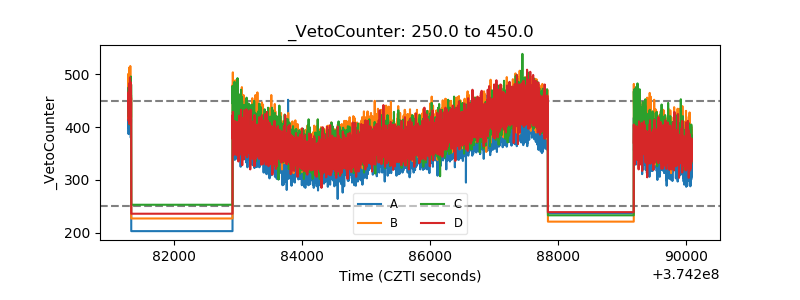 |