| Param | Original file | Final file |
|---|---|---|
| Filename | modeM0/AS1A11_008T06_9000004762_33098cztM0_level2.evt | modeM0/AS1A11_008T06_9000004762_33098cztM0_level2_quad_clean.evt |
| Size (bytes) | 327,055,680 | 30,283,200 |
| Size | 311.9 MB | 28.9 MB |
| Events in quadrant A | 1,562,117 | 173,239 |
| Events in quadrant B | 2,223,773 | 169,327 |
| Events in quadrant C | 1,950,386 | 169,392 |
| Events in quadrant D | 3,927,579 | 153,747 |
| Mode M9 | |||
|---|---|---|---|
| Quadrant | BADHDUFLAG | Total packets | Discarded packets |
| A | 0 | 13 | 0 |
| B | 0 | 13 | 0 |
| C | 0 | 13 | 0 |
| D | 0 | 13 | 0 |
| Mode SS | |||
|---|---|---|---|
| Quadrant | BADHDUFLAG | Total packets | Discarded packets |
| A | 0 | 74 | 0 |
| B | 0 | 74 | 0 |
| C | 0 | 74 | 0 |
| D | 0 | 74 | 0 |
| Mode M0 | |||
|---|---|---|---|
| Quadrant | BADHDUFLAG | Total packets | Discarded packets |
| A | 0 | 7111 | 2 |
| B | 0 | 8907 | 1 |
| C | 0 | 8129 | 1 |
| D | 0 | 14084 | 1 |
| Quadrant | Total seconds | Saturated seconds | Saturation percentage |
|---|---|---|---|
| A | 3533 | 3 | 0.084914% |
| B | 3533 | 169 | 4.783470% |
| C | 3533 | 59 | 1.669969% |
| D | 3533 | 232 | 6.566657% |
Noise dominated data is calculated using 1-second bins in cleaned event files. If a bin has >2000 counts, and if more than 50% of those come from <1% of pixels, then it is considered to be noise-dominated and hence unusable.
| Quadrant | # 1 sec bins | Bins with >0 counts | Bins with >2000 counts | High rate bins dominated by noise | Noise dominated (total time) | Noise dominated (detector-on time) | Marked lightcurve |
|---|---|---|---|---|---|---|---|
| A | 4847 | 3534 | 1 | 1 | 0.02% | 0.03% |  |
| B | 4847 | 3534 | 115 | 115 | 2.37% | 3.25% |  |
| C | 4847 | 3534 | 41 | 41 | 0.85% | 1.16% |  |
| D | 4847 | 3534 | 275 | 275 | 5.67% | 7.78% |  |
Top three noisy pixels from each quadrant. If the there are fewer than three noisy pixels in the level2.evt file, extra rows are filled as -1
| Pixel properties | Quadrant properties | ||||||
|---|---|---|---|---|---|---|---|
| Quadrant | DetID | PixID | Counts | Sigma | Mean | Median | Sigma |
| A | 10 | 248 | 9550 | 112.31 | 399 | 392 | 81.5 |
| A | 13 | 254 | 7120 | 82.51 | 399 | 392 | 81.5 |
| A | 3 | 137 | 3905 | 43.08 | 399 | 392 | 81.5 |
| B | 5 | 172 | 512431 | 6710.1 | 393 | 382 | 76.3 |
| B | 0 | 219 | 49144 | 639.0 | 393 | 382 | 76.3 |
| B | 0 | 189 | 42267 | 548.88 | 393 | 382 | 76.3 |
| C | 0 | 10 | 199549 | 2202.64 | 383 | 386 | 90.4 |
| C | 7 | 221 | 146193 | 1612.55 | 383 | 386 | 90.4 |
| C | 8 | 111 | 54863 | 602.48 | 383 | 386 | 90.4 |
| D | 7 | 223 | 1013596 | 10206.8 | 374 | 366 | 99.3 |
| D | 8 | 195 | 982484 | 9893.39 | 374 | 366 | 99.3 |
| D | 2 | 250 | 142055 | 1427.31 | 374 | 366 | 99.3 |
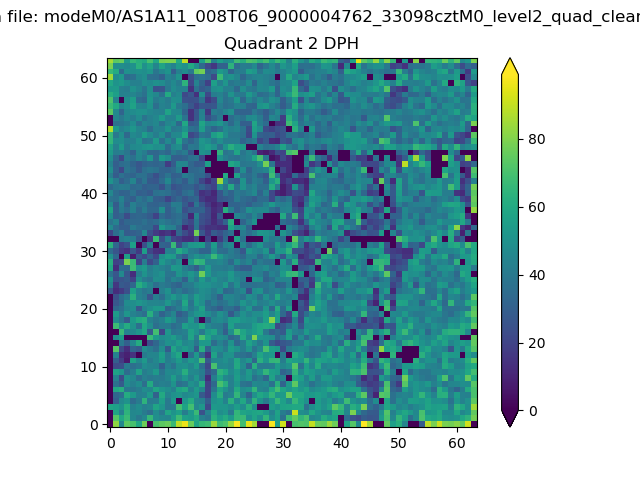
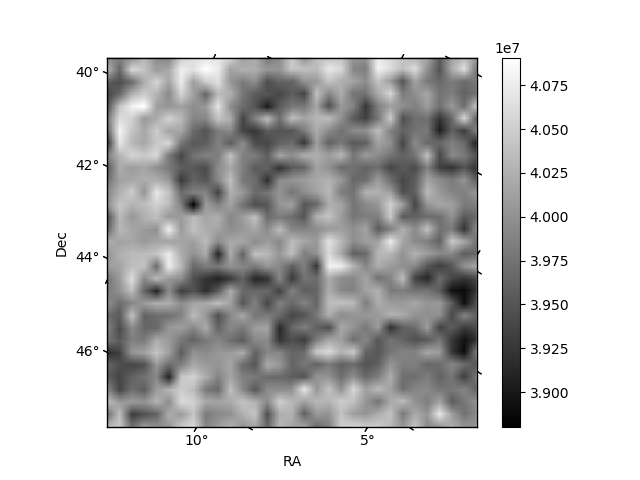
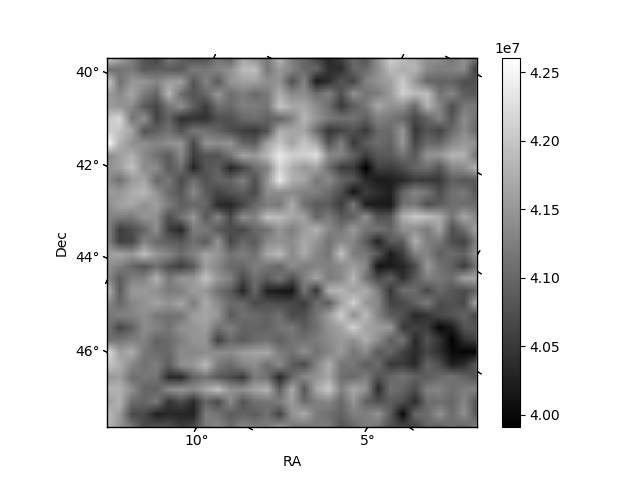
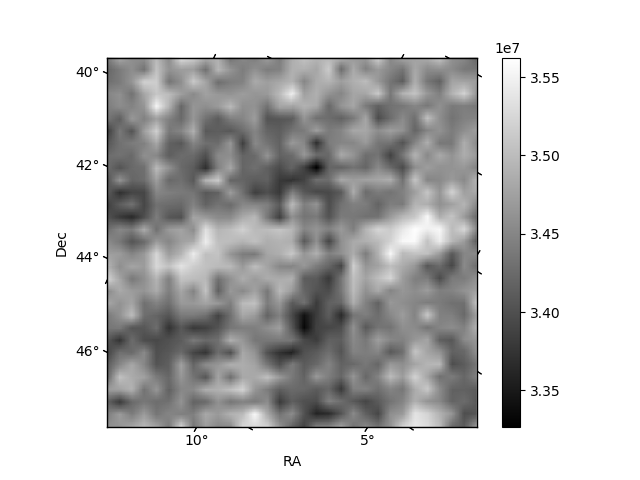
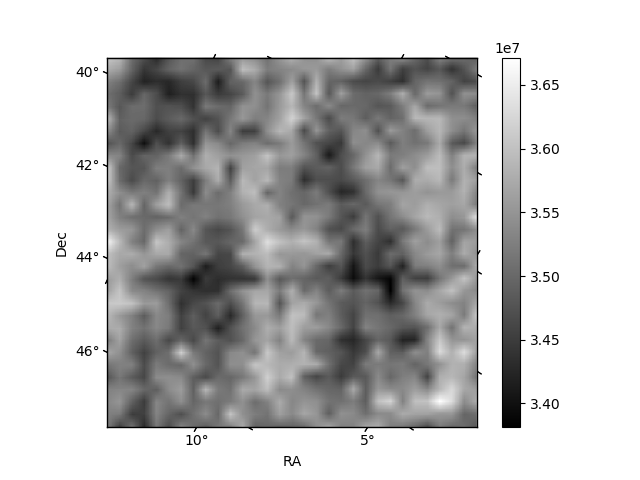
Histogram calculated using DETX and DETY for each event in the final _common_clean file
| Quadrant A | 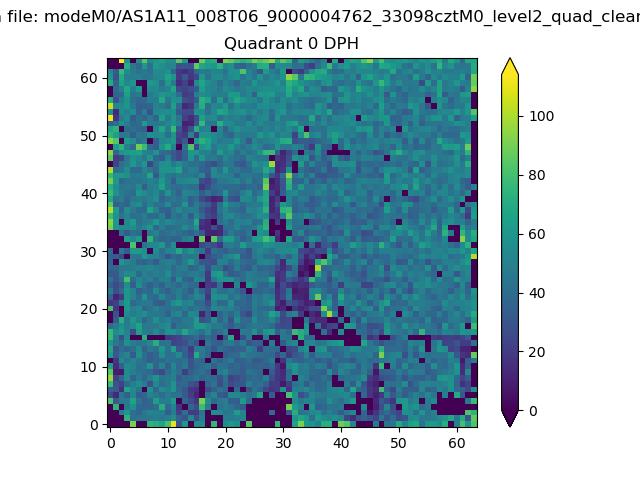 |
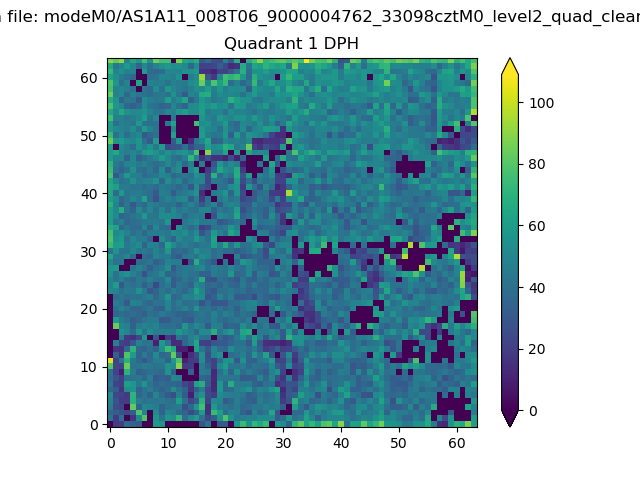 |
Quadrant B |
|---|---|---|---|
| Quadrant D | 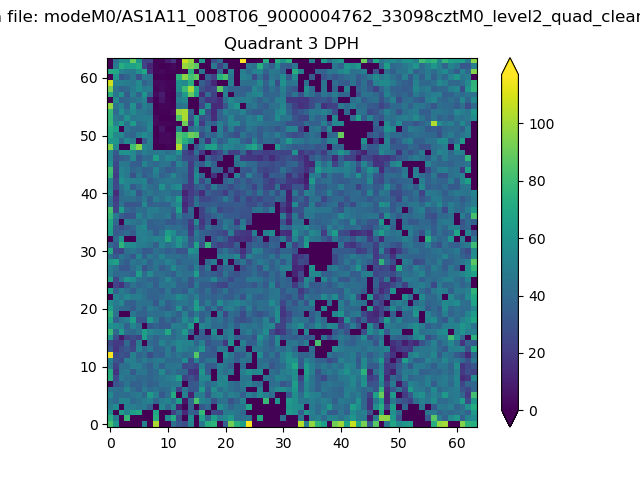 |
 |
Quadrant C |
| Plot type | Count rate plots | Images |
|---|---|---|
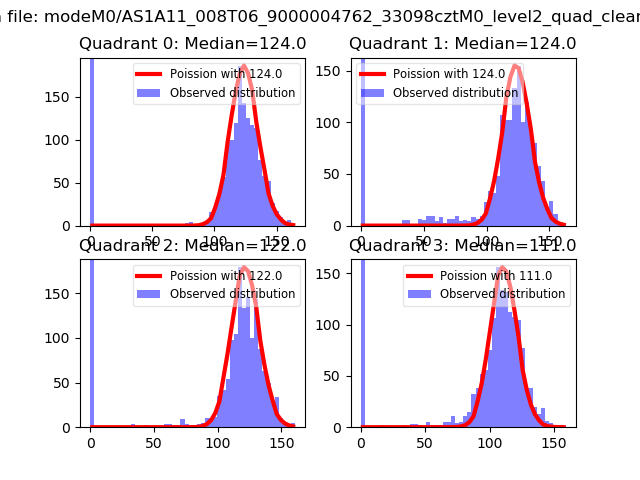
| Comparison with Poisson distribution Blue bars denote a histogram of data divided into 1 sec bins. Red curve is a Poisson curve with rate = median count rate of data. |
 |
 |
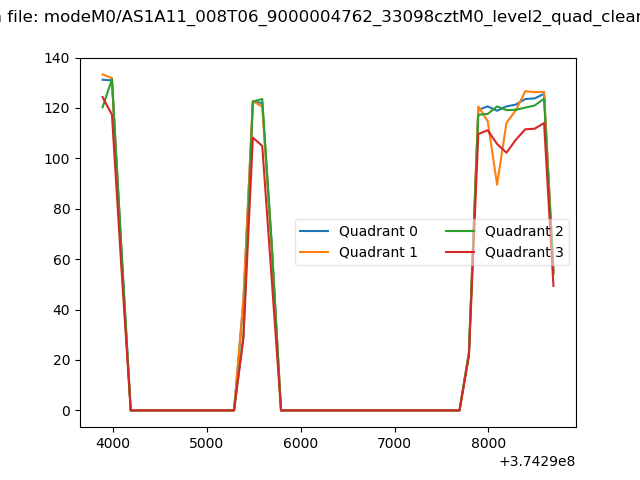
| Quadrant-wise count rates Data is divided into 100 sec bins |
 |
|
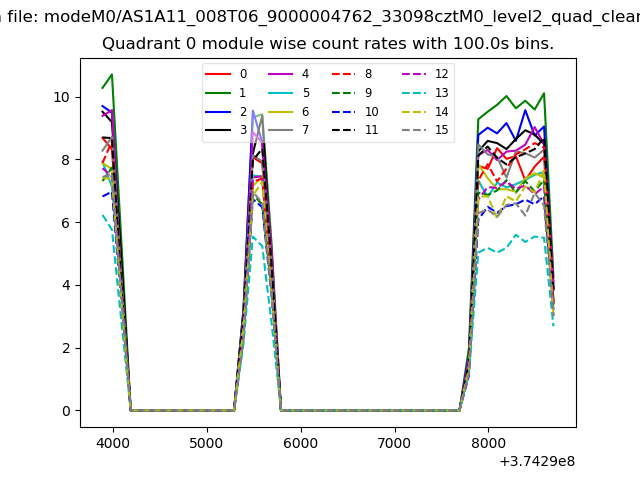
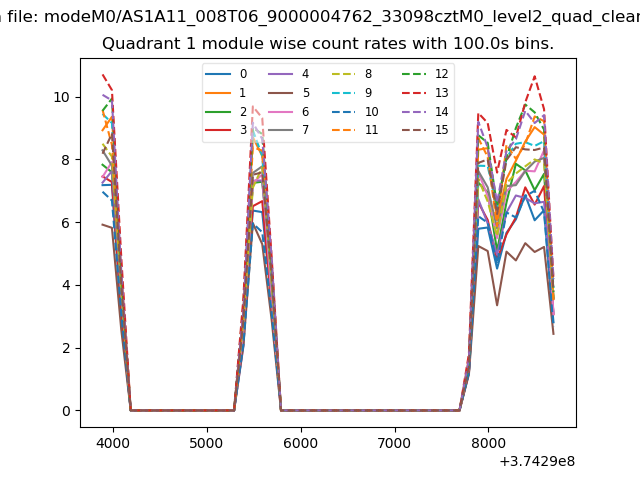
| Module-wise count rates for Quadrant A Data is divided into 100 sec bins |
 |
 |
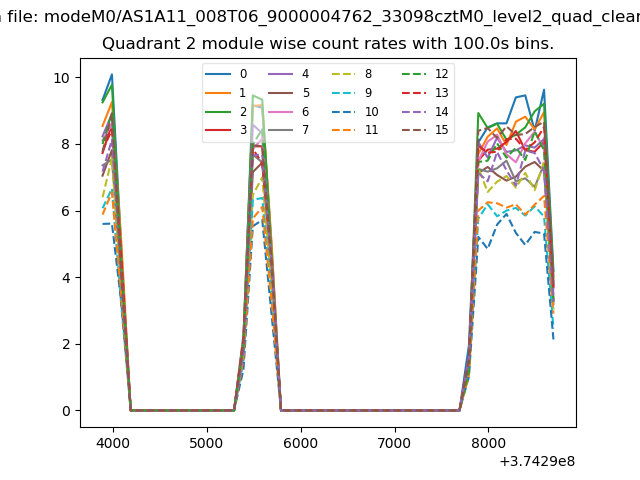
| Module-wise count rates for Quadrant B Data is divided into 100 sec bins |
 |
 |
| Module-wise count rates for Quadrant C Data is divided into 100 sec bins |
 |
 |
| Module-wise count rates for Quadrant D Data is divided into 100 sec bins |
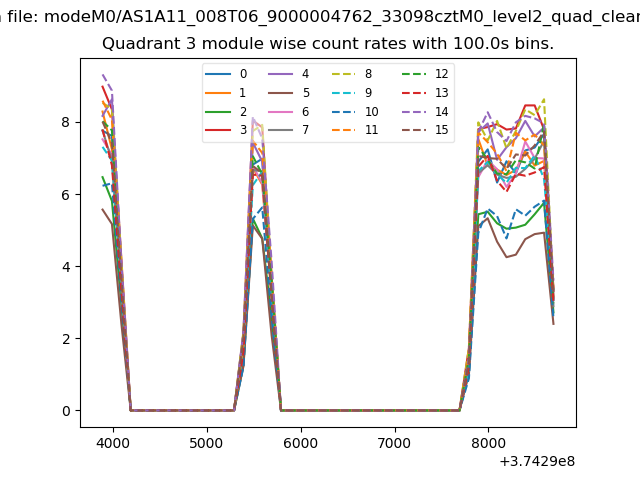 |
 |
| Parameter | Plot |
|---|---|
| CZT HV Monitor | 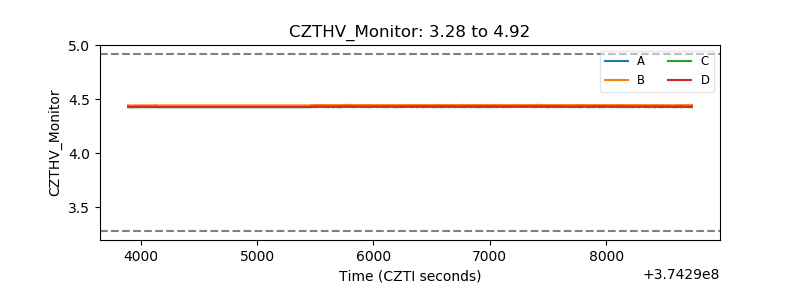 |
| D_VDD | 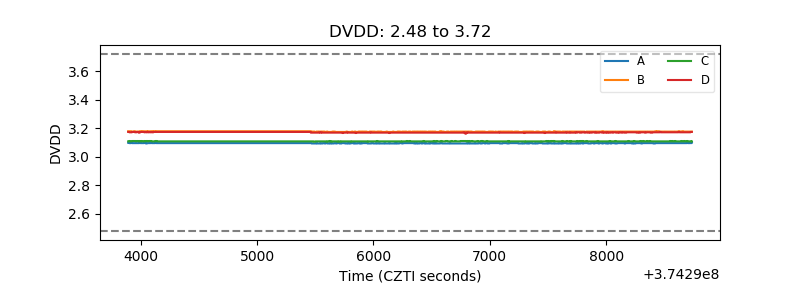 |
| Temperature 1 | 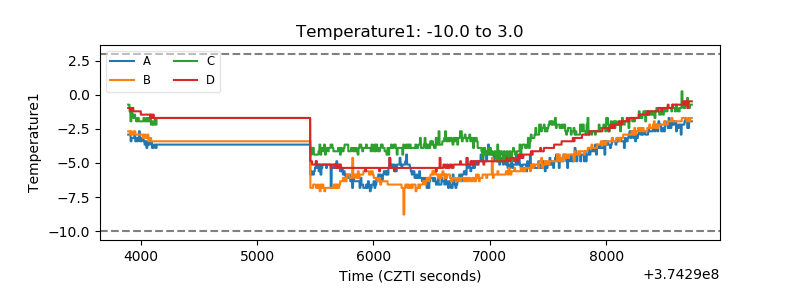 |
| Veto HV Monitor | 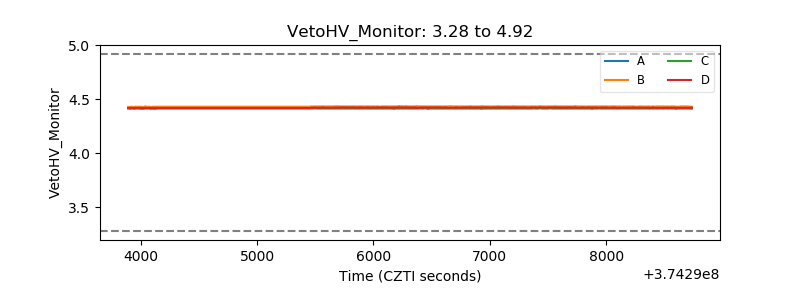 |
| Veto LLD | 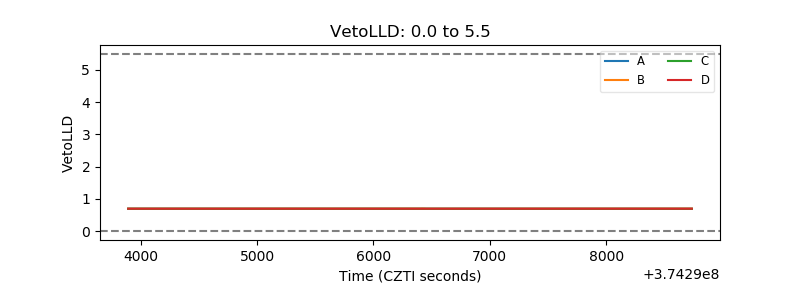 |
| Alpha Counter |  |
| _CPM_Rate | 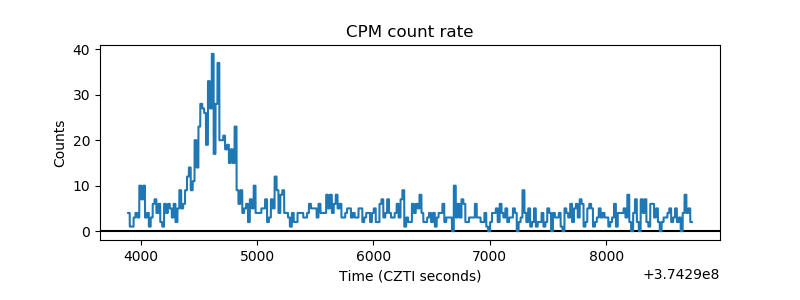 |
| CZT Counter | 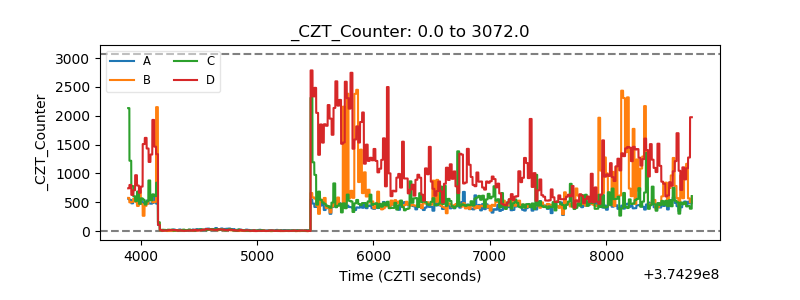 |
| +2.5 Volts monitor |  |
| +5 Volts monitor |  |
| _ROLL_ROT | 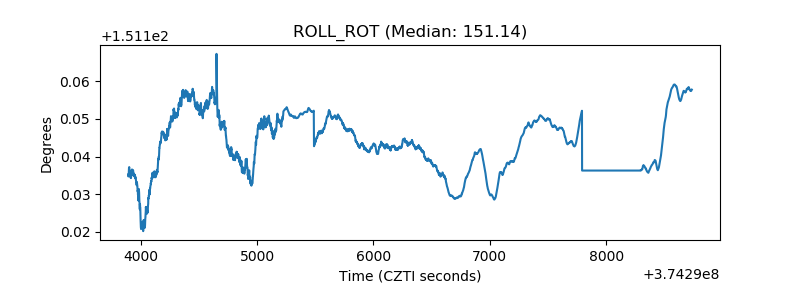 |
| _Roll_DEC | 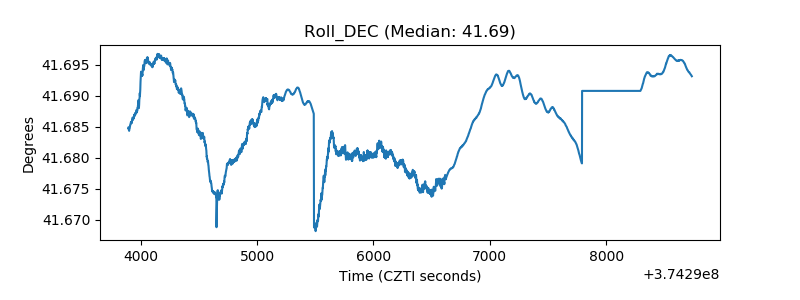 |
| _Roll_RA | 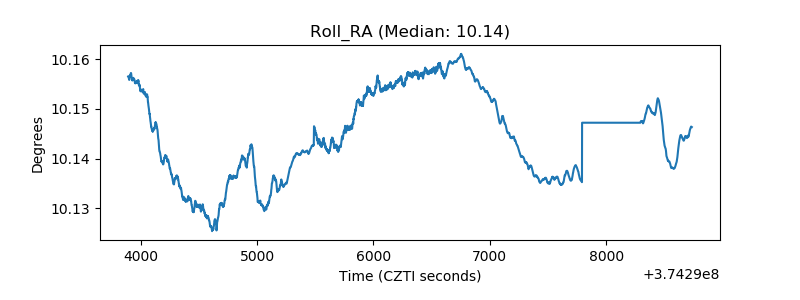 |
| Veto Counter | 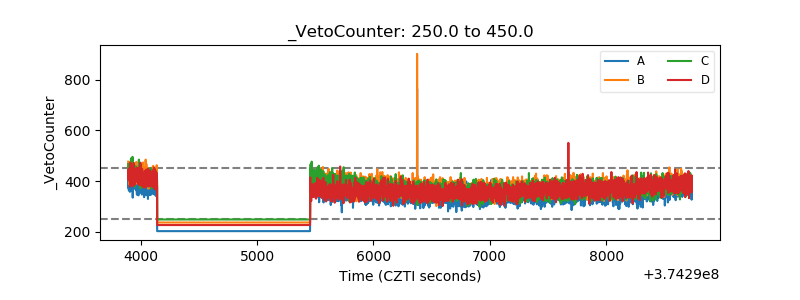 |