| Param | Original file | Final file |
|---|---|---|
| Filename | modeM0/AS1A11_008T06_9000004762_33100cztM0_level2.evt | modeM0/AS1A11_008T06_9000004762_33100cztM0_level2_quad_clean.evt |
| Size (bytes) | 636,488,640 | 82,339,200 |
| Size | 607.0 MB | 78.5 MB |
| Events in quadrant A | 2,946,969 | 562,065 |
| Events in quadrant B | 3,376,526 | 561,369 |
| Events in quadrant C | 4,024,080 | 543,717 |
| Events in quadrant D | 8,509,555 | 393,197 |
| Mode M9 | |||
|---|---|---|---|
| Quadrant | BADHDUFLAG | Total packets | Discarded packets |
| A | 0 | 33 | 0 |
| B | 0 | 33 | 0 |
| C | 0 | 33 | 0 |
| D | 0 | 33 | 0 |
| Mode SS | |||
|---|---|---|---|
| Quadrant | BADHDUFLAG | Total packets | Discarded packets |
| A | 0 | 126 | 0 |
| B | 0 | 126 | 0 |
| C | 0 | 126 | 0 |
| D | 0 | 126 | 0 |
| Mode M0 | |||
|---|---|---|---|
| Quadrant | BADHDUFLAG | Total packets | Discarded packets |
| A | 0 | 12555 | 3 |
| B | 0 | 13714 | 2 |
| C | 0 | 15814 | 2 |
| D | 0 | 29652 | 2 |
| Quadrant | Total seconds | Saturated seconds | Saturation percentage |
|---|---|---|---|
| A | 6196 | 5 | 0.080697% |
| B | 6196 | 94 | 1.517108% |
| C | 6196 | 258 | 4.163977% |
| D | 6196 | 1884 | 30.406714% |
Noise dominated data is calculated using 1-second bins in cleaned event files. If a bin has >2000 counts, and if more than 50% of those come from <1% of pixels, then it is considered to be noise-dominated and hence unusable.
| Quadrant | # 1 sec bins | Bins with >0 counts | Bins with >2000 counts | High rate bins dominated by noise | Noise dominated (total time) | Noise dominated (detector-on time) | Marked lightcurve |
|---|---|---|---|---|---|---|---|
| A | 9422 | 6198 | 0 | 0 | 0.00% | 0.00% | 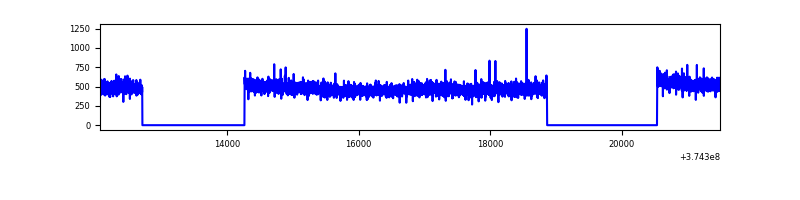 |
| B | 9422 | 6198 | 53 | 53 | 0.56% | 0.86% |  |
| C | 9422 | 6198 | 196 | 196 | 2.08% | 3.16% | 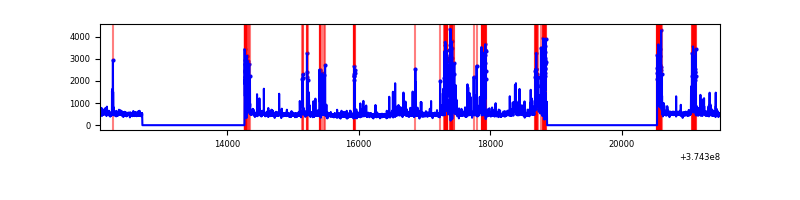 |
| D | 9422 | 6198 | 1440 | 1440 | 15.28% | 23.23% | 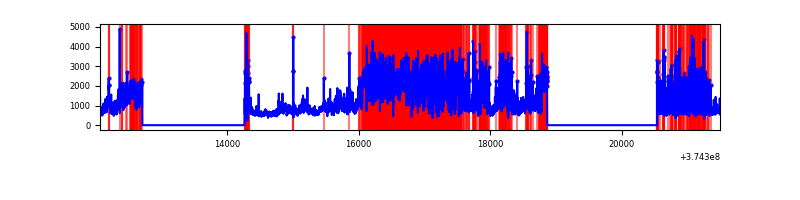 |
Top three noisy pixels from each quadrant. If the there are fewer than three noisy pixels in the level2.evt file, extra rows are filled as -1
| Pixel properties | Quadrant properties | ||||||
|---|---|---|---|---|---|---|---|
| Quadrant | DetID | PixID | Counts | Sigma | Mean | Median | Sigma |
| A | 13 | 6 | 11021 | 67.45 | 757 | 741 | 152.4 |
| A | 13 | 254 | 10649 | 65.01 | 757 | 741 | 152.4 |
| A | 15 | 169 | 8045 | 47.93 | 757 | 741 | 152.4 |
| B | 5 | 172 | 197362 | 1372.75 | 749 | 730 | 143.2 |
| B | 5 | 200 | 64161 | 442.83 | 749 | 730 | 143.2 |
| B | 0 | 189 | 55206 | 380.31 | 749 | 730 | 143.2 |
| C | 1 | 23 | 743290 | 4453.25 | 719 | 725 | 166.7 |
| C | 0 | 10 | 250179 | 1496.0 | 719 | 725 | 166.7 |
| C | 7 | 221 | 172718 | 1031.46 | 719 | 725 | 166.7 |
| D | 7 | 223 | 2123701 | 13417.99 | 604 | 591 | 158.2 |
| D | 12 | 218 | 2017295 | 12745.5 | 604 | 591 | 158.2 |
| D | 8 | 195 | 638598 | 4032.18 | 604 | 591 | 158.2 |
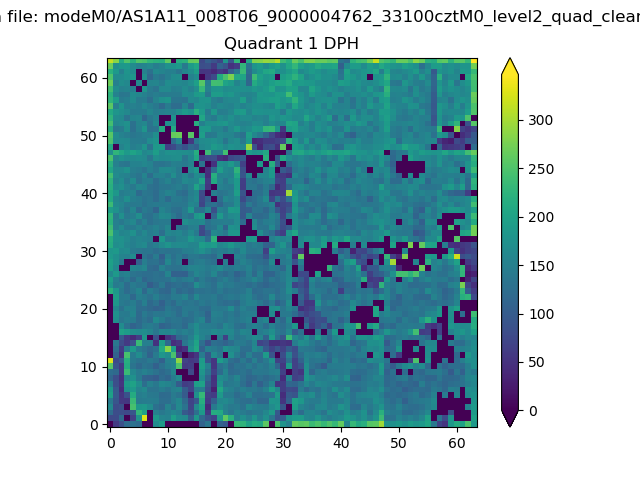
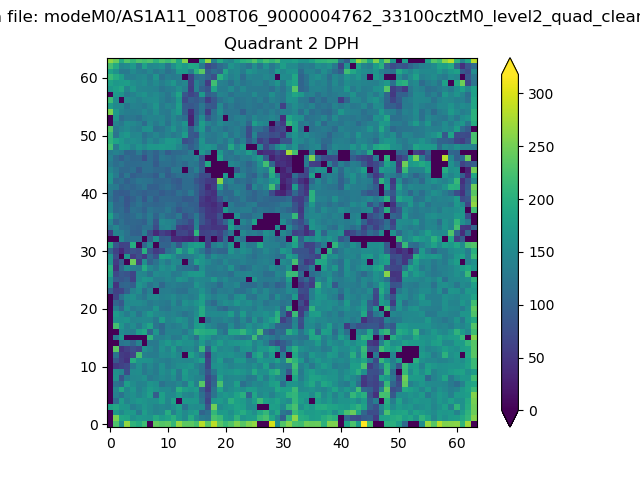
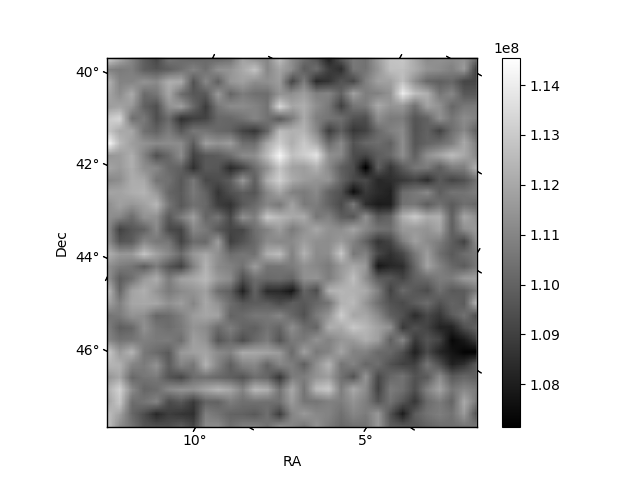
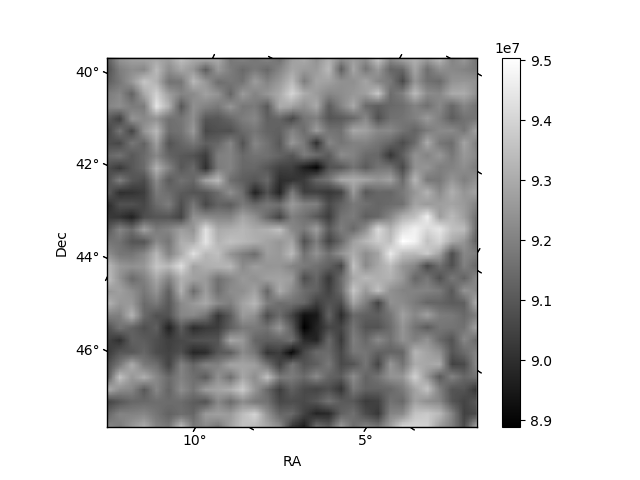
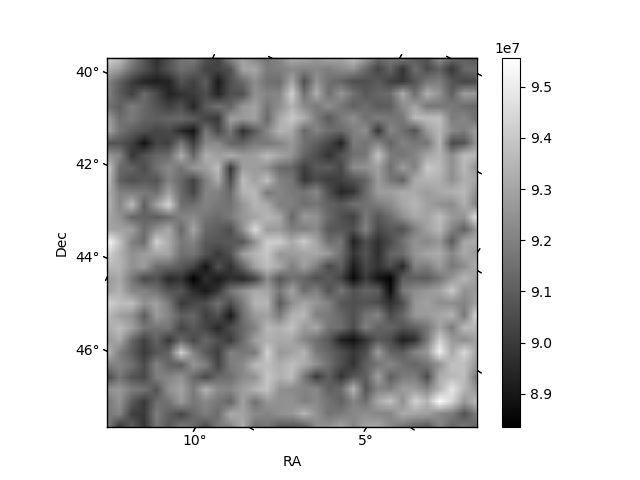
Histogram calculated using DETX and DETY for each event in the final _common_clean file
| Quadrant A | 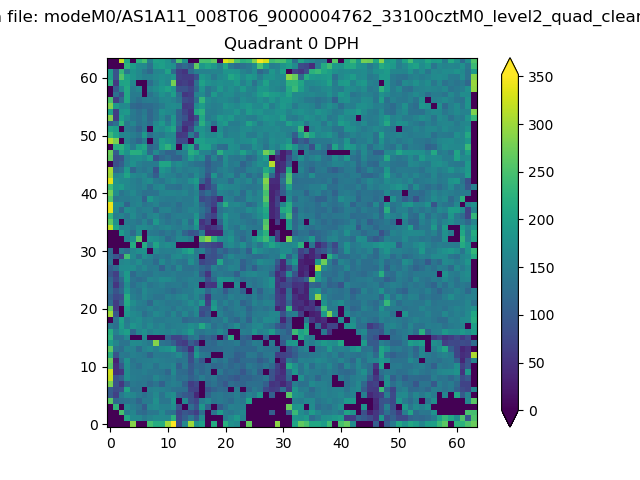 |
 |
Quadrant B |
|---|---|---|---|
| Quadrant D | 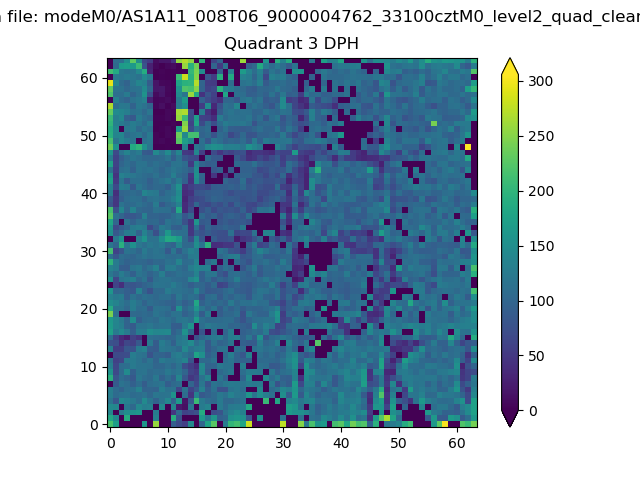 |
 |
Quadrant C |
| Plot type | Count rate plots | Images |
|---|---|---|
| Comparison with Poisson distribution Blue bars denote a histogram of data divided into 1 sec bins. Red curve is a Poisson curve with rate = median count rate of data. |
 |
 |
| Quadrant-wise count rates Data is divided into 100 sec bins |
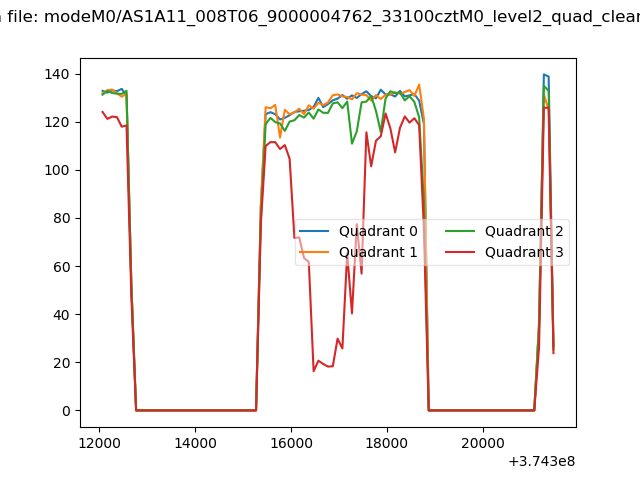 |
|
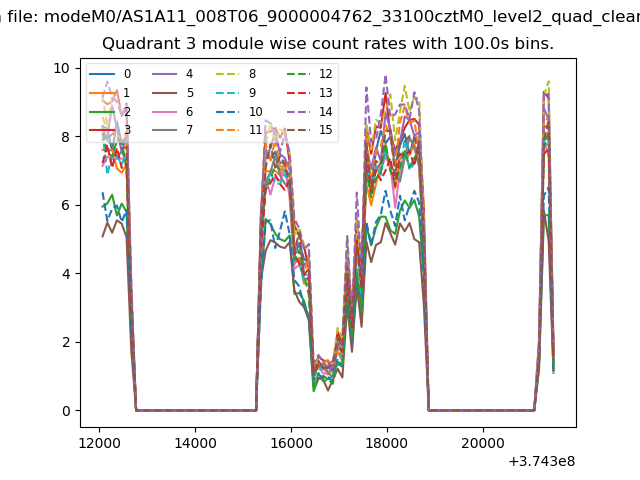
| Module-wise count rates for Quadrant A Data is divided into 100 sec bins |
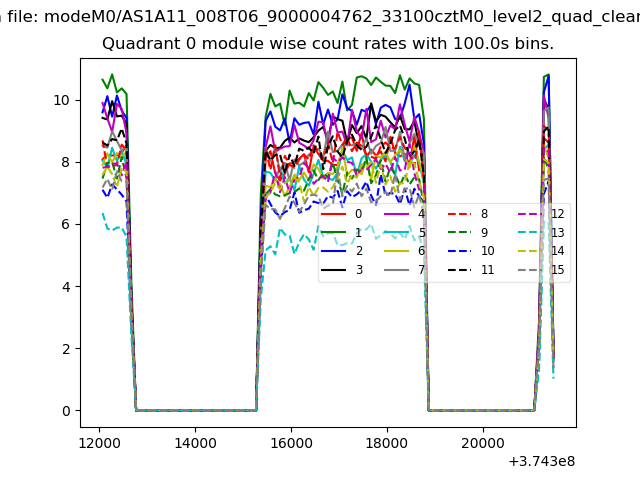 |
 |
| Module-wise count rates for Quadrant B Data is divided into 100 sec bins |
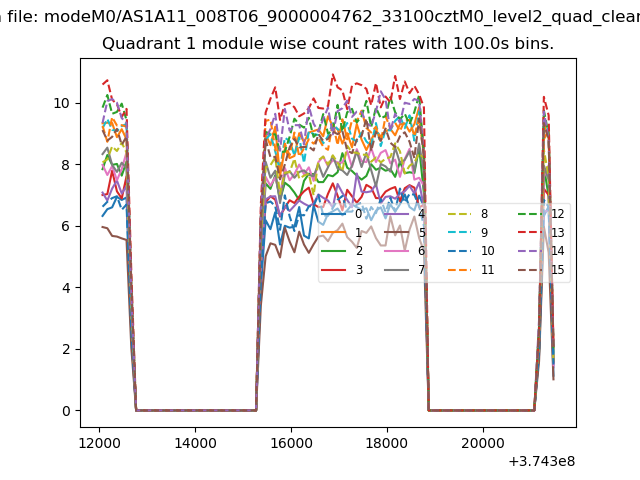 |
 |
| Module-wise count rates for Quadrant C Data is divided into 100 sec bins |
 |
 |
| Module-wise count rates for Quadrant D Data is divided into 100 sec bins |
 |
 |
| Parameter | Plot |
|---|---|
| CZT HV Monitor |  |
| D_VDD | 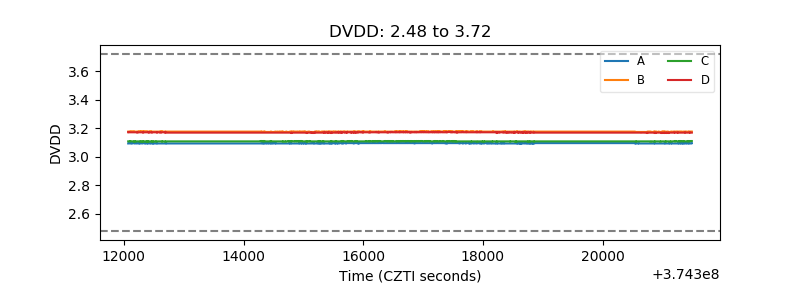 |
| Temperature 1 | 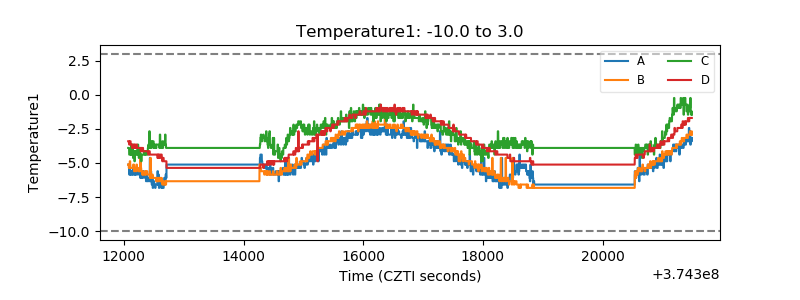 |
| Veto HV Monitor | 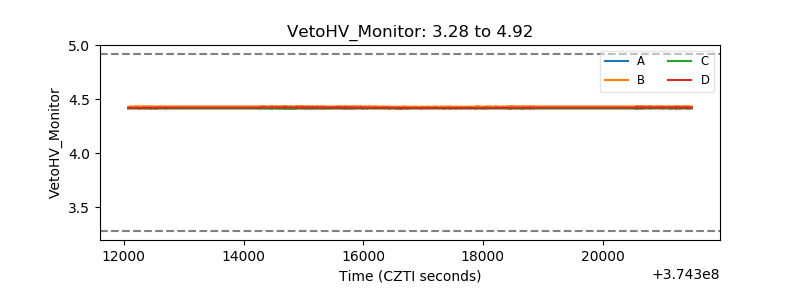 |
| Veto LLD | 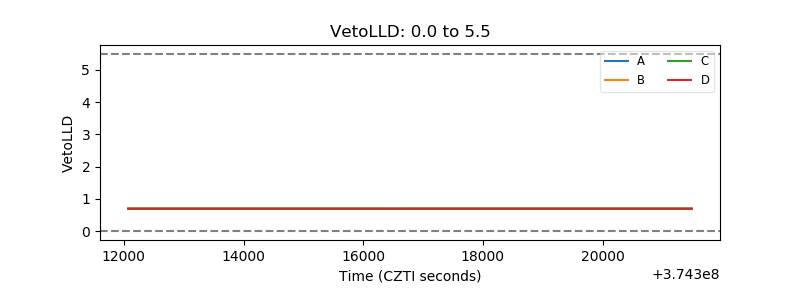 |
| Alpha Counter | 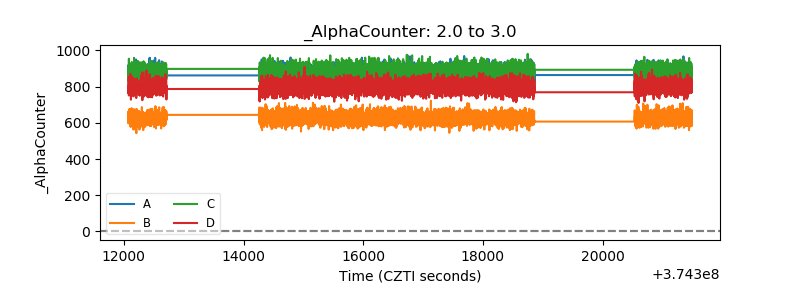 |
| _CPM_Rate | 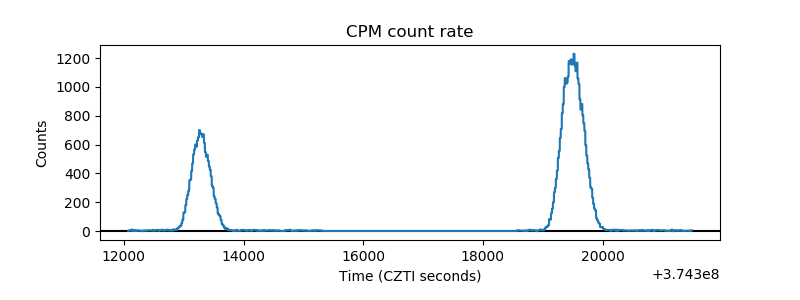 |
| CZT Counter | 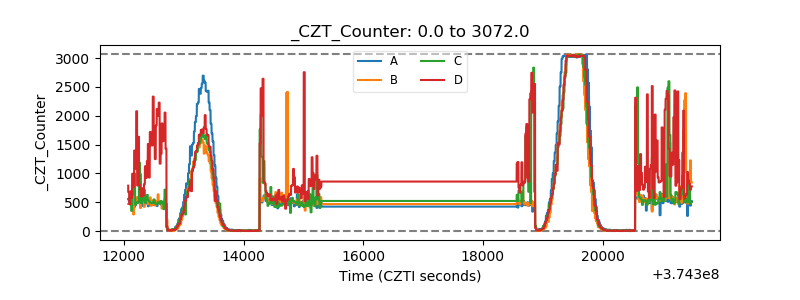 |
| +2.5 Volts monitor | 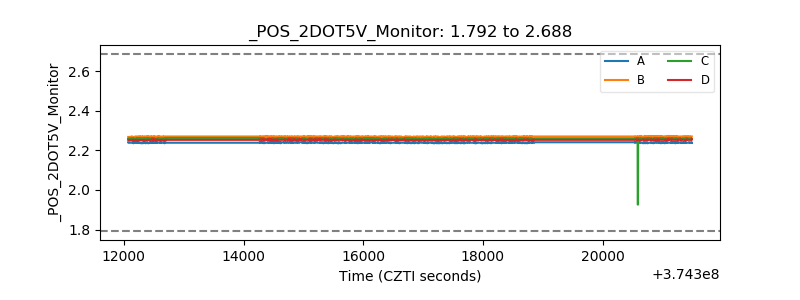 |
| +5 Volts monitor |  |
| _ROLL_ROT | 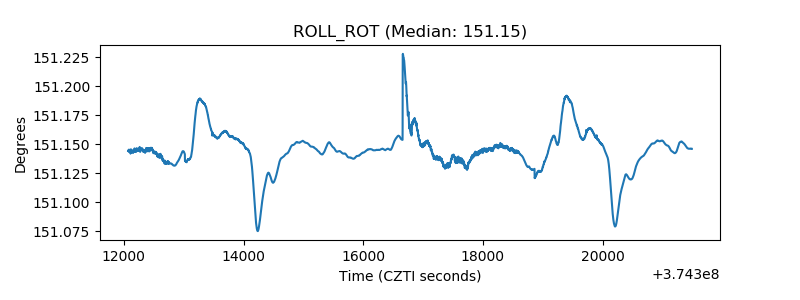 |
| _Roll_DEC | 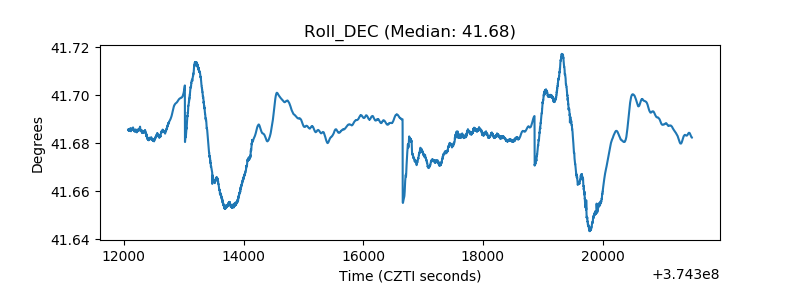 |
| _Roll_RA | 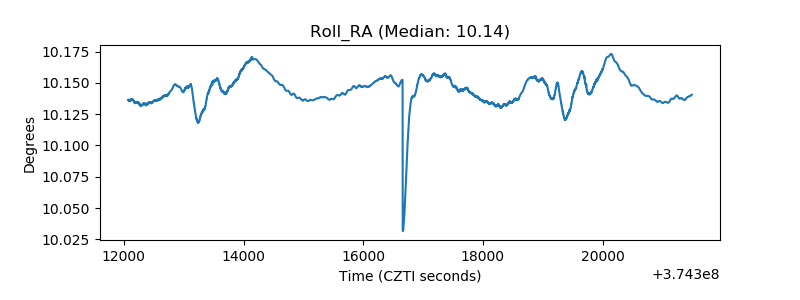 |
| Veto Counter | 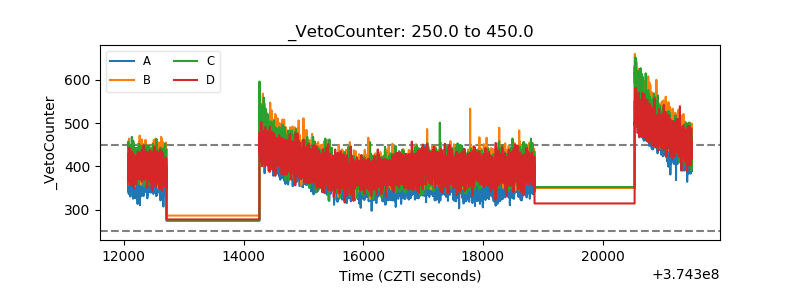 |