| Param | Original file | Final file |
|---|---|---|
| Filename | modeM0/AS1A11_008T06_9000004762_33102cztM0_level2.evt | modeM0/AS1A11_008T06_9000004762_33102cztM0_level2_quad_clean.evt |
| Size (bytes) | 656,308,800 | 95,601,600 |
| Size | 625.9 MB | 91.2 MB |
| Events in quadrant A | 2,893,317 | 668,665 |
| Events in quadrant B | 3,540,987 | 655,995 |
| Events in quadrant C | 5,494,627 | 589,484 |
| Events in quadrant D | 7,550,781 | 570,296 |
| Mode M9 | |||
|---|---|---|---|
| Quadrant | BADHDUFLAG | Total packets | Discarded packets |
| A | 0 | 35 | 0 |
| B | 0 | 35 | 0 |
| C | 0 | 35 | 0 |
| D | 0 | 35 | 0 |
| Mode SS | |||
|---|---|---|---|
| Quadrant | BADHDUFLAG | Total packets | Discarded packets |
| A | 0 | 122 | 0 |
| B | 0 | 122 | 0 |
| C | 0 | 122 | 0 |
| D | 0 | 122 | 0 |
| Mode M0 | |||
|---|---|---|---|
| Quadrant | BADHDUFLAG | Total packets | Discarded packets |
| A | 0 | 12129 | 3 |
| B | 0 | 14103 | 2 |
| C | 0 | 20049 | 2 |
| D | 0 | 26692 | 2 |
| Quadrant | Total seconds | Saturated seconds | Saturation percentage |
|---|---|---|---|
| A | 5866 | 9 | 0.153427% |
| B | 5866 | 195 | 3.324241% |
| C | 5866 | 1036 | 17.661098% |
| D | 5866 | 1053 | 17.950904% |
Noise dominated data is calculated using 1-second bins in cleaned event files. If a bin has >2000 counts, and if more than 50% of those come from <1% of pixels, then it is considered to be noise-dominated and hence unusable.
| Quadrant | # 1 sec bins | Bins with >0 counts | Bins with >2000 counts | High rate bins dominated by noise | Noise dominated (total time) | Noise dominated (detector-on time) | Marked lightcurve |
|---|---|---|---|---|---|---|---|
| A | 9363 | 5868 | 0 | 0 | 0.00% | 0.00% | 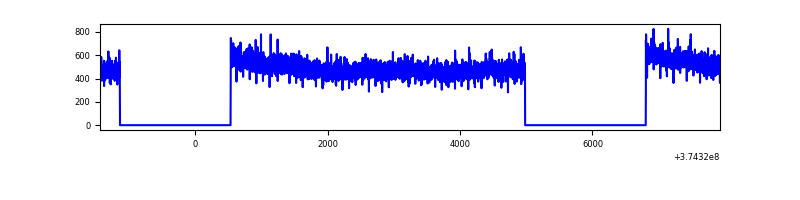 |
| B | 9363 | 5868 | 121 | 121 | 1.29% | 2.06% | 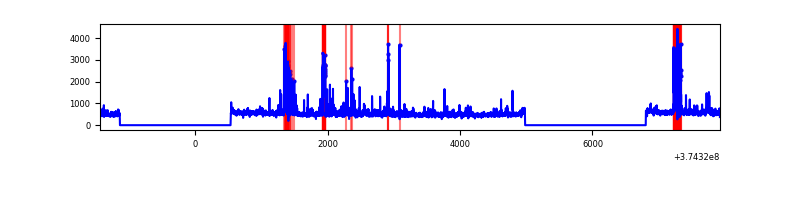 |
| C | 9363 | 5868 | 820 | 820 | 8.76% | 13.97% | 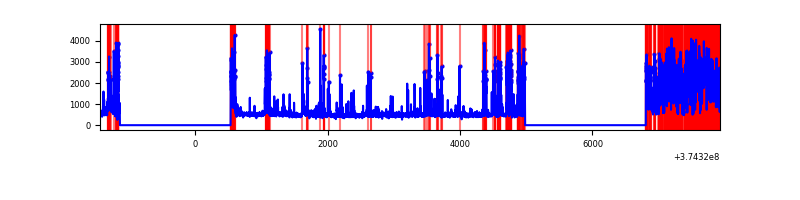 |
| D | 9363 | 5868 | 1026 | 1026 | 10.96% | 17.48% | 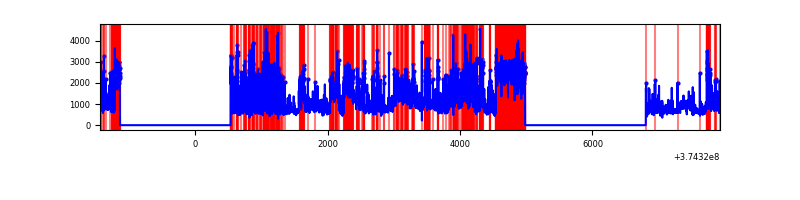 |
Top three noisy pixels from each quadrant. If the there are fewer than three noisy pixels in the level2.evt file, extra rows are filled as -1
| Pixel properties | Quadrant properties | ||||||
|---|---|---|---|---|---|---|---|
| Quadrant | DetID | PixID | Counts | Sigma | Mean | Median | Sigma |
| A | 13 | 6 | 16471 | 106.67 | 740 | 729 | 147.6 |
| A | 15 | 169 | 13210 | 84.57 | 740 | 729 | 147.6 |
| A | 13 | 254 | 10318 | 64.98 | 740 | 729 | 147.6 |
| B | 5 | 172 | 503584 | 3694.92 | 720 | 703 | 136.1 |
| B | 0 | 189 | 88012 | 641.5 | 720 | 703 | 136.1 |
| B | 5 | 200 | 40172 | 290.0 | 720 | 703 | 136.1 |
| C | 8 | 111 | 2146478 | 14226.89 | 654 | 659 | 150.8 |
| C | 1 | 23 | 386021 | 2554.97 | 654 | 659 | 150.8 |
| C | 0 | 10 | 263834 | 1744.86 | 654 | 659 | 150.8 |
| D | 7 | 223 | 2227497 | 12853.74 | 670 | 656 | 173.2 |
| D | 8 | 195 | 925457 | 5338.12 | 670 | 656 | 173.2 |
| D | 12 | 218 | 617834 | 3562.46 | 670 | 656 | 173.2 |
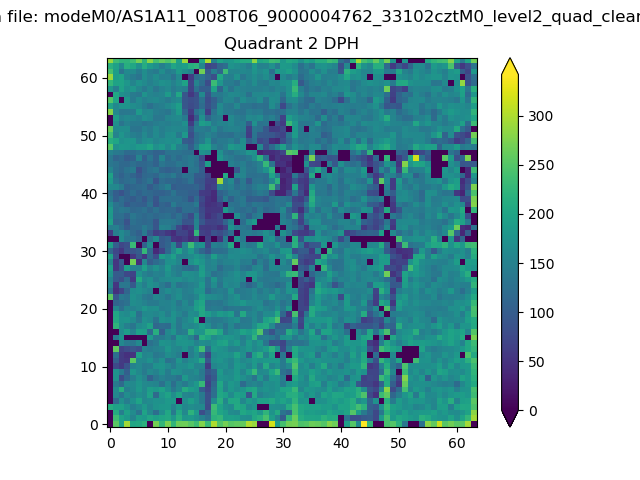
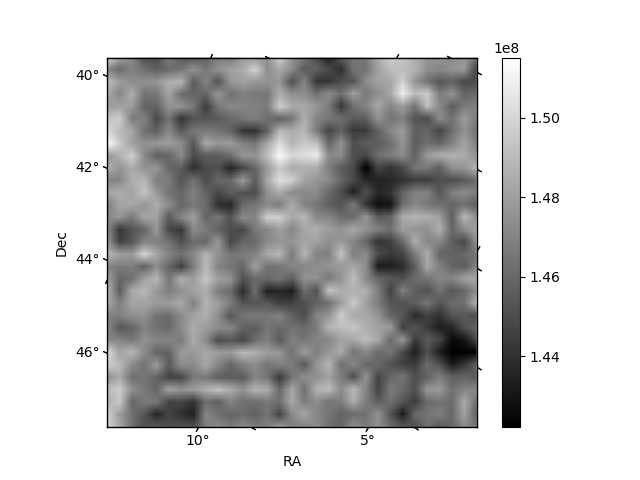
Histogram calculated using DETX and DETY for each event in the final _common_clean file
| Quadrant A | 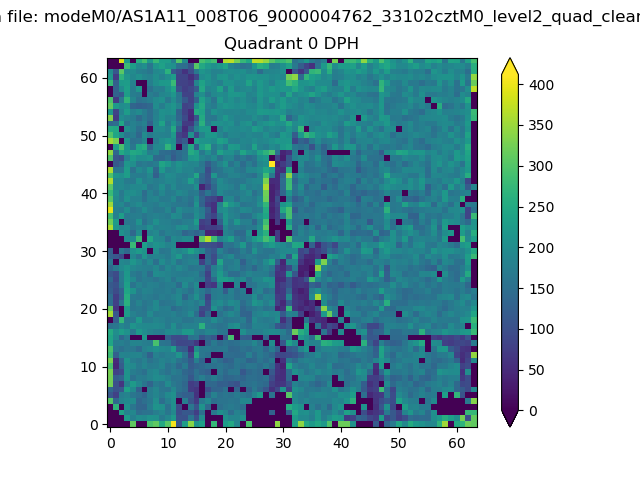 |
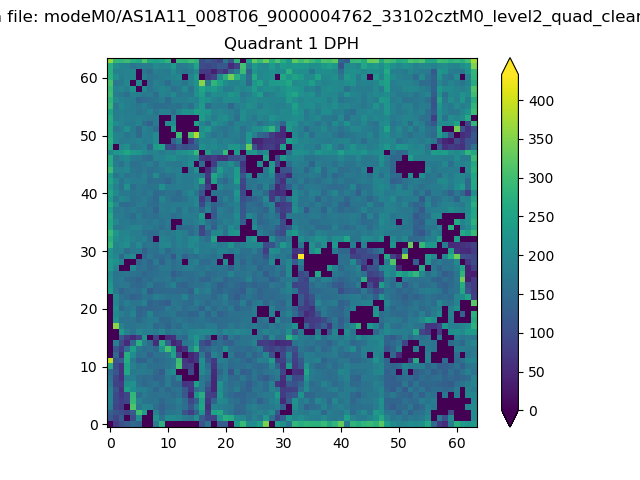 |
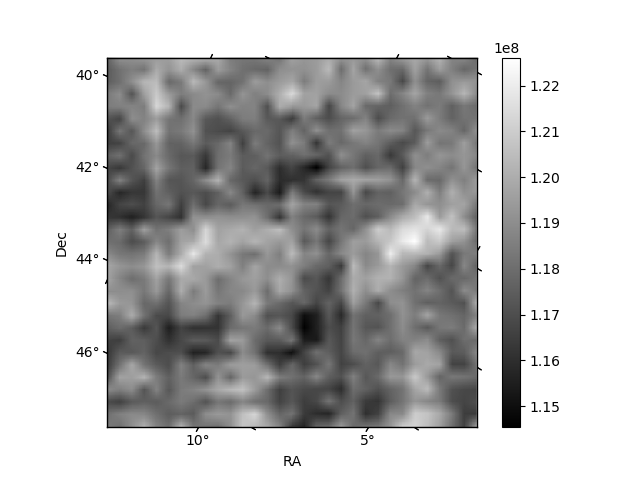
Quadrant B |
|---|---|---|---|
| Quadrant D | 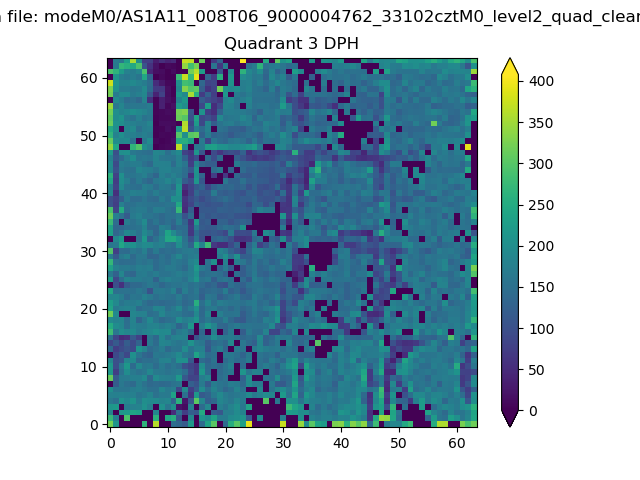 |
 |
Quadrant C |
| Plot type | Count rate plots | Images |
|---|---|---|
| Comparison with Poisson distribution Blue bars denote a histogram of data divided into 1 sec bins. Red curve is a Poisson curve with rate = median count rate of data. |
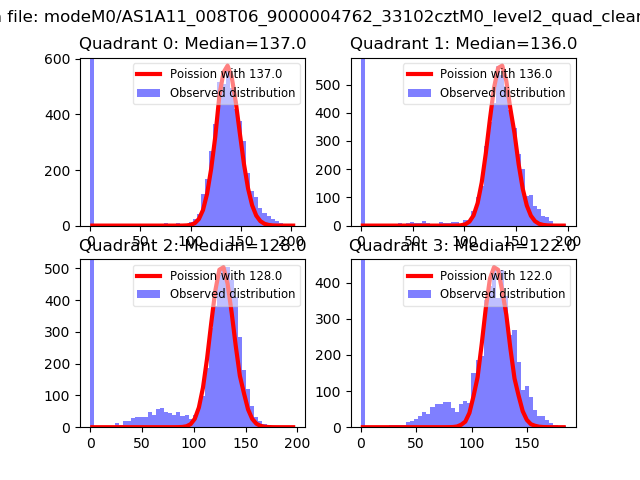 |
 |
| Quadrant-wise count rates Data is divided into 100 sec bins |
 |
|
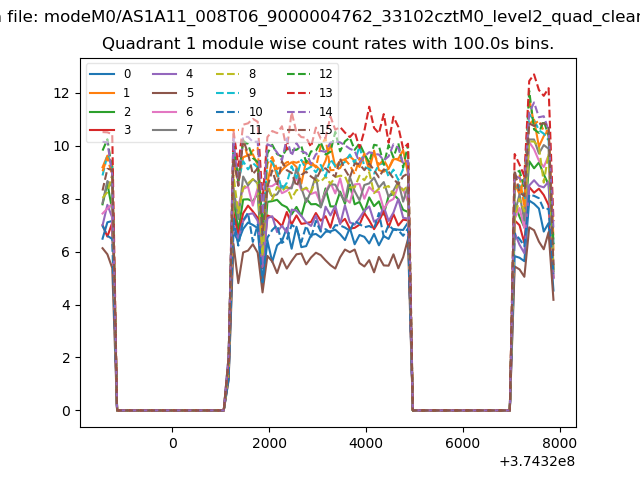
| Module-wise count rates for Quadrant A Data is divided into 100 sec bins |
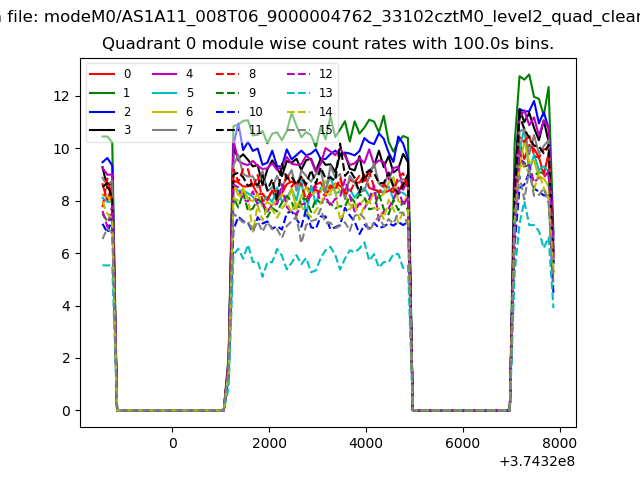 |
 |
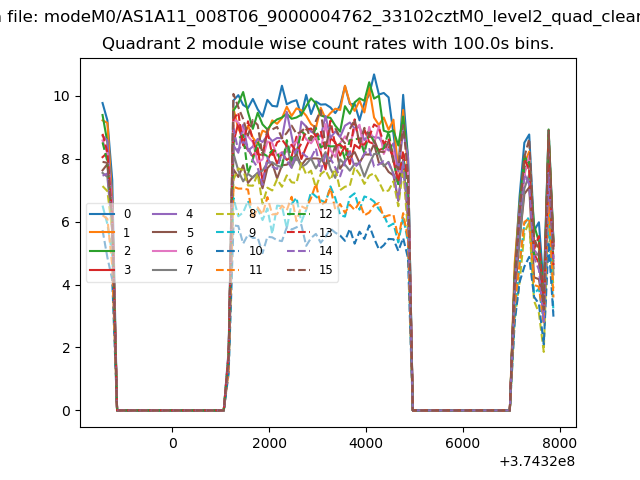
| Module-wise count rates for Quadrant B Data is divided into 100 sec bins |
 |
 |
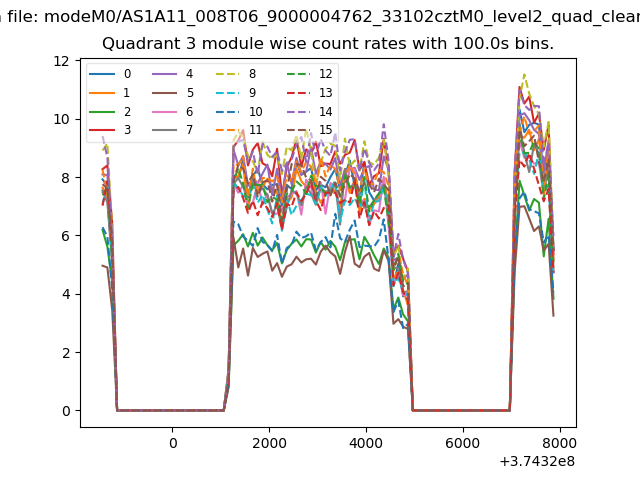
| Module-wise count rates for Quadrant C Data is divided into 100 sec bins |
 |
 |
| Module-wise count rates for Quadrant D Data is divided into 100 sec bins |
 |
 |
| Parameter | Plot |
|---|---|
| CZT HV Monitor | 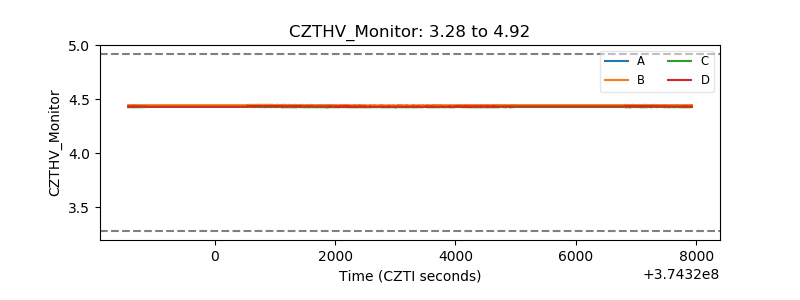 |
| D_VDD | 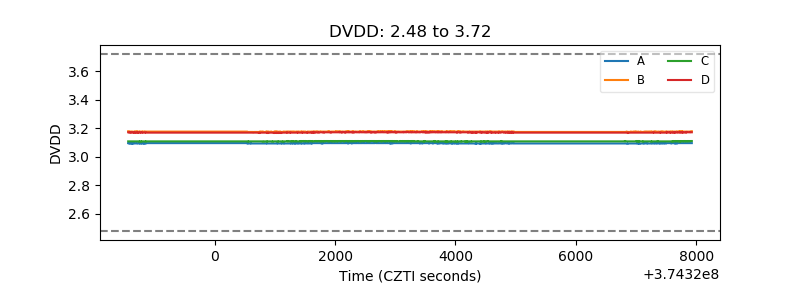 |
| Temperature 1 | 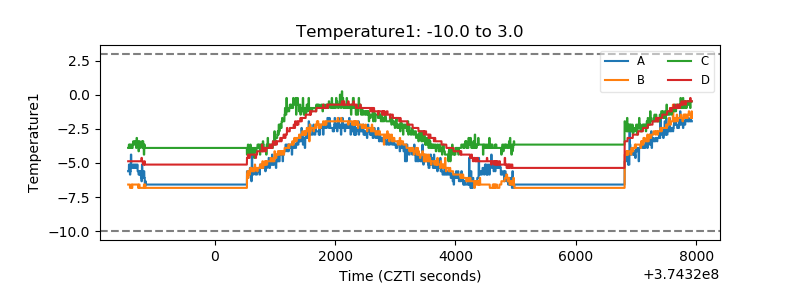 |
| Veto HV Monitor | 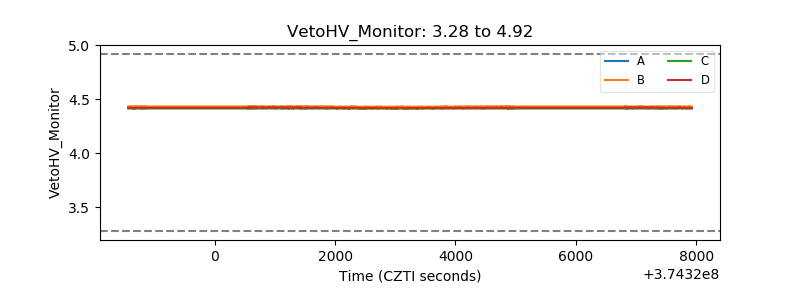 |
| Veto LLD | 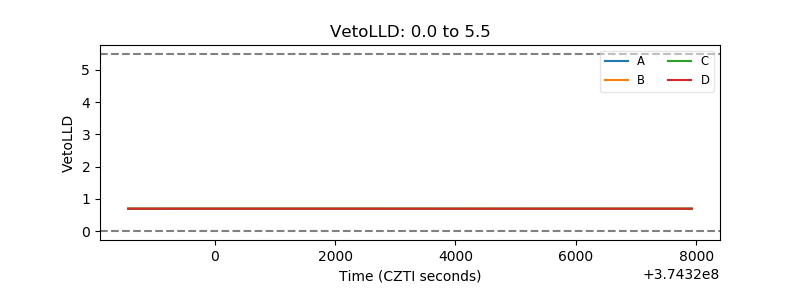 |
| Alpha Counter |  |
| _CPM_Rate | 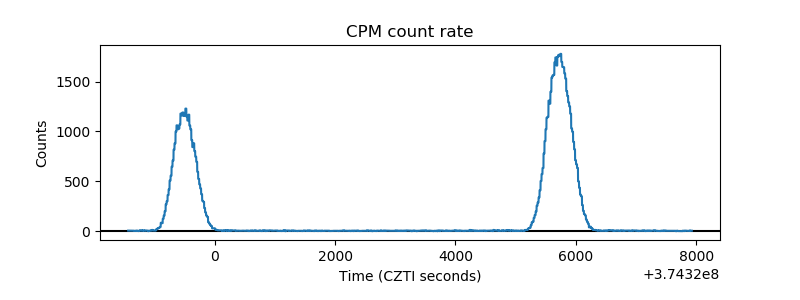 |
| CZT Counter | 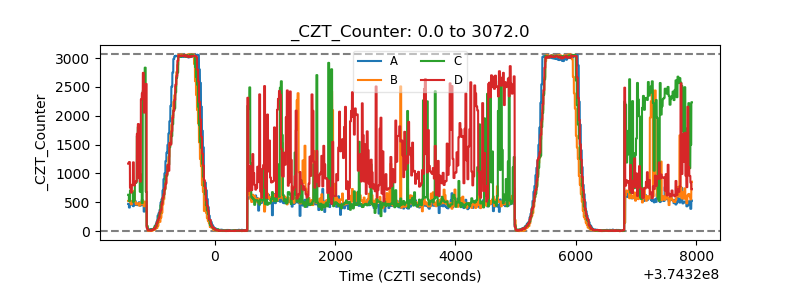 |
| +2.5 Volts monitor |  |
| +5 Volts monitor |  |
| _ROLL_ROT | 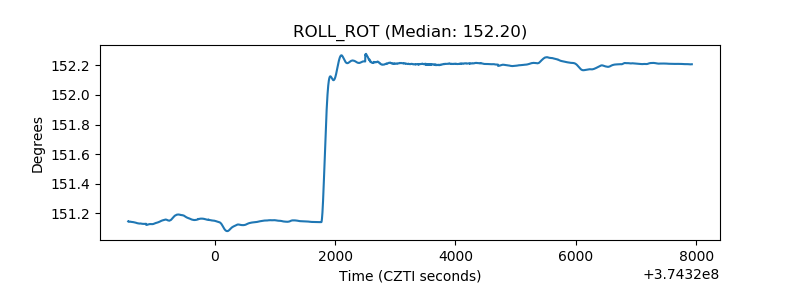 |
| _Roll_DEC | 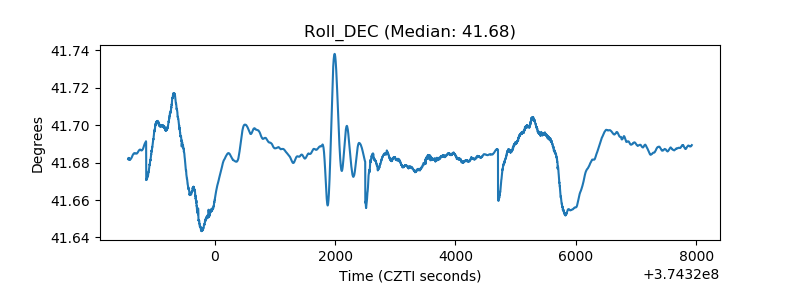 |
| _Roll_RA | 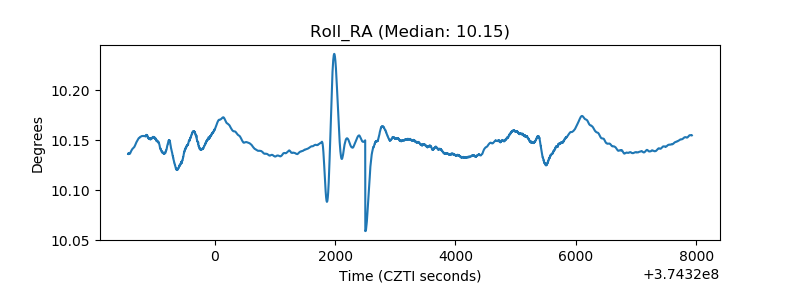 |
| Veto Counter | 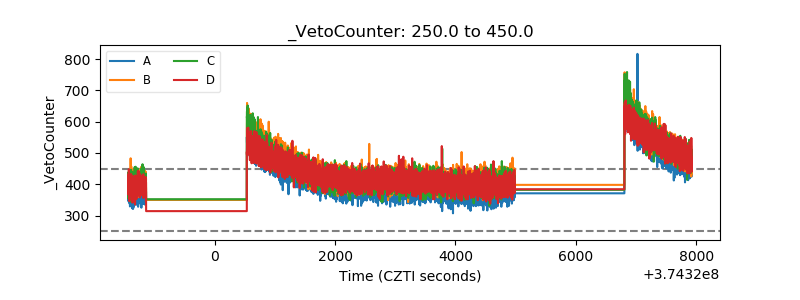 |