| Param | Original file | Final file |
|---|---|---|
| Filename | modeM0/AS1A11_008T06_9000004762_33103cztM0_level2.evt | modeM0/AS1A11_008T06_9000004762_33103cztM0_level2_quad_clean.evt |
| Size (bytes) | 717,189,120 | 90,633,600 |
| Size | 684.0 MB | 86.4 MB |
| Events in quadrant A | 2,467,207 | 684,355 |
| Events in quadrant B | 3,775,514 | 651,432 |
| Events in quadrant C | 8,678,944 | 473,378 |
| Events in quadrant D | 6,468,099 | 590,316 |
| Mode M9 | |||
|---|---|---|---|
| Quadrant | BADHDUFLAG | Total packets | Discarded packets |
| A | 0 | 19 | 0 |
| B | 0 | 19 | 0 |
| C | 0 | 19 | 0 |
| D | 0 | 19 | 0 |
| Mode SS | |||
|---|---|---|---|
| Quadrant | BADHDUFLAG | Total packets | Discarded packets |
| A | 0 | 100 | 0 |
| B | 0 | 100 | 0 |
| C | 0 | 100 | 0 |
| D | 0 | 100 | 0 |
| Mode M0 | |||
|---|---|---|---|
| Quadrant | BADHDUFLAG | Total packets | Discarded packets |
| A | 0 | 10289 | 2 |
| B | 0 | 14372 | 1 |
| C | 0 | 29115 | 1 |
| D | 0 | 22732 | 1 |
| Quadrant | Total seconds | Saturated seconds | Saturation percentage |
|---|---|---|---|
| A | 4896 | 5 | 0.102124% |
| B | 4896 | 437 | 8.925654% |
| C | 4896 | 2698 | 55.106209% |
| D | 4896 | 720 | 14.705882% |
Noise dominated data is calculated using 1-second bins in cleaned event files. If a bin has >2000 counts, and if more than 50% of those come from <1% of pixels, then it is considered to be noise-dominated and hence unusable.
| Quadrant | # 1 sec bins | Bins with >0 counts | Bins with >2000 counts | High rate bins dominated by noise | Noise dominated (total time) | Noise dominated (detector-on time) | Marked lightcurve |
|---|---|---|---|---|---|---|---|
| A | 6839 | 4897 | 0 | 0 | 0.00% | 0.00% | 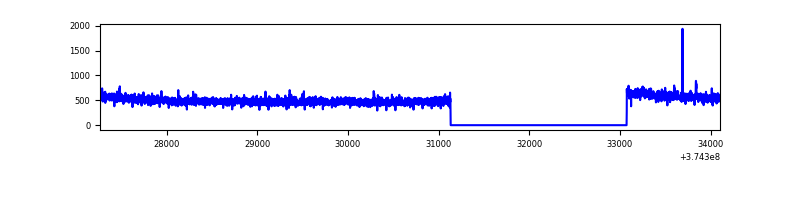 |
| B | 6839 | 4897 | 319 | 319 | 4.66% | 6.51% | 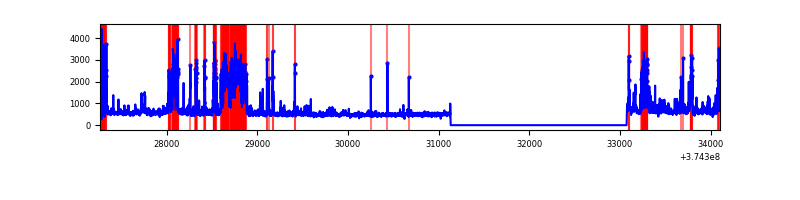 |
| C | 6839 | 4897 | 2142 | 2142 | 31.32% | 43.74% | 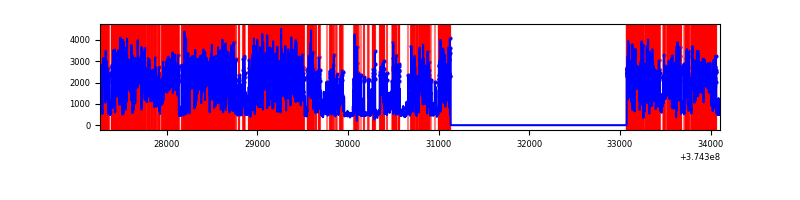 |
| D | 6839 | 4897 | 753 | 753 | 11.01% | 15.38% | 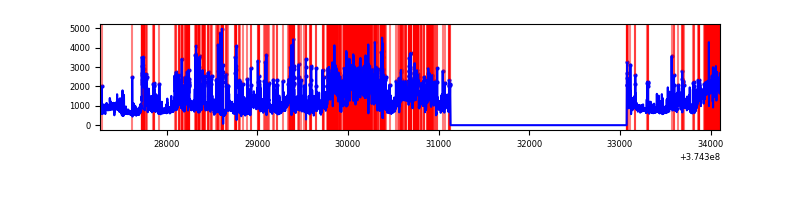 |
Top three noisy pixels from each quadrant. If the there are fewer than three noisy pixels in the level2.evt file, extra rows are filled as -1
| Pixel properties | Quadrant properties | ||||||
|---|---|---|---|---|---|---|---|
| Quadrant | DetID | PixID | Counts | Sigma | Mean | Median | Sigma |
| A | 13 | 6 | 14535 | 111.96 | 632 | 623 | 124.3 |
| A | 13 | 254 | 8786 | 65.7 | 632 | 623 | 124.3 |
| A | 7 | 16 | 8181 | 60.83 | 632 | 623 | 124.3 |
| B | 5 | 172 | 1147840 | 10172.28 | 600 | 587 | 112.8 |
| B | 0 | 189 | 123504 | 1089.86 | 600 | 587 | 112.8 |
| B | 0 | 219 | 46992 | 411.46 | 600 | 587 | 112.8 |
| C | 8 | 111 | 6466269 | 61265.95 | 461 | 466 | 105.5 |
| C | 0 | 10 | 116707 | 1101.43 | 461 | 466 | 105.5 |
| C | 7 | 221 | 89577 | 844.36 | 461 | 466 | 105.5 |
| D | 7 | 223 | 1767222 | 11709.34 | 582 | 571 | 150.9 |
| D | 8 | 195 | 890139 | 5896.04 | 582 | 571 | 150.9 |
| D | 12 | 218 | 827337 | 5479.79 | 582 | 571 | 150.9 |
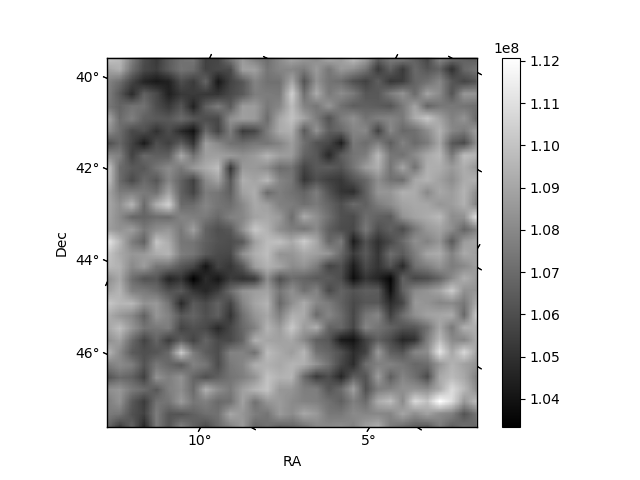
Histogram calculated using DETX and DETY for each event in the final _common_clean file
| Quadrant A | 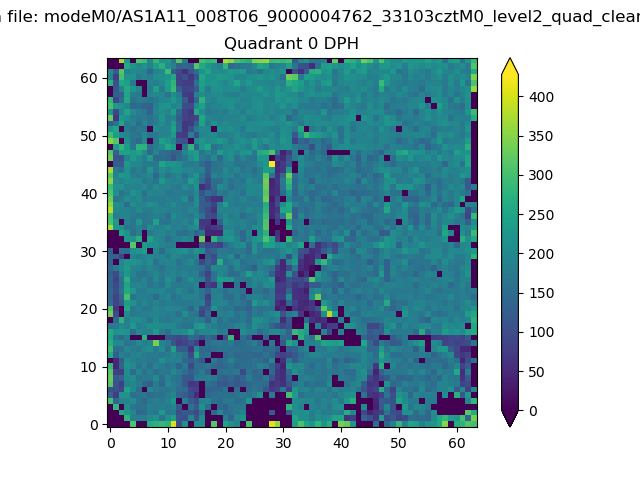 |
 |
Quadrant B |
|---|---|---|---|
| Quadrant D |  |
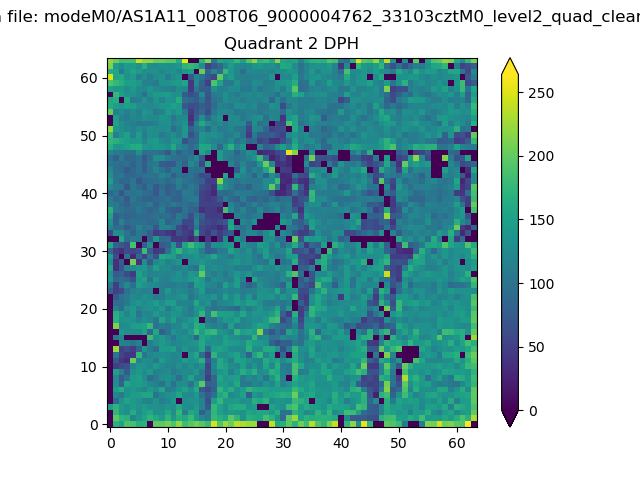 |
Quadrant C |
| Plot type | Count rate plots | Images |
|---|---|---|
| Comparison with Poisson distribution Blue bars denote a histogram of data divided into 1 sec bins. Red curve is a Poisson curve with rate = median count rate of data. |
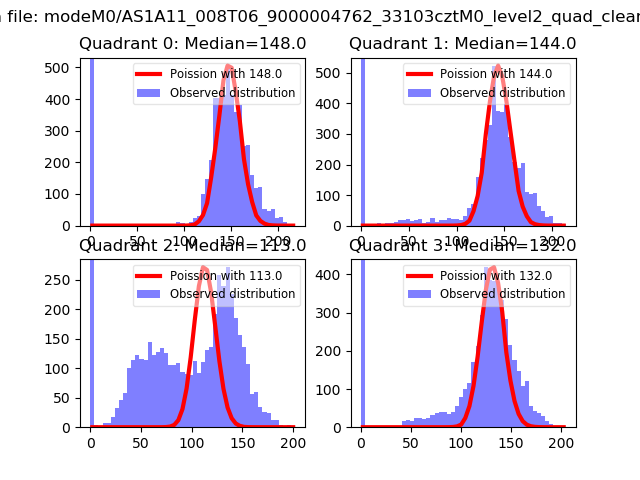 |
 |
| Quadrant-wise count rates Data is divided into 100 sec bins |
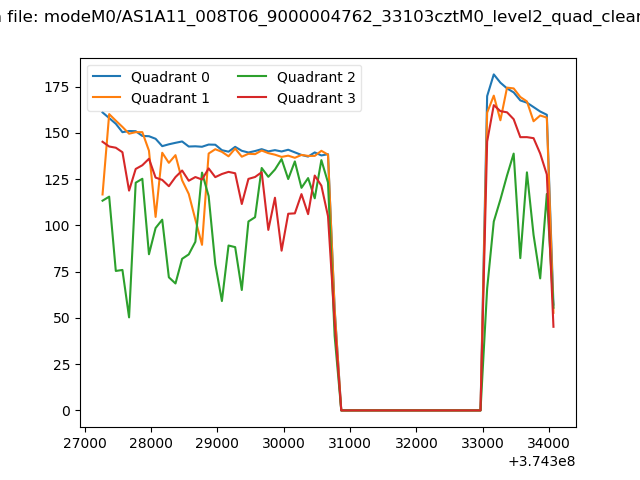 |
|
| Module-wise count rates for Quadrant A Data is divided into 100 sec bins |
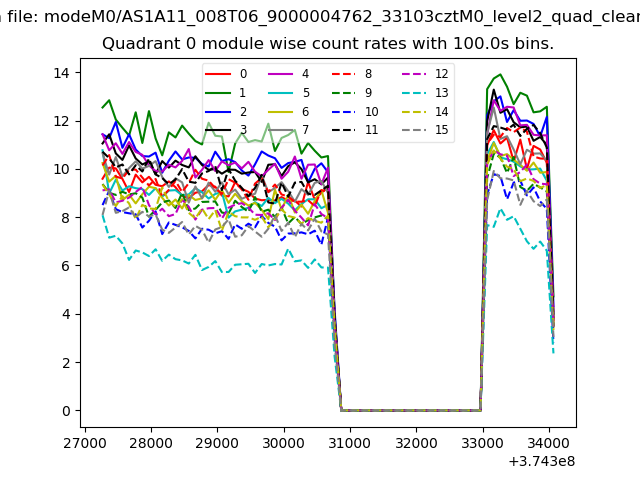 |
 |
| Module-wise count rates for Quadrant B Data is divided into 100 sec bins |
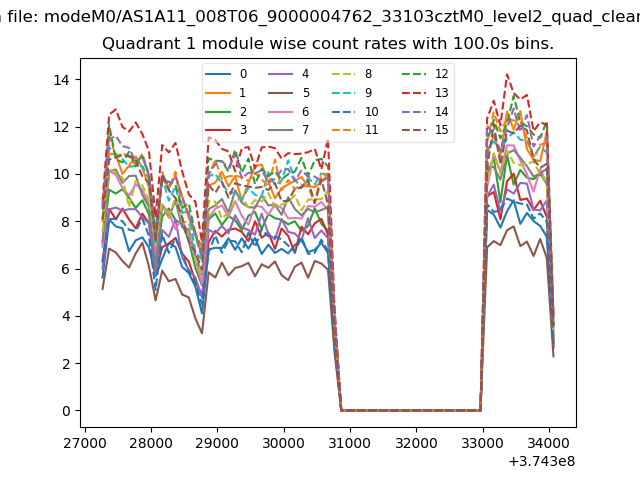 |
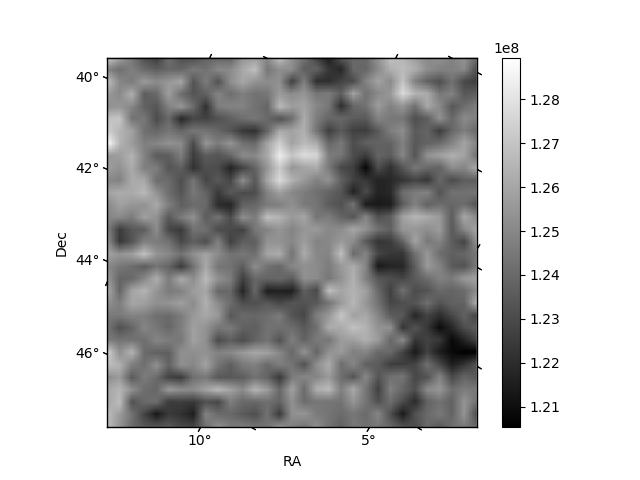 |
| Module-wise count rates for Quadrant C Data is divided into 100 sec bins |
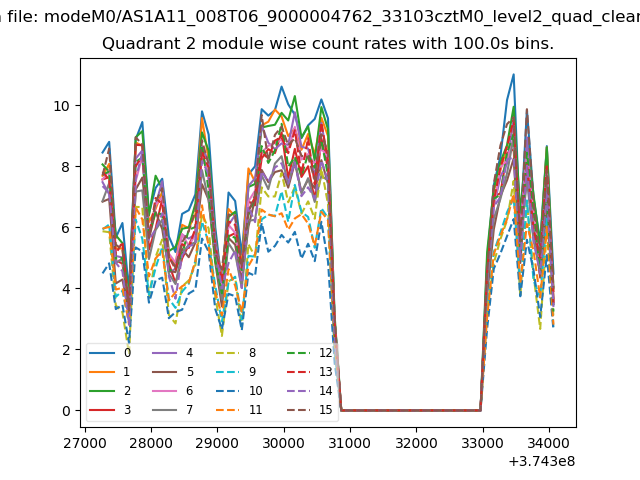 |
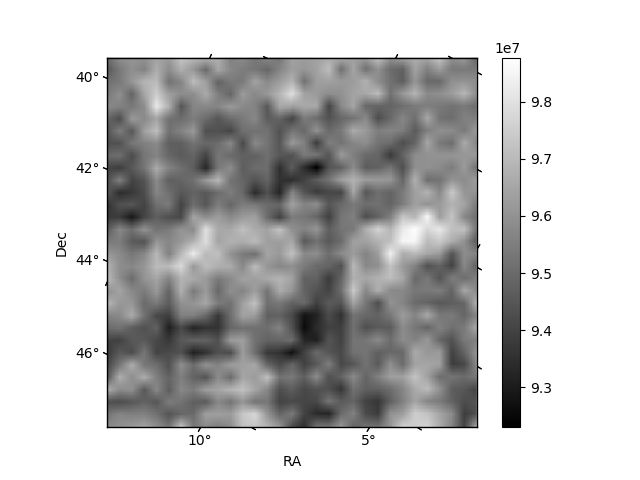 |
| Module-wise count rates for Quadrant D Data is divided into 100 sec bins |
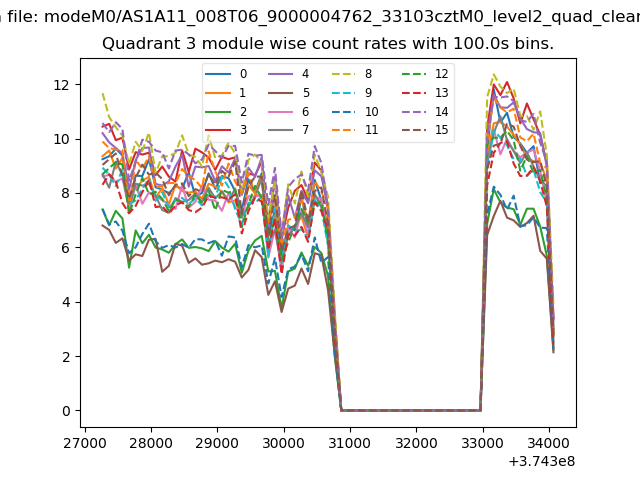 |
 |
| Parameter | Plot |
|---|---|
| CZT HV Monitor | 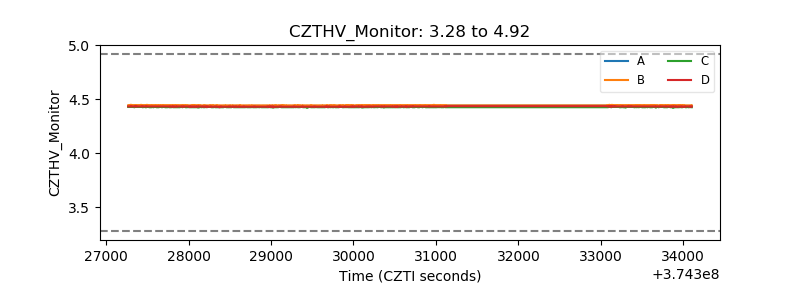 |
| D_VDD | 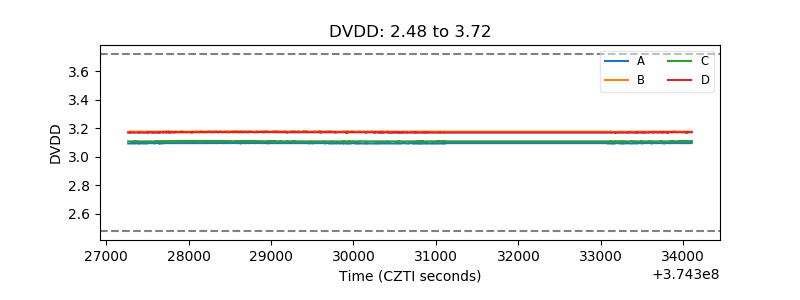 |
| Temperature 1 | 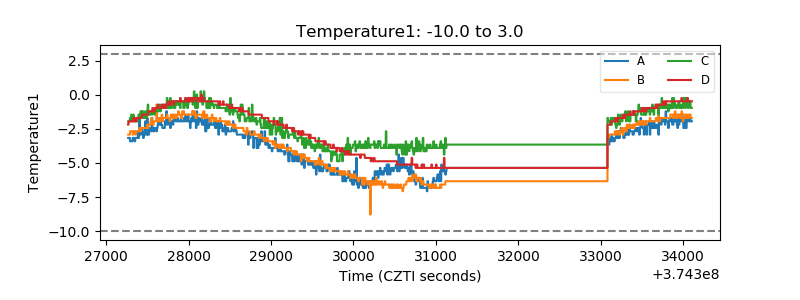 |
| Veto HV Monitor | 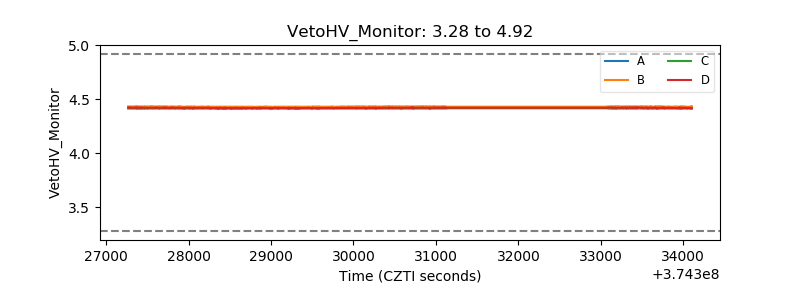 |
| Veto LLD | 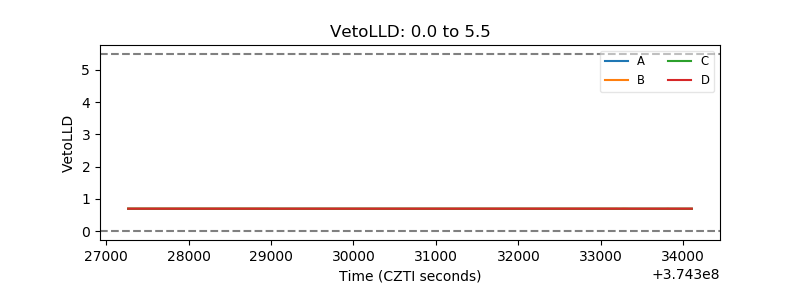 |
| Alpha Counter | 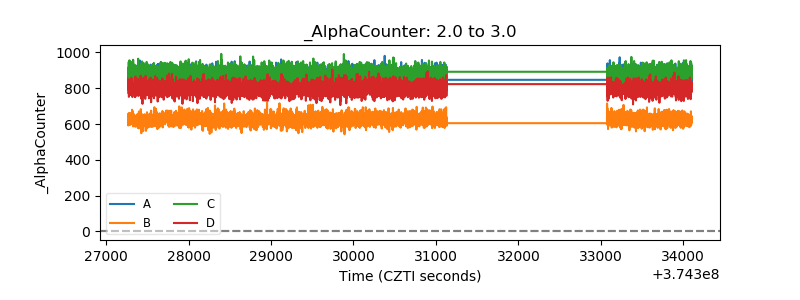 |
| _CPM_Rate | 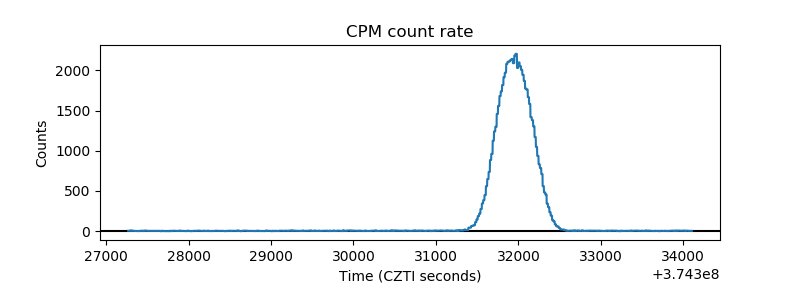 |
| CZT Counter | 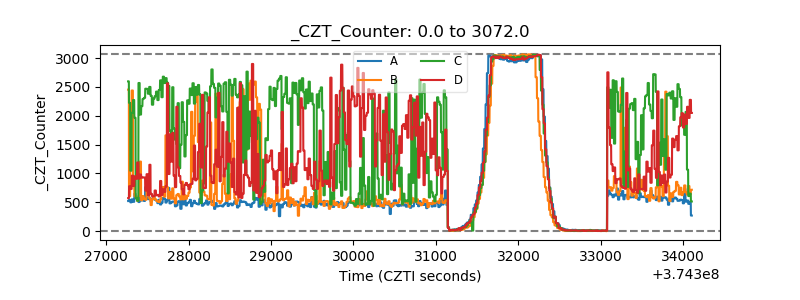 |
| +2.5 Volts monitor |  |
| +5 Volts monitor |  |
| _ROLL_ROT | 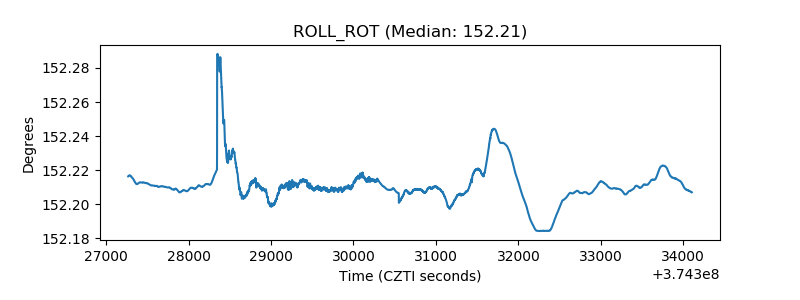 |
| _Roll_DEC | 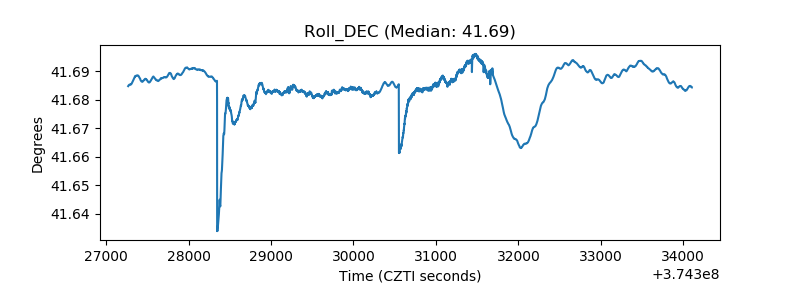 |
| _Roll_RA | 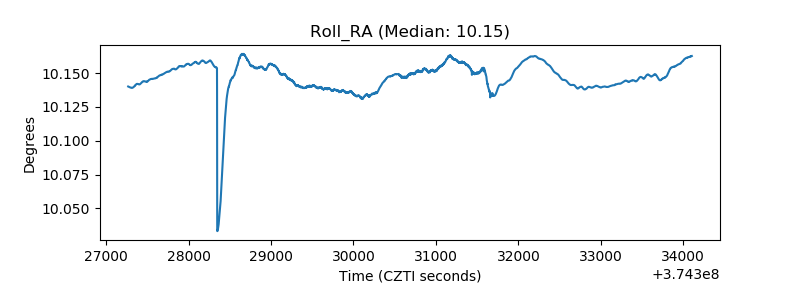 |
| Veto Counter | 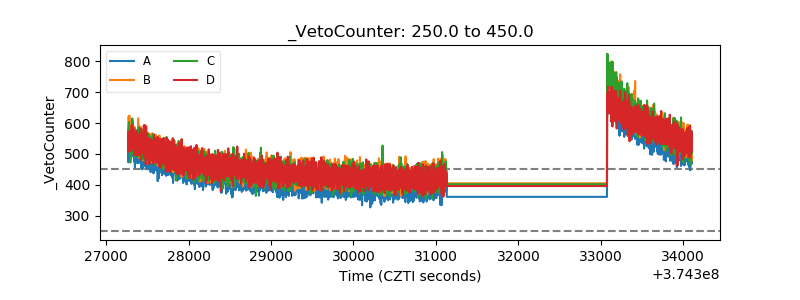 |