| Param | Original file | Final file |
|---|---|---|
| Filename | modeM0/AS1A11_008T06_9000004762_33104cztM0_level2.evt | modeM0/AS1A11_008T06_9000004762_33104cztM0_level2_quad_clean.evt |
| Size (bytes) | 679,798,080 | 91,497,600 |
| Size | 648.3 MB | 87.3 MB |
| Events in quadrant A | 2,585,696 | 685,551 |
| Events in quadrant B | 3,434,561 | 660,653 |
| Events in quadrant C | 7,423,823 | 492,361 |
| Events in quadrant D | 6,805,236 | 579,433 |
| Mode M9 | |||
|---|---|---|---|
| Quadrant | BADHDUFLAG | Total packets | Discarded packets |
| A | 0 | 21 | 0 |
| B | 0 | 21 | 0 |
| C | 0 | 21 | 0 |
| D | 0 | 21 | 0 |
| Mode SS | |||
|---|---|---|---|
| Quadrant | BADHDUFLAG | Total packets | Discarded packets |
| A | 0 | 102 | 0 |
| B | 0 | 102 | 0 |
| C | 0 | 102 | 0 |
| D | 0 | 102 | 0 |
| Mode M0 | |||
|---|---|---|---|
| Quadrant | BADHDUFLAG | Total packets | Discarded packets |
| A | 0 | 10652 | 2 |
| B | 0 | 13462 | 1 |
| C | 0 | 25461 | 1 |
| D | 0 | 23770 | 1 |
| Quadrant | Total seconds | Saturated seconds | Saturation percentage |
|---|---|---|---|
| A | 5013 | 3 | 0.059844% |
| B | 5013 | 235 | 4.687812% |
| C | 5013 | 2101 | 41.911031% |
| D | 5013 | 1095 | 21.843208% |
Noise dominated data is calculated using 1-second bins in cleaned event files. If a bin has >2000 counts, and if more than 50% of those come from <1% of pixels, then it is considered to be noise-dominated and hence unusable.
| Quadrant | # 1 sec bins | Bins with >0 counts | Bins with >2000 counts | High rate bins dominated by noise | Noise dominated (total time) | Noise dominated (detector-on time) | Marked lightcurve |
|---|---|---|---|---|---|---|---|
| A | 7076 | 5014 | 0 | 0 | 0.00% | 0.00% | 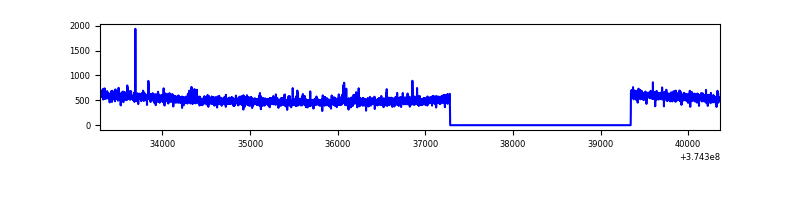 |
| B | 7076 | 5014 | 140 | 140 | 1.98% | 2.79% | 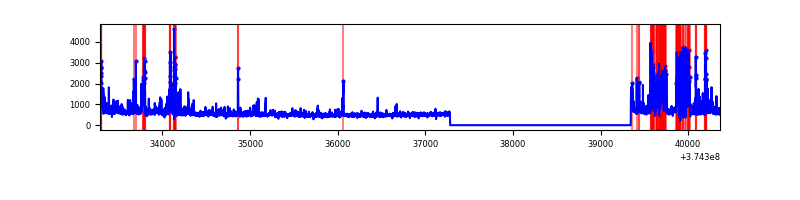 |
| C | 7076 | 5014 | 1630 | 1630 | 23.04% | 32.51% | 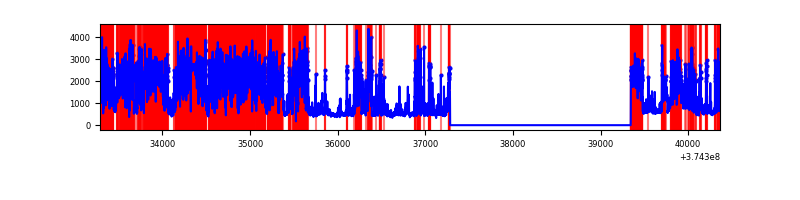 |
| D | 7076 | 5014 | 1103 | 1103 | 15.59% | 22.00% | 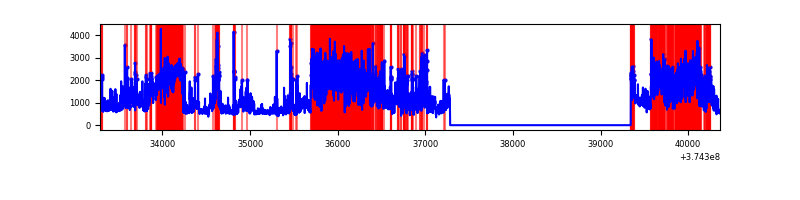 |
Top three noisy pixels from each quadrant. If the there are fewer than three noisy pixels in the level2.evt file, extra rows are filled as -1
| Pixel properties | Quadrant properties | ||||||
|---|---|---|---|---|---|---|---|
| Quadrant | DetID | PixID | Counts | Sigma | Mean | Median | Sigma |
| A | 13 | 6 | 10667 | 76.47 | 661 | 650 | 131.0 |
| A | 13 | 254 | 8398 | 59.15 | 661 | 650 | 131.0 |
| A | 7 | 16 | 7542 | 52.62 | 661 | 650 | 131.0 |
| B | 5 | 172 | 617599 | 5243.17 | 634 | 623 | 117.7 |
| B | 0 | 189 | 153043 | 1295.29 | 634 | 623 | 117.7 |
| B | 0 | 245 | 47837 | 401.23 | 634 | 623 | 117.7 |
| C | 8 | 111 | 4679001 | 40550.2 | 510 | 517 | 115.4 |
| C | 7 | 221 | 306583 | 2652.79 | 510 | 517 | 115.4 |
| C | 0 | 10 | 213742 | 1848.1 | 510 | 517 | 115.4 |
| D | 7 | 223 | 2658203 | 17163.94 | 602 | 592 | 154.8 |
| D | 8 | 195 | 763648 | 4928.13 | 602 | 592 | 154.8 |
| D | 12 | 218 | 320774 | 2067.87 | 602 | 592 | 154.8 |
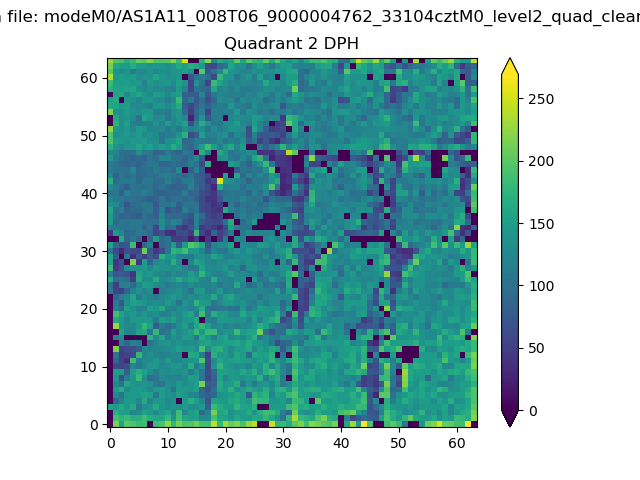
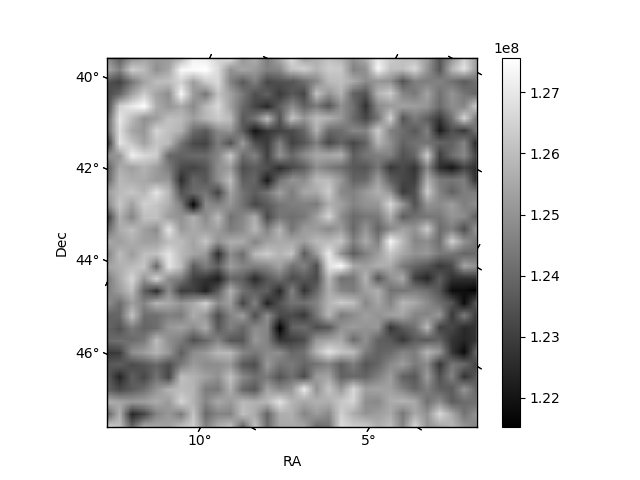
Histogram calculated using DETX and DETY for each event in the final _common_clean file
| Quadrant A |  |
 |
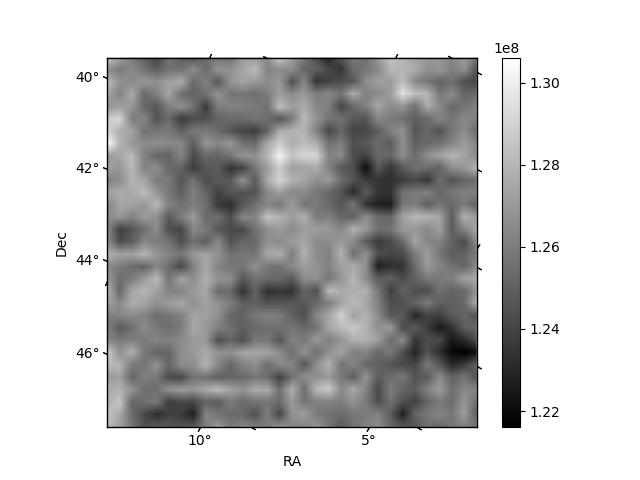
Quadrant B |
|---|---|---|---|
| Quadrant D |  |
 |
Quadrant C |
| Plot type | Count rate plots | Images |
|---|---|---|
| Comparison with Poisson distribution Blue bars denote a histogram of data divided into 1 sec bins. Red curve is a Poisson curve with rate = median count rate of data. |
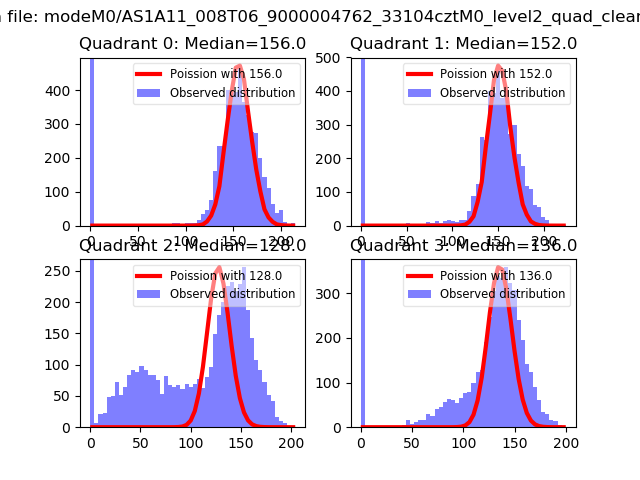 |
 |
| Quadrant-wise count rates Data is divided into 100 sec bins |
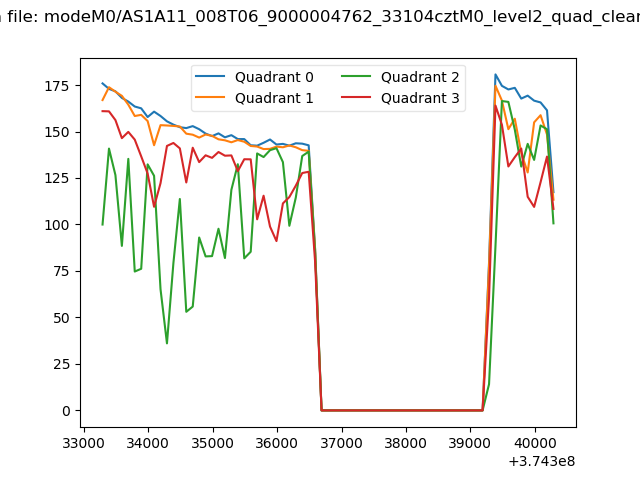 |
|
| Module-wise count rates for Quadrant A Data is divided into 100 sec bins |
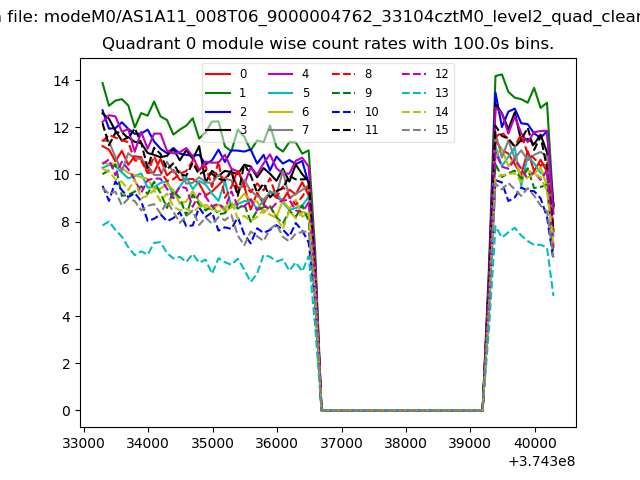 |
 |
| Module-wise count rates for Quadrant B Data is divided into 100 sec bins |
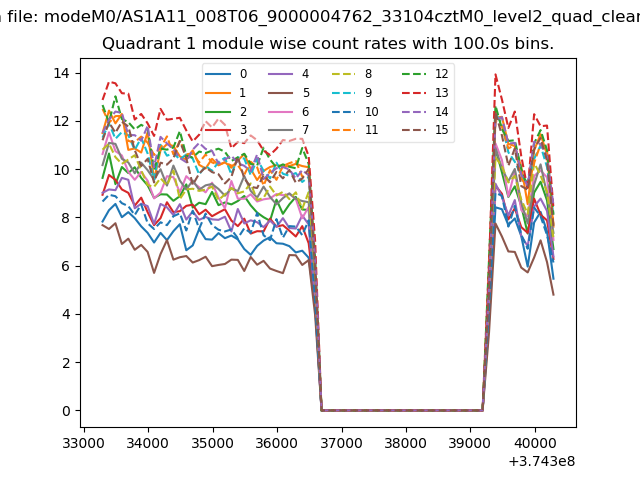 |
 |
| Module-wise count rates for Quadrant C Data is divided into 100 sec bins |
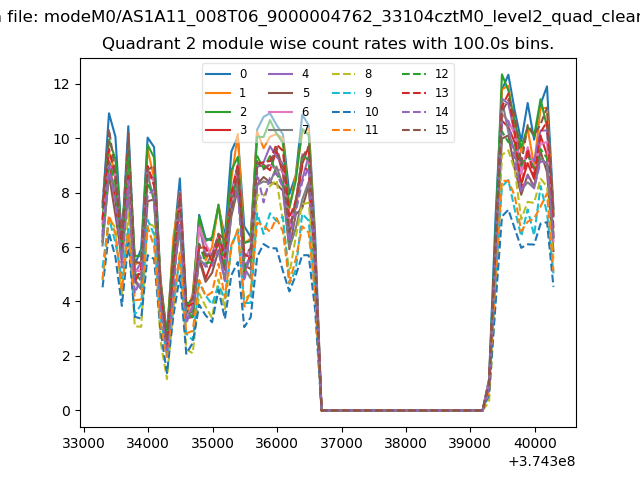 |
 |
| Module-wise count rates for Quadrant D Data is divided into 100 sec bins |
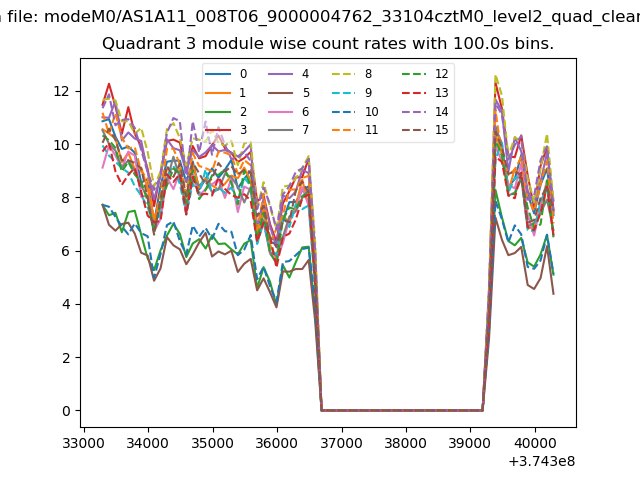 |
 |
| Parameter | Plot |
|---|---|
| CZT HV Monitor | 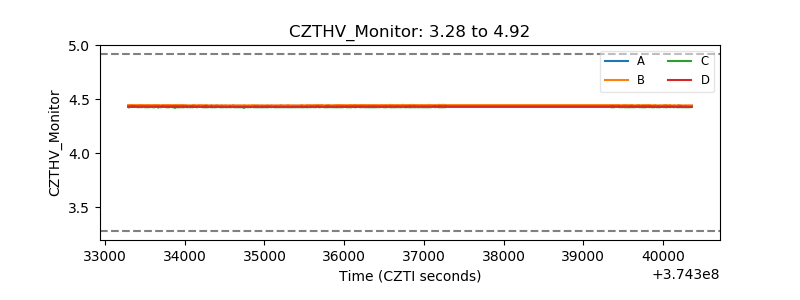 |
| D_VDD | 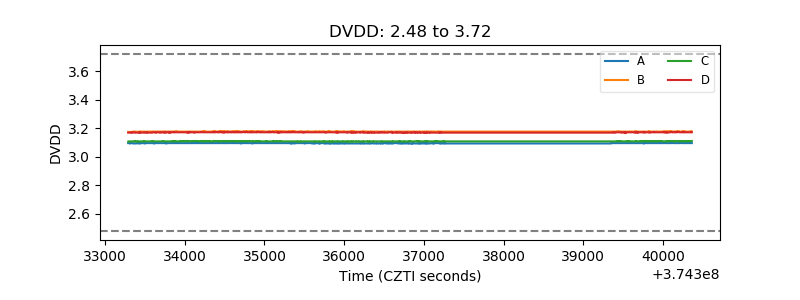 |
| Temperature 1 | 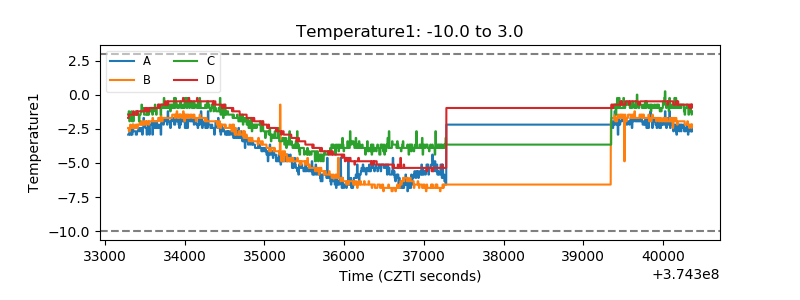 |
| Veto HV Monitor | 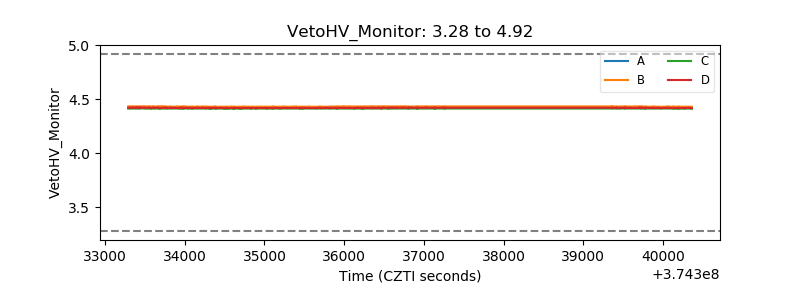 |
| Veto LLD | 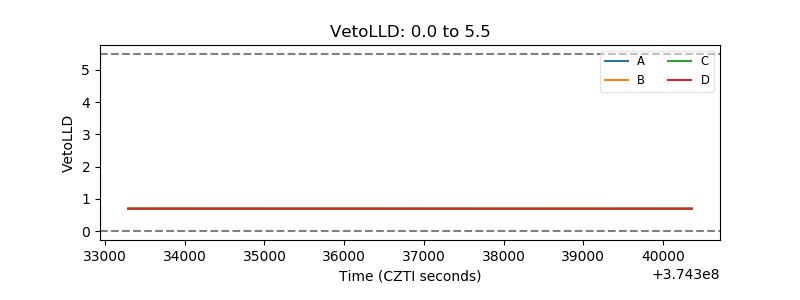 |
| Alpha Counter | 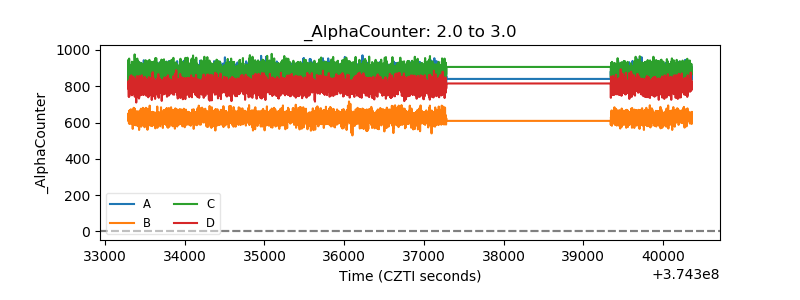 |
| _CPM_Rate | 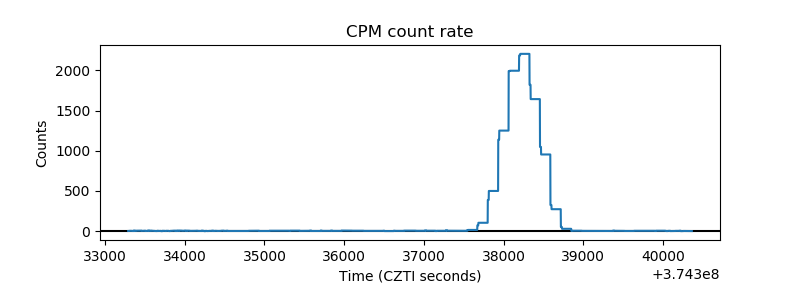 |
| CZT Counter | 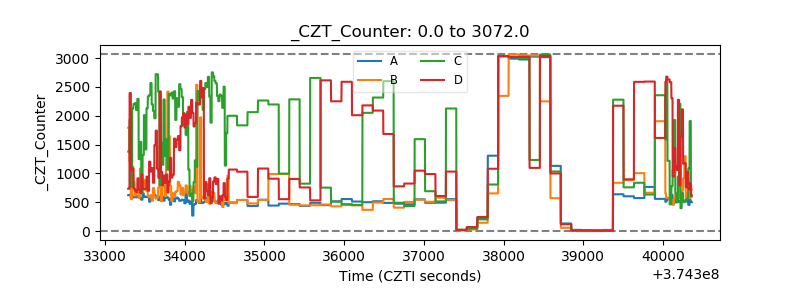 |
| +2.5 Volts monitor |  |
| +5 Volts monitor | 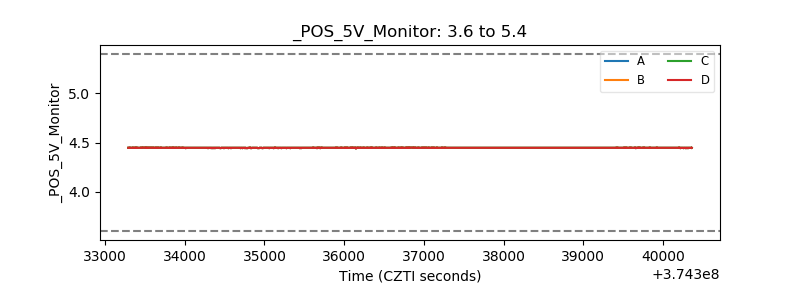 |
| _ROLL_ROT | 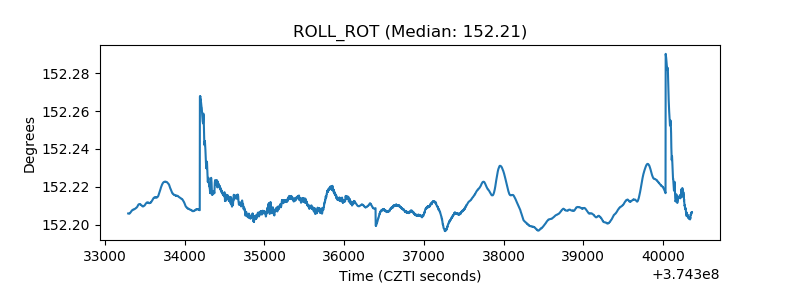 |
| _Roll_DEC | 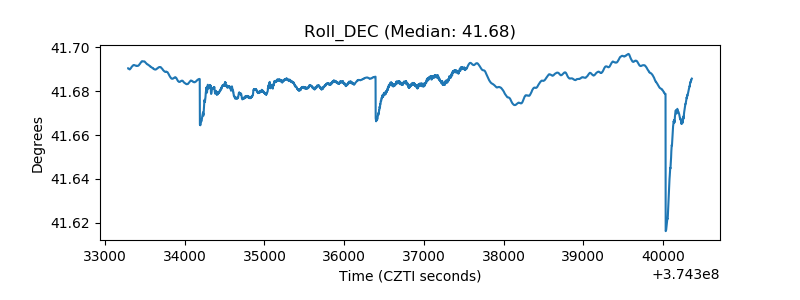 |
| _Roll_RA | 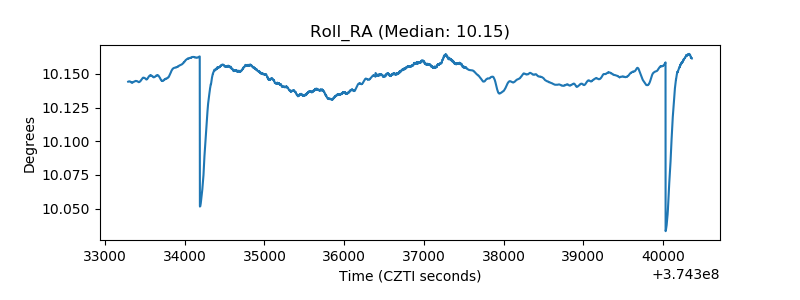 |
| Veto Counter | 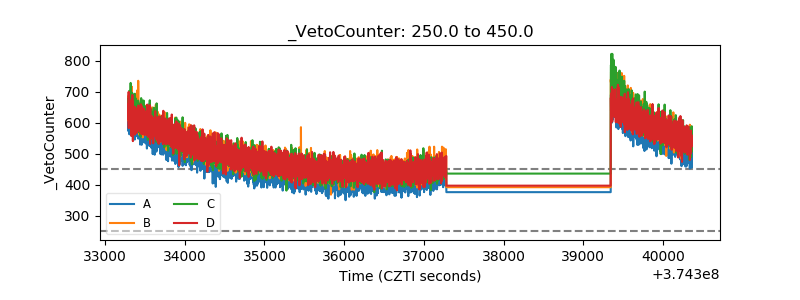 |