| Param | Original file | Final file |
|---|---|---|
| Filename | modeM0/AS1A11_008T06_9000004762_33105cztM0_level2.evt | modeM0/AS1A11_008T06_9000004762_33105cztM0_level2_quad_clean.evt |
| Size (bytes) | 667,146,240 | 84,228,480 |
| Size | 636.2 MB | 80.3 MB |
| Events in quadrant A | 2,512,120 | 613,985 |
| Events in quadrant B | 3,478,273 | 582,738 |
| Events in quadrant C | 6,523,366 | 501,190 |
| Events in quadrant D | 7,357,203 | 504,734 |
| Mode M9 | |||
|---|---|---|---|
| Quadrant | BADHDUFLAG | Total packets | Discarded packets |
| A | 0 | 21 | 0 |
| B | 0 | 21 | 0 |
| C | 0 | 21 | 0 |
| D | 0 | 21 | 0 |
| Mode SS | |||
|---|---|---|---|
| Quadrant | BADHDUFLAG | Total packets | Discarded packets |
| A | 0 | 100 | 0 |
| B | 0 | 100 | 0 |
| C | 0 | 100 | 0 |
| D | 0 | 100 | 0 |
| Mode M0 | |||
|---|---|---|---|
| Quadrant | BADHDUFLAG | Total packets | Discarded packets |
| A | 0 | 10290 | 2 |
| B | 0 | 13479 | 1 |
| C | 0 | 22756 | 1 |
| D | 0 | 25314 | 1 |
| Quadrant | Total seconds | Saturated seconds | Saturation percentage |
|---|---|---|---|
| A | 4948 | 2 | 0.040420% |
| B | 4948 | 305 | 6.164107% |
| C | 4948 | 1537 | 31.063056% |
| D | 4948 | 1281 | 25.889248% |
Noise dominated data is calculated using 1-second bins in cleaned event files. If a bin has >2000 counts, and if more than 50% of those come from <1% of pixels, then it is considered to be noise-dominated and hence unusable.
| Quadrant | # 1 sec bins | Bins with >0 counts | Bins with >2000 counts | High rate bins dominated by noise | Noise dominated (total time) | Noise dominated (detector-on time) | Marked lightcurve |
|---|---|---|---|---|---|---|---|
| A | 7071 | 4949 | 0 | 0 | 0.00% | 0.00% | 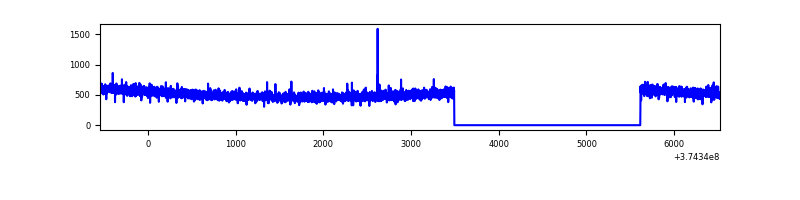 |
| B | 7071 | 4949 | 193 | 193 | 2.73% | 3.90% | 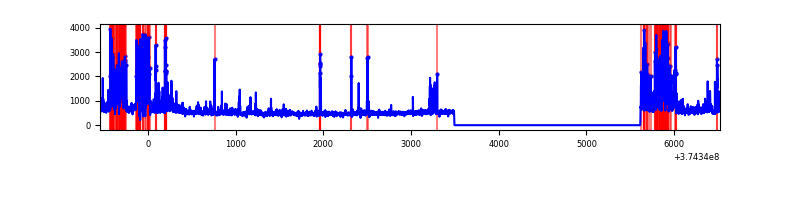 |
| C | 7071 | 4949 | 1132 | 1132 | 16.01% | 22.87% | 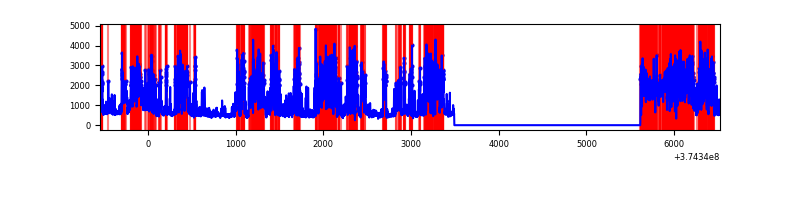 |
| D | 7071 | 4949 | 1312 | 1312 | 18.55% | 26.51% | 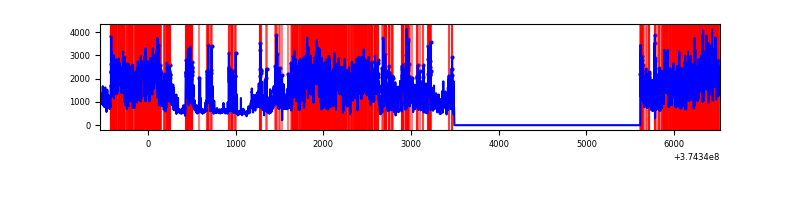 |
Top three noisy pixels from each quadrant. If the there are fewer than three noisy pixels in the level2.evt file, extra rows are filled as -1
| Pixel properties | Quadrant properties | ||||||
|---|---|---|---|---|---|---|---|
| Quadrant | DetID | PixID | Counts | Sigma | Mean | Median | Sigma |
| A | 15 | 47 | 18648 | 140.61 | 642 | 630 | 128.1 |
| A | 13 | 6 | 8741 | 63.3 | 642 | 630 | 128.1 |
| A | 13 | 254 | 8622 | 62.37 | 642 | 630 | 128.1 |
| B | 5 | 172 | 783450 | 6876.54 | 613 | 601 | 113.8 |
| B | 0 | 189 | 104642 | 913.9 | 613 | 601 | 113.8 |
| B | 0 | 245 | 68619 | 597.47 | 613 | 601 | 113.8 |
| C | 8 | 111 | 3182102 | 25816.46 | 543 | 551 | 123.2 |
| C | 1 | 23 | 424061 | 3436.54 | 543 | 551 | 123.2 |
| C | 7 | 221 | 248415 | 2011.27 | 543 | 551 | 123.2 |
| D | 7 | 223 | 3027696 | 20039.92 | 579 | 568 | 151.1 |
| D | 8 | 195 | 841020 | 5563.89 | 579 | 568 | 151.1 |
| D | 12 | 233 | 327371 | 2163.47 | 579 | 568 | 151.1 |
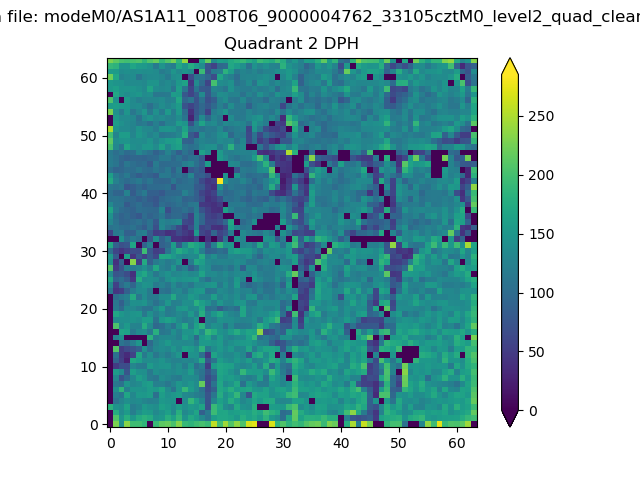
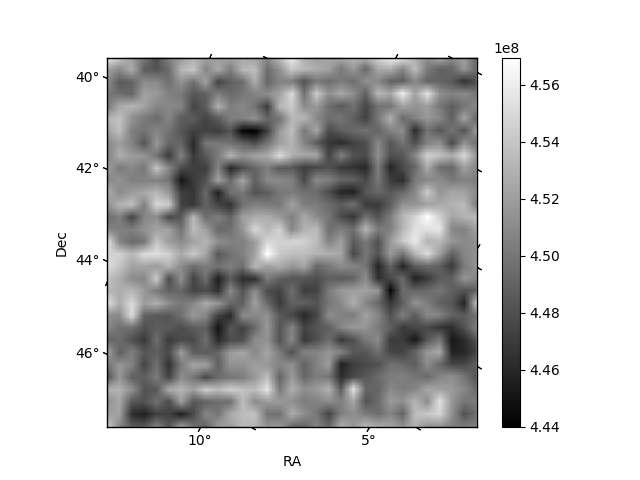
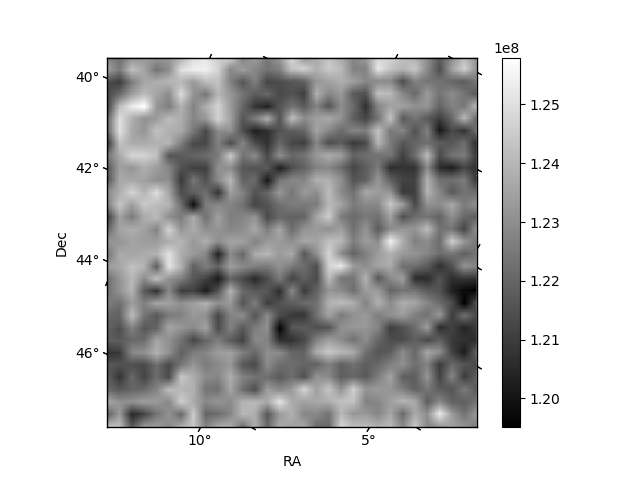
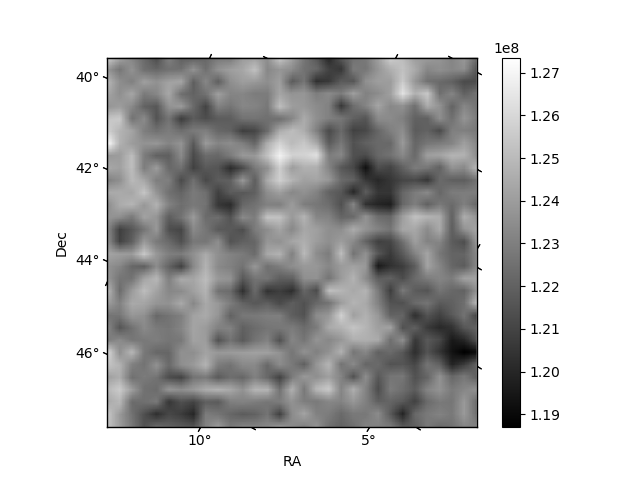
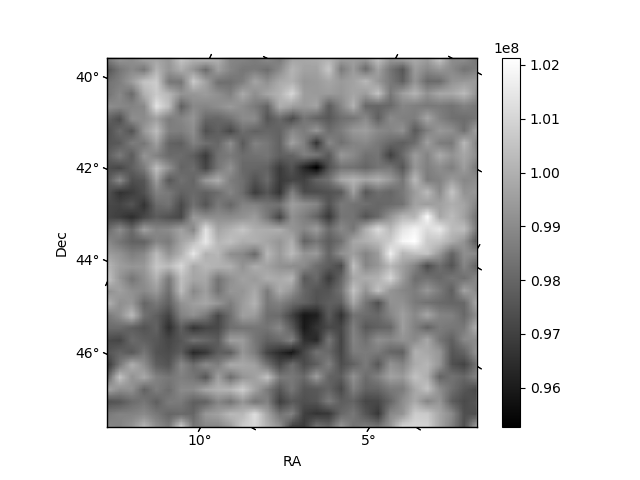
Histogram calculated using DETX and DETY for each event in the final _common_clean file
| Quadrant A | 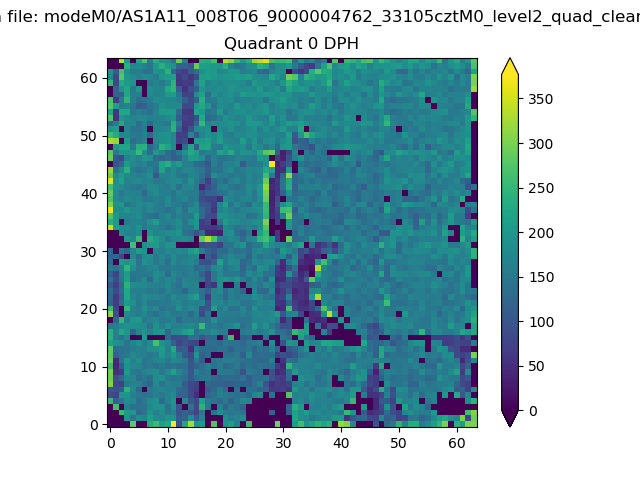 |
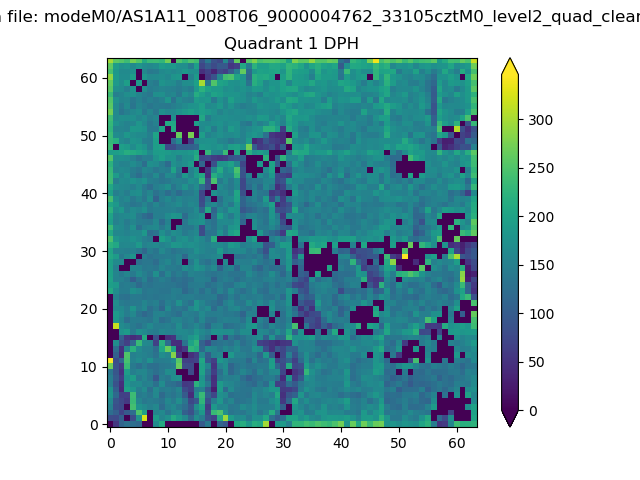 |
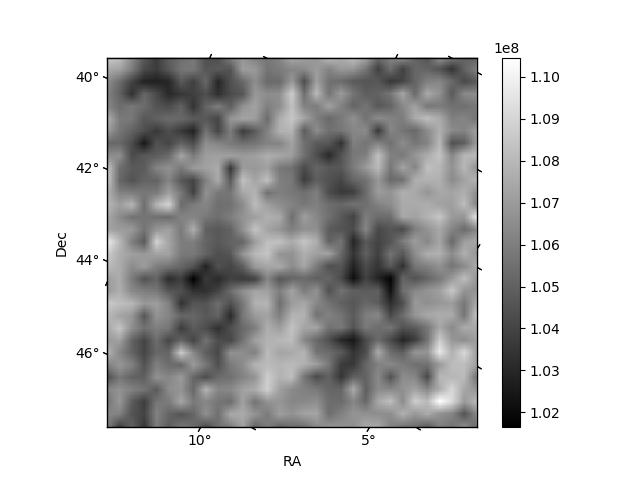
Quadrant B |
|---|---|---|---|
| Quadrant D | 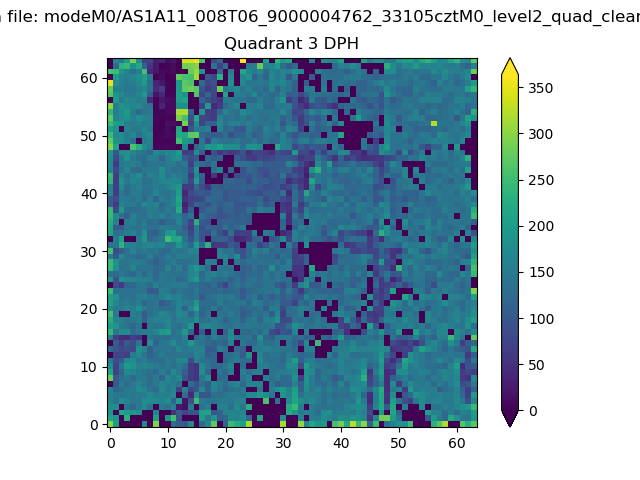 |
 |
Quadrant C |
| Plot type | Count rate plots | Images |
|---|---|---|
| Comparison with Poisson distribution Blue bars denote a histogram of data divided into 1 sec bins. Red curve is a Poisson curve with rate = median count rate of data. |
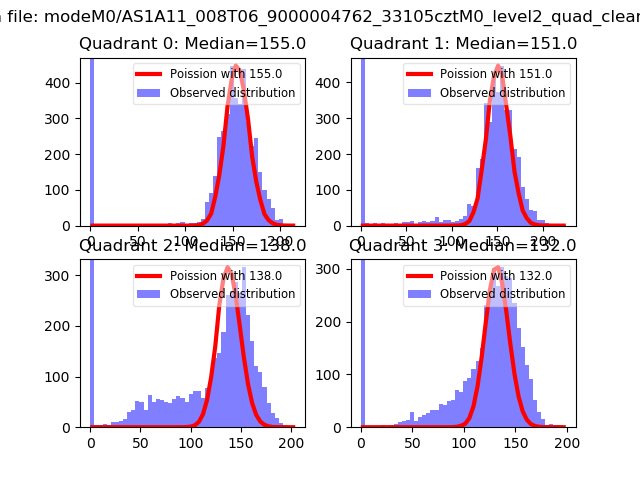 |
 |
| Quadrant-wise count rates Data is divided into 100 sec bins |
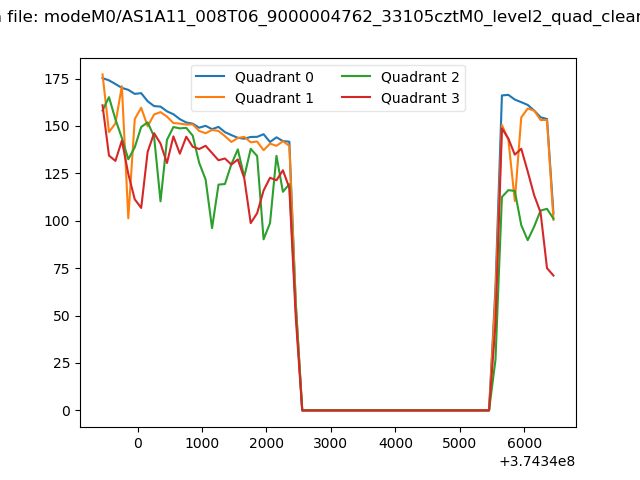 |
|
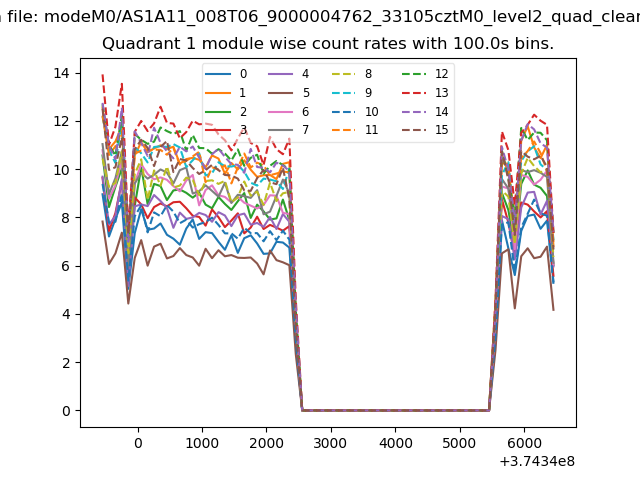
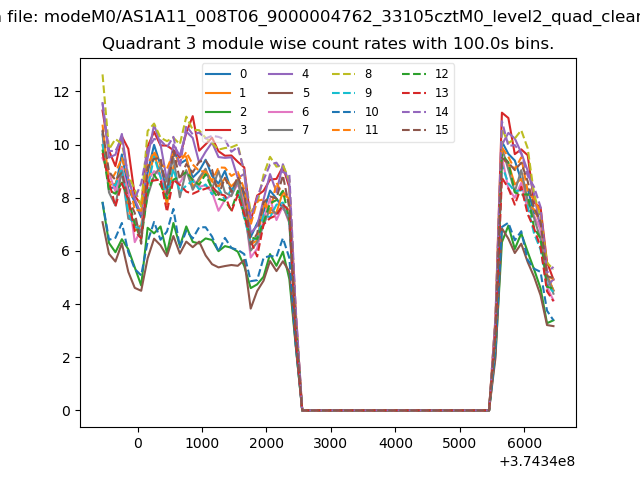
| Module-wise count rates for Quadrant A Data is divided into 100 sec bins |
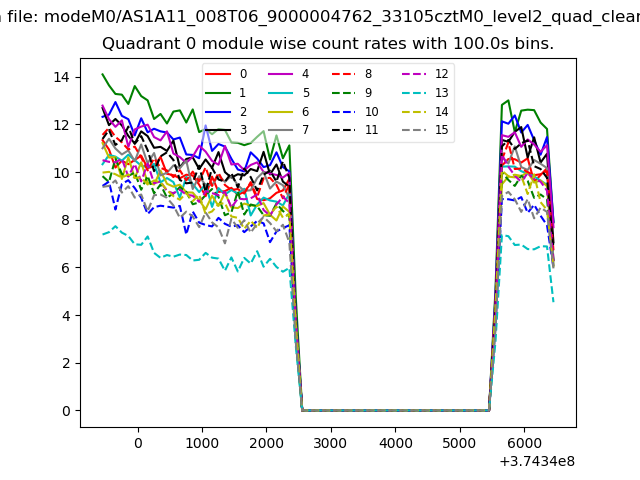 |
 |
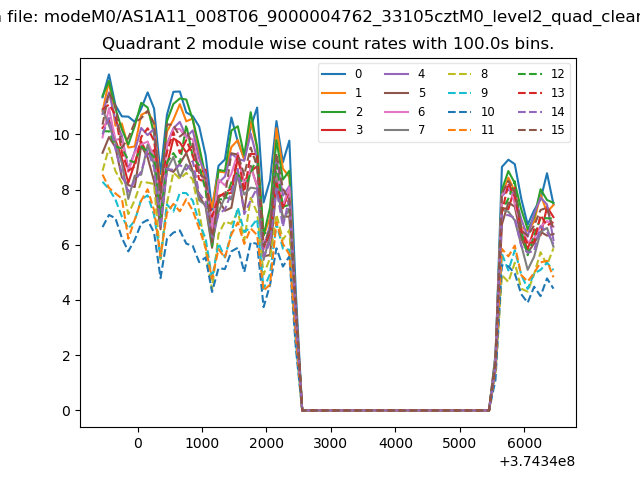
| Module-wise count rates for Quadrant B Data is divided into 100 sec bins |
 |
 |
| Module-wise count rates for Quadrant C Data is divided into 100 sec bins |
 |
 |
| Module-wise count rates for Quadrant D Data is divided into 100 sec bins |
 |
 |
| Parameter | Plot |
|---|---|
| CZT HV Monitor | 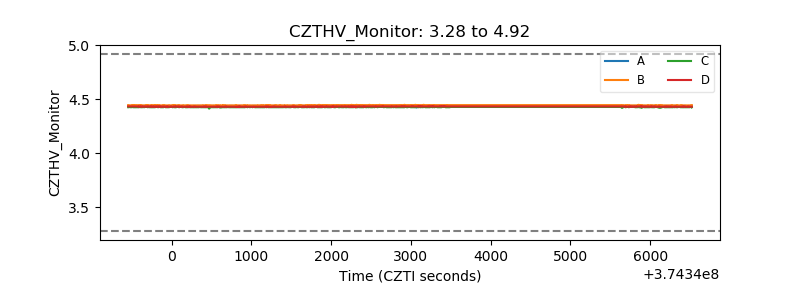 |
| D_VDD | 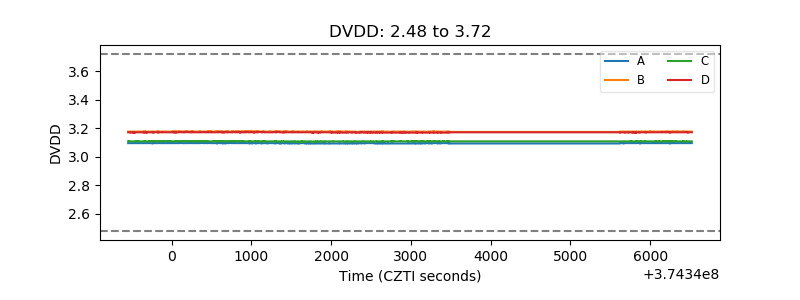 |
| Temperature 1 | 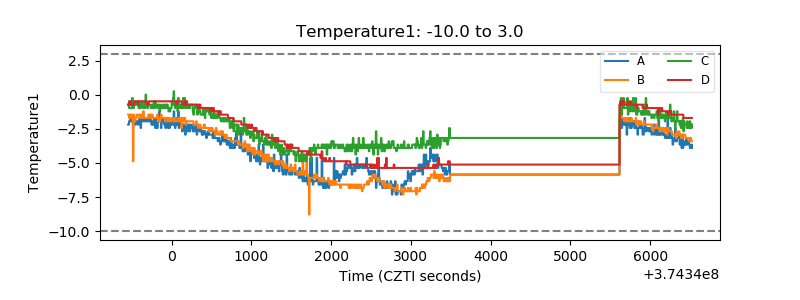 |
| Veto HV Monitor |  |
| Veto LLD | 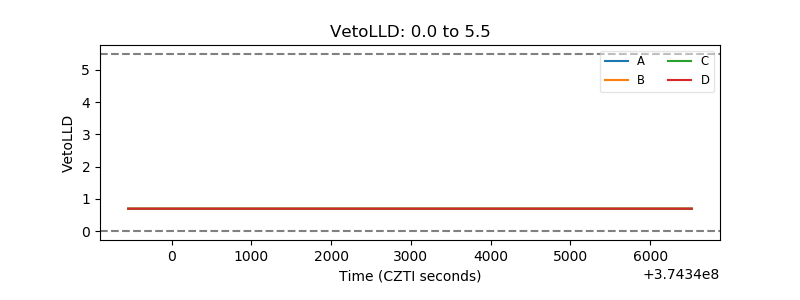 |
| Alpha Counter | 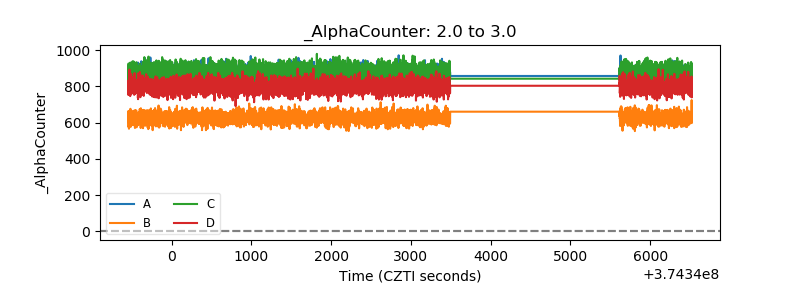 |
| _CPM_Rate | 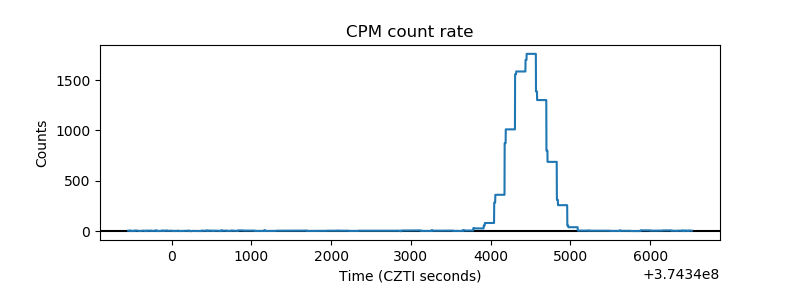 |
| CZT Counter | 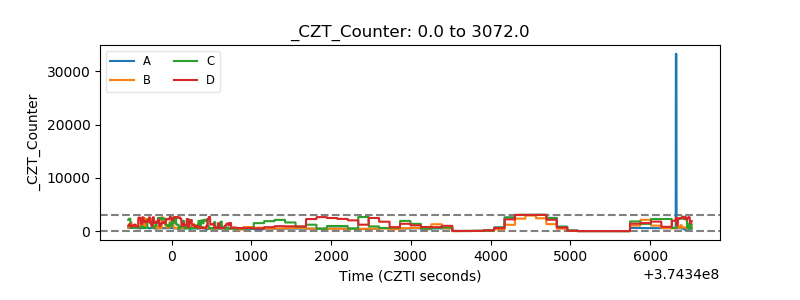 |
| +2.5 Volts monitor | 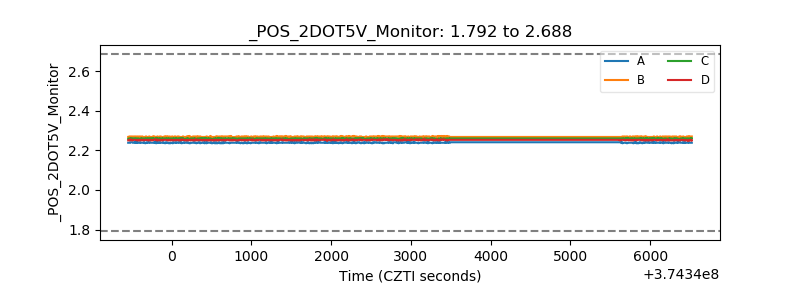 |
| +5 Volts monitor |  |
| _ROLL_ROT | 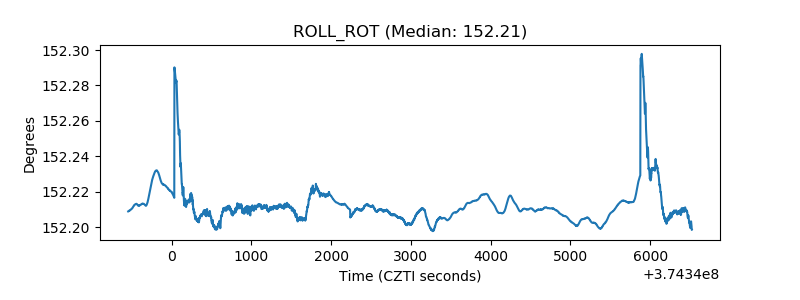 |
| _Roll_DEC | 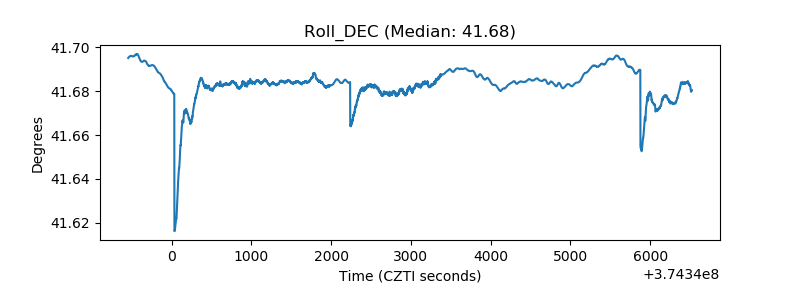 |
| _Roll_RA | 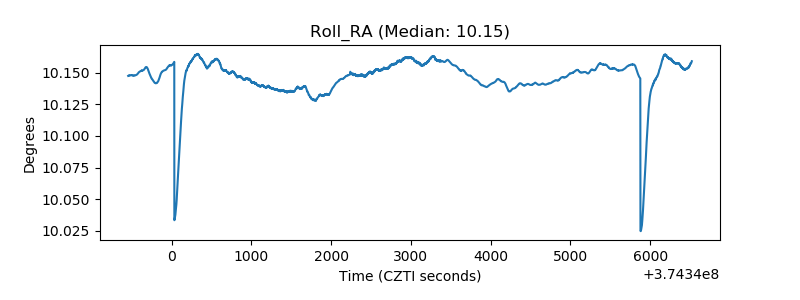 |
| Veto Counter | 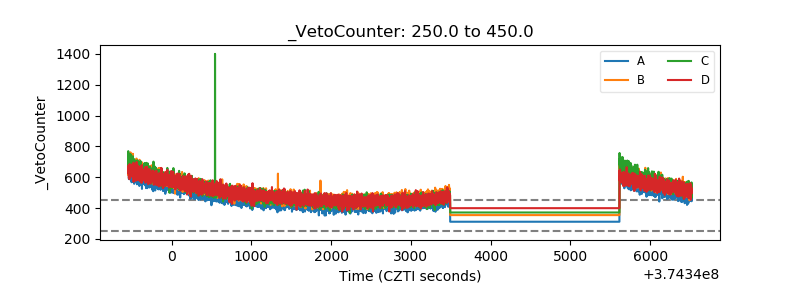 |