| Param | Original file | Final file |
|---|---|---|
| Filename | modeM0/AS1A11_008T06_9000004762_33106cztM0_level2.evt | modeM0/AS1A11_008T06_9000004762_33106cztM0_level2_quad_clean.evt |
| Size (bytes) | 610,300,800 | 72,089,280 |
| Size | 582.0 MB | 68.7 MB |
| Events in quadrant A | 2,387,430 | 514,344 |
| Events in quadrant B | 3,344,381 | 491,888 |
| Events in quadrant C | 5,311,121 | 436,482 |
| Events in quadrant D | 7,109,281 | 395,723 |
| Mode M9 | |||
|---|---|---|---|
| Quadrant | BADHDUFLAG | Total packets | Discarded packets |
| A | 0 | 29 | 0 |
| B | 0 | 29 | 0 |
| C | 0 | 29 | 0 |
| D | 0 | 30 | 0 |
| Mode SS | |||
|---|---|---|---|
| Quadrant | BADHDUFLAG | Total packets | Discarded packets |
| A | 0 | 102 | 0 |
| B | 0 | 102 | 0 |
| C | 0 | 102 | 0 |
| D | 0 | 102 | 0 |
| Mode M0 | |||
|---|---|---|---|
| Quadrant | BADHDUFLAG | Total packets | Discarded packets |
| A | 0 | 9984 | 3 |
| B | 0 | 13027 | 2 |
| C | 0 | 19016 | 2 |
| D | 0 | 24526 | 2 |
| Quadrant | Total seconds | Saturated seconds | Saturation percentage |
|---|---|---|---|
| A | 4885 | 5 | 0.102354% |
| B | 4885 | 291 | 5.957011% |
| C | 4885 | 1164 | 23.828045% |
| D | 4885 | 1368 | 28.004094% |
Noise dominated data is calculated using 1-second bins in cleaned event files. If a bin has >2000 counts, and if more than 50% of those come from <1% of pixels, then it is considered to be noise-dominated and hence unusable.
| Quadrant | # 1 sec bins | Bins with >0 counts | Bins with >2000 counts | High rate bins dominated by noise | Noise dominated (total time) | Noise dominated (detector-on time) | Marked lightcurve |
|---|---|---|---|---|---|---|---|
| A | 7038 | 4886 | 0 | 0 | 0.00% | 0.00% | 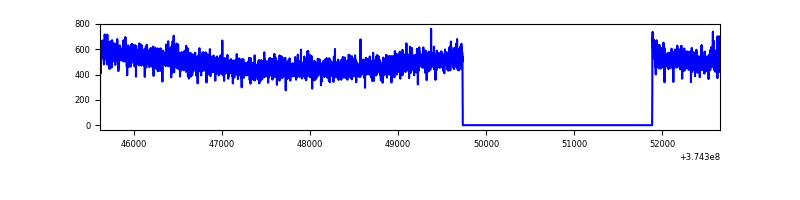 |
| B | 7038 | 4886 | 196 | 196 | 2.78% | 4.01% | 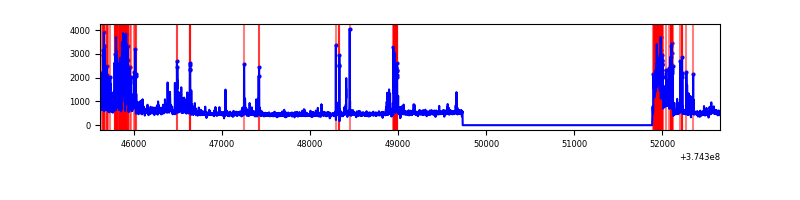 |
| C | 7038 | 4886 | 838 | 838 | 11.91% | 17.15% | 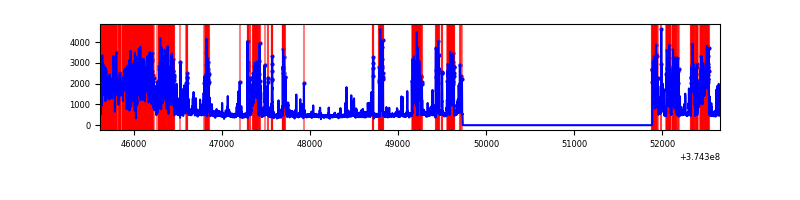 |
| D | 7038 | 4886 | 1348 | 1348 | 19.15% | 27.59% | 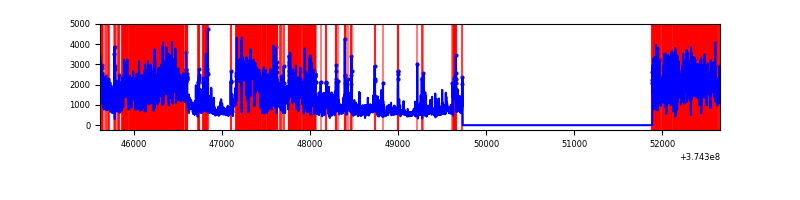 |
Top three noisy pixels from each quadrant. If the there are fewer than three noisy pixels in the level2.evt file, extra rows are filled as -1
| Pixel properties | Quadrant properties | ||||||
|---|---|---|---|---|---|---|---|
| Quadrant | DetID | PixID | Counts | Sigma | Mean | Median | Sigma |
| A | 15 | 47 | 27384 | 221.6 | 605 | 594 | 120.9 |
| A | 15 | 169 | 12829 | 101.21 | 605 | 594 | 120.9 |
| A | 13 | 254 | 9034 | 69.81 | 605 | 594 | 120.9 |
| B | 5 | 172 | 809046 | 7331.73 | 587 | 574 | 110.3 |
| B | 0 | 189 | 66149 | 594.68 | 587 | 574 | 110.3 |
| B | 5 | 200 | 46630 | 417.66 | 587 | 574 | 110.3 |
| C | 8 | 111 | 2631107 | 21487.77 | 534 | 540 | 122.4 |
| C | 7 | 221 | 281859 | 2297.95 | 534 | 540 | 122.4 |
| C | 0 | 10 | 171360 | 1395.34 | 534 | 540 | 122.4 |
| D | 7 | 223 | 2785780 | 20092.88 | 527 | 516 | 138.6 |
| D | 8 | 195 | 761754 | 5491.57 | 527 | 516 | 138.6 |
| D | 2 | 249 | 592993 | 4274.13 | 527 | 516 | 138.6 |
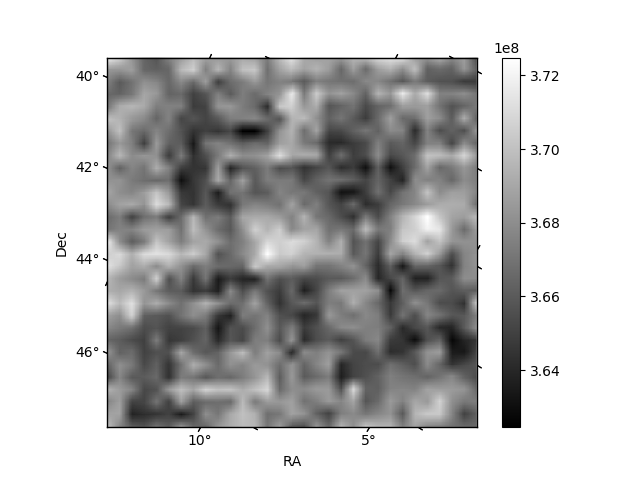
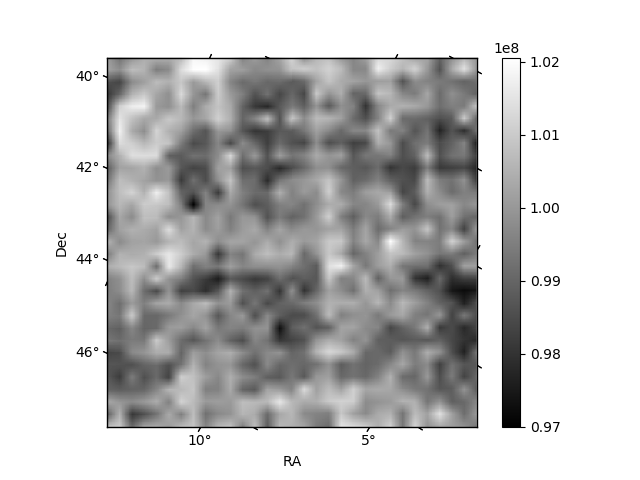
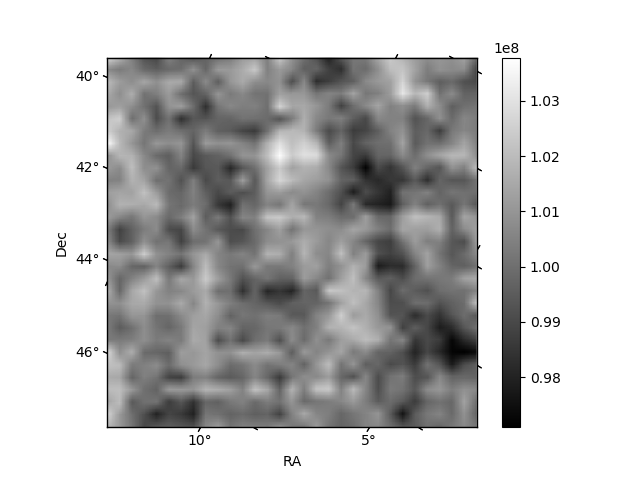
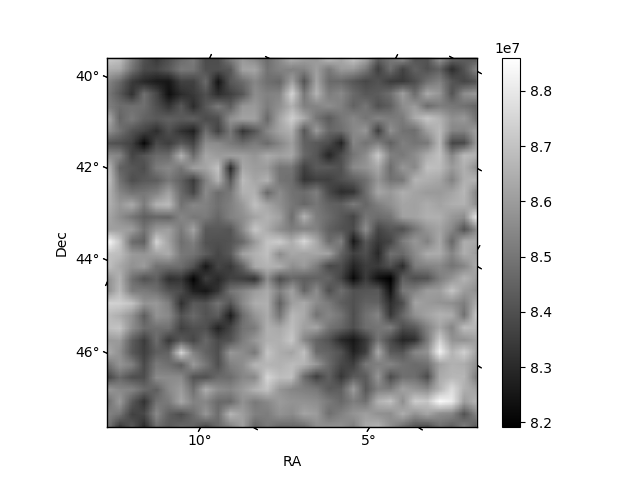
Histogram calculated using DETX and DETY for each event in the final _common_clean file
| Quadrant A | 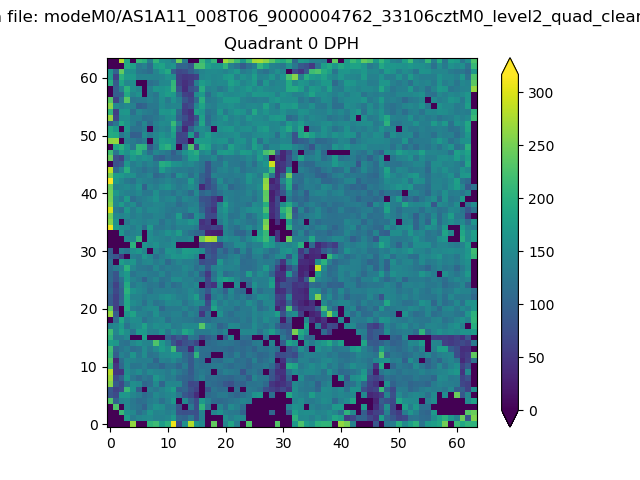 |
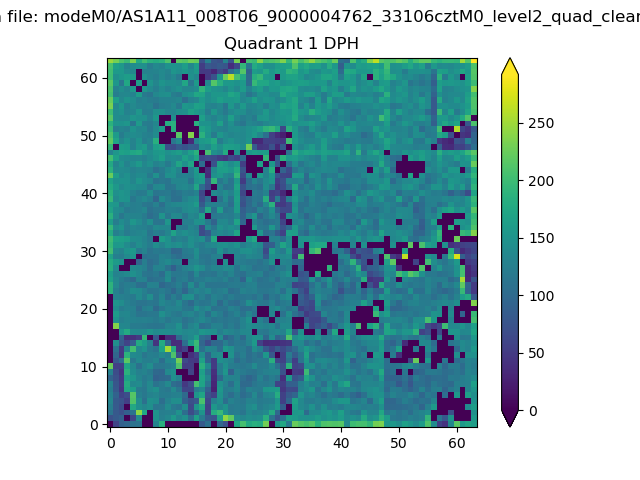 |
Quadrant B |
|---|---|---|---|
| Quadrant D |  |
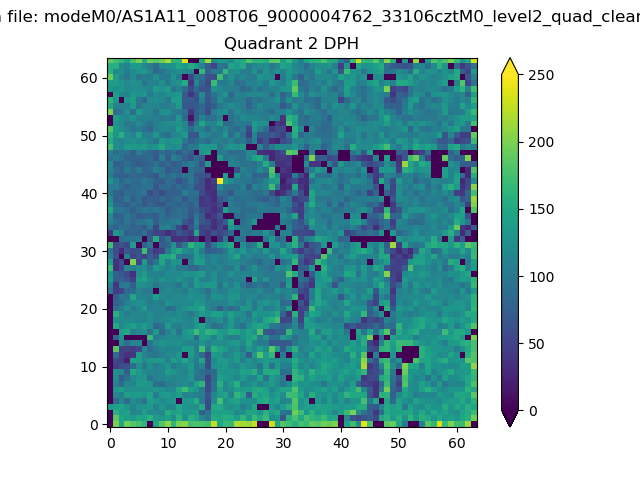 |
Quadrant C |
| Plot type | Count rate plots | Images |
|---|---|---|
| Comparison with Poisson distribution Blue bars denote a histogram of data divided into 1 sec bins. Red curve is a Poisson curve with rate = median count rate of data. |
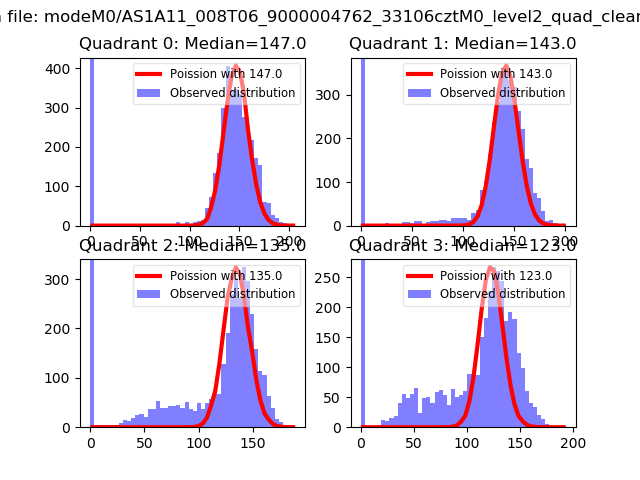 |
 |
| Quadrant-wise count rates Data is divided into 100 sec bins |
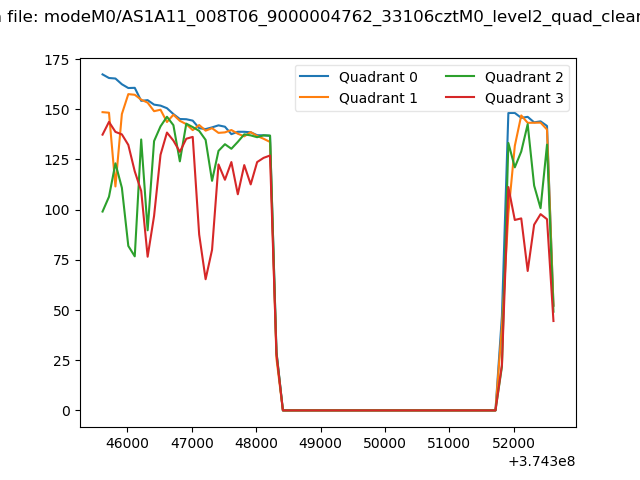 |
|
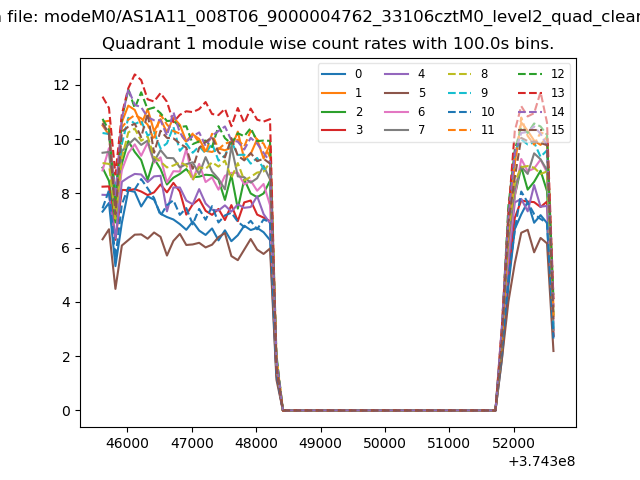
| Module-wise count rates for Quadrant A Data is divided into 100 sec bins |
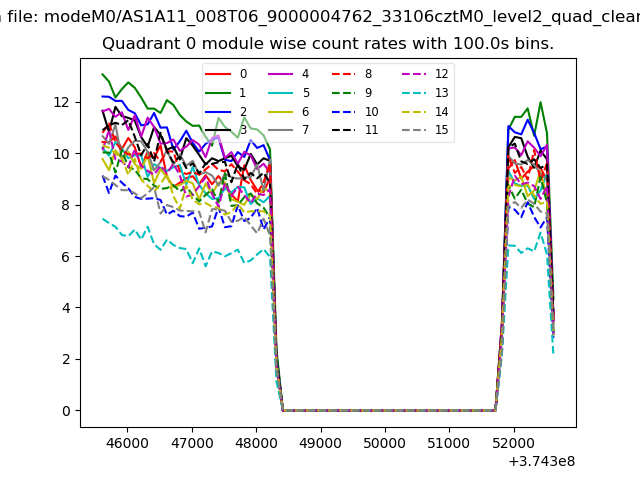 |
 |
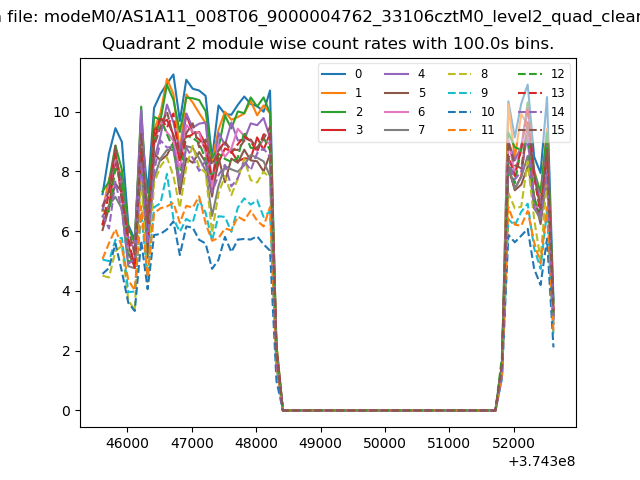
| Module-wise count rates for Quadrant B Data is divided into 100 sec bins |
 |
 |
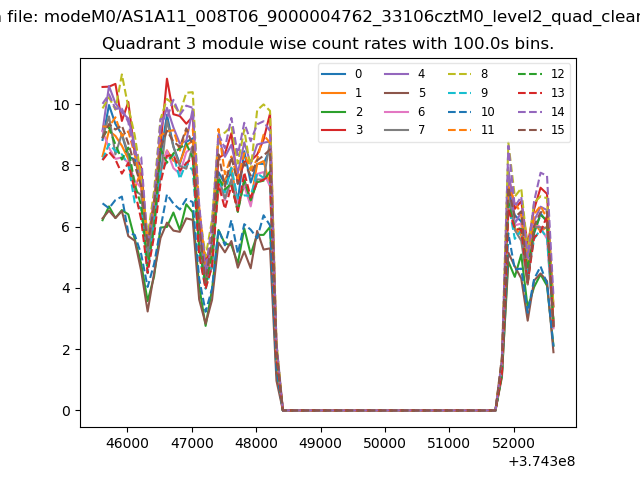
| Module-wise count rates for Quadrant C Data is divided into 100 sec bins |
 |
 |
| Module-wise count rates for Quadrant D Data is divided into 100 sec bins |
 |
 |
| Parameter | Plot |
|---|---|
| CZT HV Monitor | 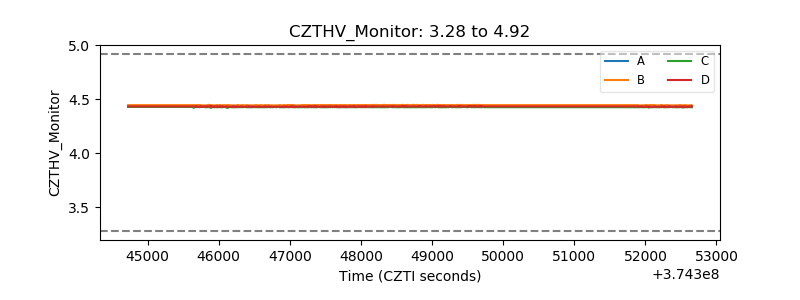 |
| D_VDD | 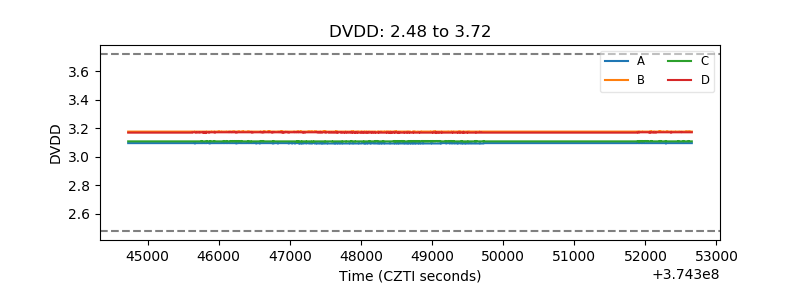 |
| Temperature 1 | 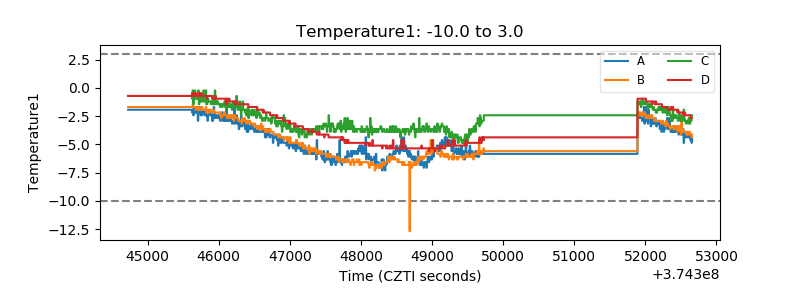 |
| Veto HV Monitor |  |
| Veto LLD | 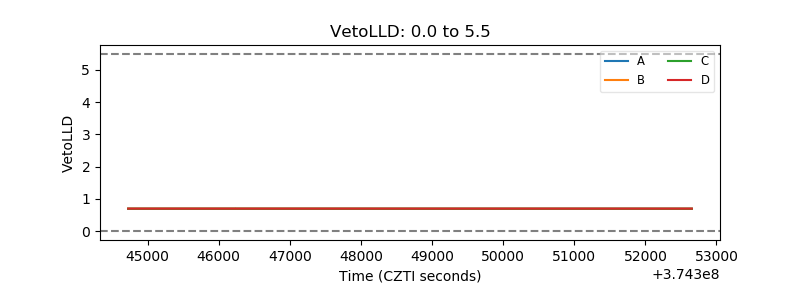 |
| Alpha Counter | 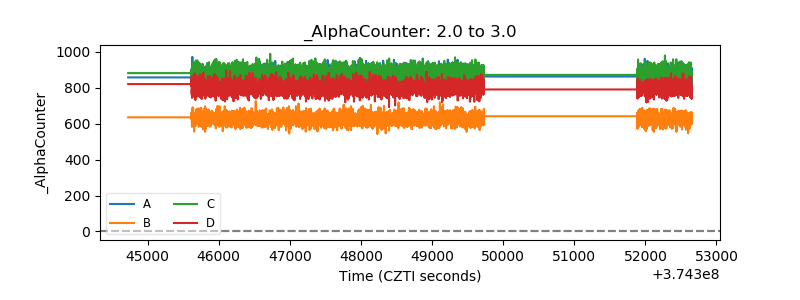 |
| _CPM_Rate | 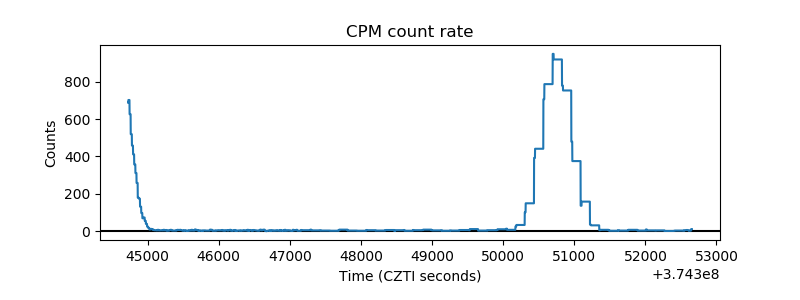 |
| CZT Counter |  |
| +2.5 Volts monitor |  |
| +5 Volts monitor |  |
| _ROLL_ROT | 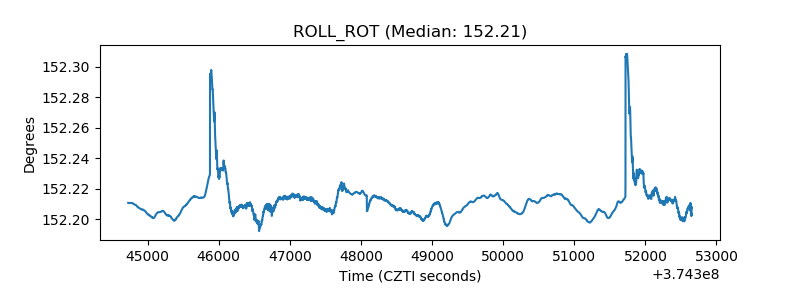 |
| _Roll_DEC | 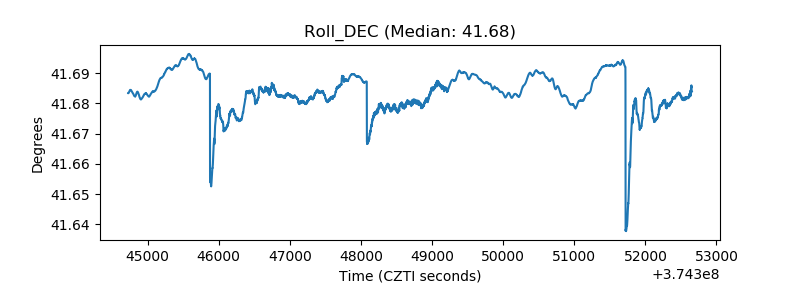 |
| _Roll_RA |  |
| Veto Counter | 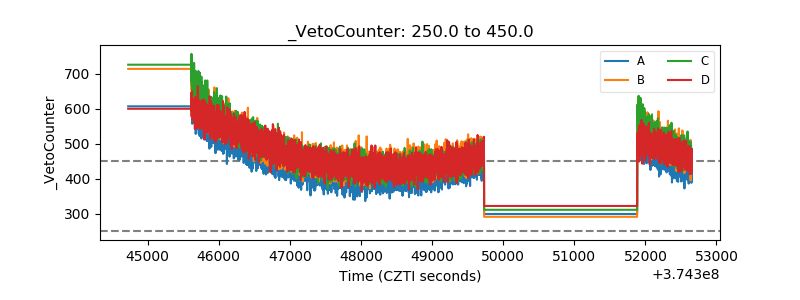 |