| Param | Original file | Final file |
|---|---|---|
| Filename | modeM0/AS1A11_008T06_9000004762_33107cztM0_level2.evt | modeM0/AS1A11_008T06_9000004762_33107cztM0_level2_quad_clean.evt |
| Size (bytes) | 662,552,640 | 61,459,200 |
| Size | 631.9 MB | 58.6 MB |
| Events in quadrant A | 2,496,299 | 427,503 |
| Events in quadrant B | 3,068,714 | 414,969 |
| Events in quadrant C | 4,207,184 | 393,465 |
| Events in quadrant D | 9,949,794 | 267,498 |
| Mode M9 | |||
|---|---|---|---|
| Quadrant | BADHDUFLAG | Total packets | Discarded packets |
| A | 0 | 28 | 0 |
| B | 0 | 28 | 0 |
| C | 0 | 28 | 0 |
| D | 0 | 29 | 0 |
| Mode SS | |||
|---|---|---|---|
| Quadrant | BADHDUFLAG | Total packets | Discarded packets |
| A | 0 | 102 | 0 |
| B | 0 | 102 | 0 |
| C | 0 | 102 | 0 |
| D | 0 | 102 | 0 |
| Mode M0 | |||
|---|---|---|---|
| Quadrant | BADHDUFLAG | Total packets | Discarded packets |
| A | 0 | 10554 | 3 |
| B | 0 | 12298 | 2 |
| C | 0 | 15871 | 2 |
| D | 0 | 33059 | 2 |
| Quadrant | Total seconds | Saturated seconds | Saturation percentage |
|---|---|---|---|
| A | 5085 | 19 | 0.373648% |
| B | 5085 | 195 | 3.834808% |
| C | 5085 | 521 | 10.245821% |
| D | 5085 | 2677 | 52.645034% |
Noise dominated data is calculated using 1-second bins in cleaned event files. If a bin has >2000 counts, and if more than 50% of those come from <1% of pixels, then it is considered to be noise-dominated and hence unusable.
| Quadrant | # 1 sec bins | Bins with >0 counts | Bins with >2000 counts | High rate bins dominated by noise | Noise dominated (total time) | Noise dominated (detector-on time) | Marked lightcurve |
|---|---|---|---|---|---|---|---|
| A | 7118 | 5086 | 11 | 11 | 0.15% | 0.22% | 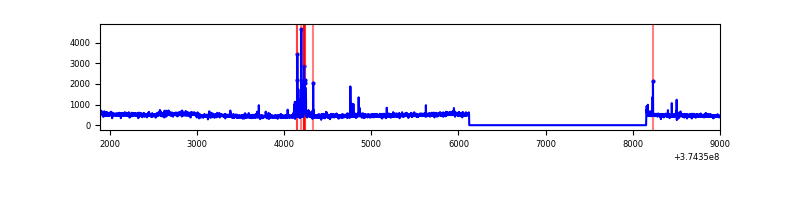 |
| B | 7118 | 5086 | 136 | 136 | 1.91% | 2.67% | 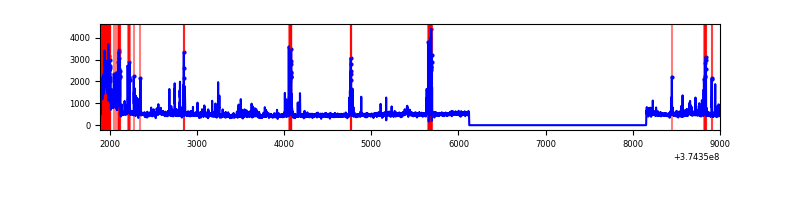 |
| C | 7118 | 5086 | 414 | 414 | 5.82% | 8.14% | 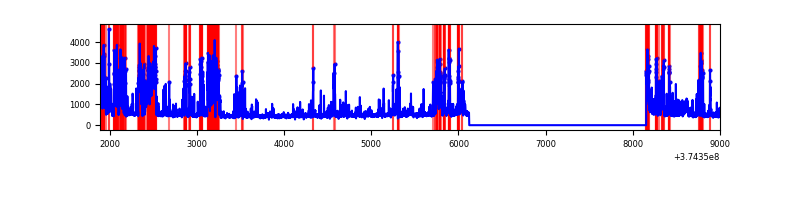 |
| D | 7118 | 5086 | 2524 | 2524 | 35.46% | 49.63% | 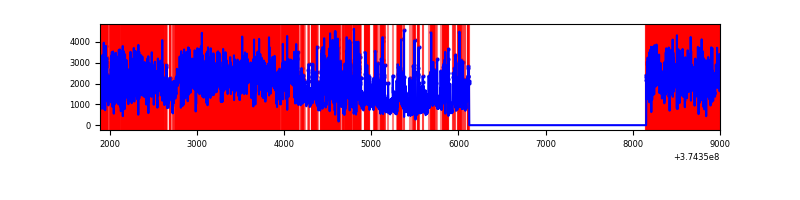 |
Top three noisy pixels from each quadrant. If the there are fewer than three noisy pixels in the level2.evt file, extra rows are filled as -1
| Pixel properties | Quadrant properties | ||||||
|---|---|---|---|---|---|---|---|
| Quadrant | DetID | PixID | Counts | Sigma | Mean | Median | Sigma |
| A | 15 | 169 | 146673 | 1212.11 | 599 | 588 | 120.5 |
| A | 15 | 47 | 20320 | 163.72 | 599 | 588 | 120.5 |
| A | 13 | 6 | 11566 | 91.09 | 599 | 588 | 120.5 |
| B | 5 | 172 | 541979 | 4793.52 | 591 | 577 | 112.9 |
| B | 0 | 189 | 58075 | 509.08 | 591 | 577 | 112.9 |
| B | 15 | 85 | 40966 | 357.6 | 591 | 577 | 112.9 |
| C | 8 | 111 | 1440686 | 11009.36 | 565 | 570 | 130.8 |
| C | 0 | 10 | 230781 | 1759.91 | 565 | 570 | 130.8 |
| C | 7 | 221 | 148635 | 1131.92 | 565 | 570 | 130.8 |
| D | 7 | 223 | 3261743 | 26908.32 | 462 | 453 | 121.2 |
| D | 2 | 250 | 1516251 | 12506.58 | 462 | 453 | 121.2 |
| D | 8 | 195 | 1116588 | 9209.03 | 462 | 453 | 121.2 |
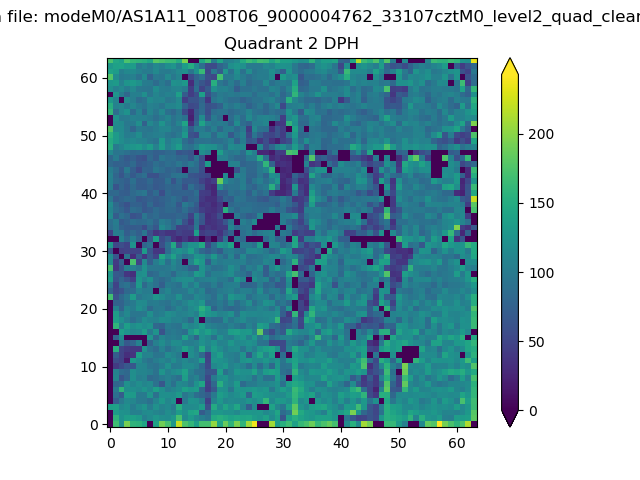
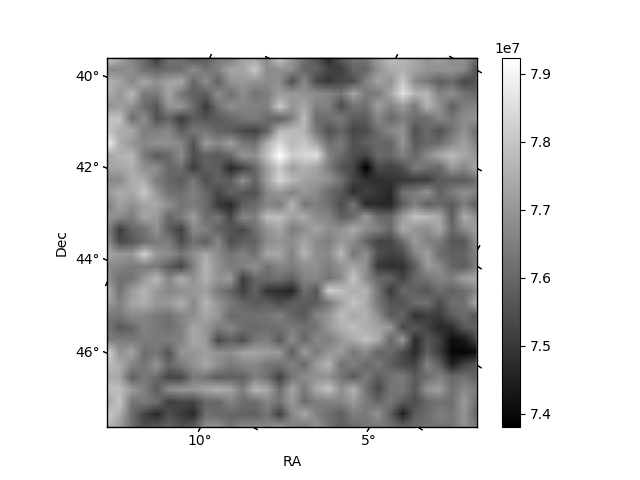
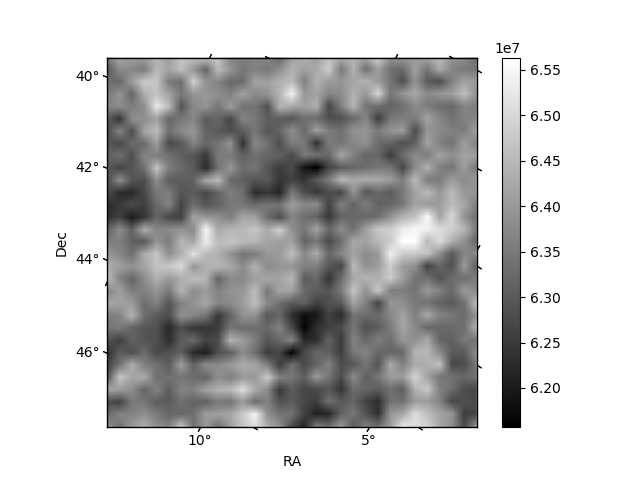
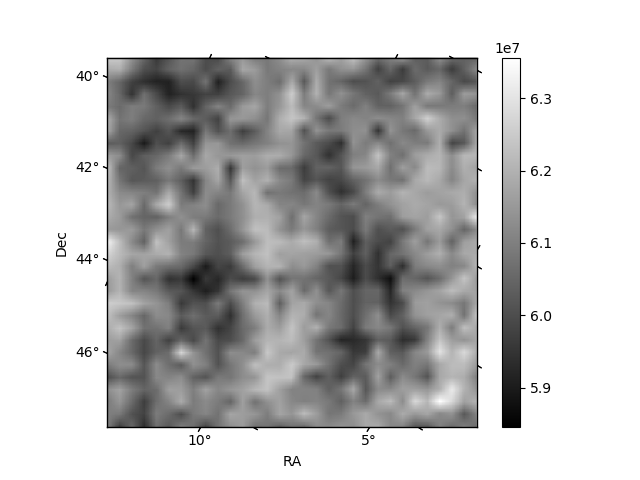
Histogram calculated using DETX and DETY for each event in the final _common_clean file
| Quadrant A | 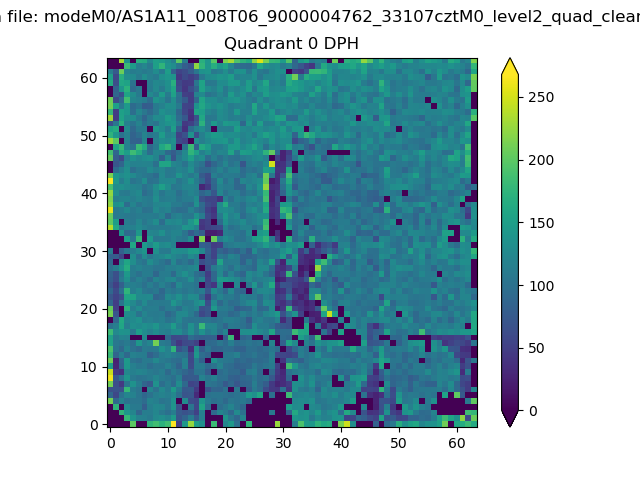 |
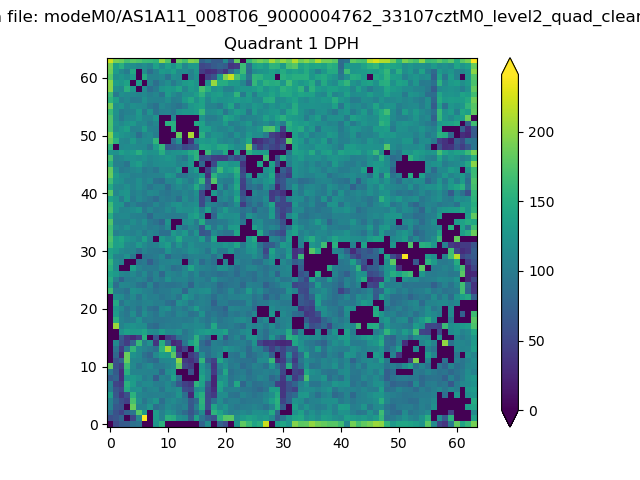 |
Quadrant B |
|---|---|---|---|
| Quadrant D | 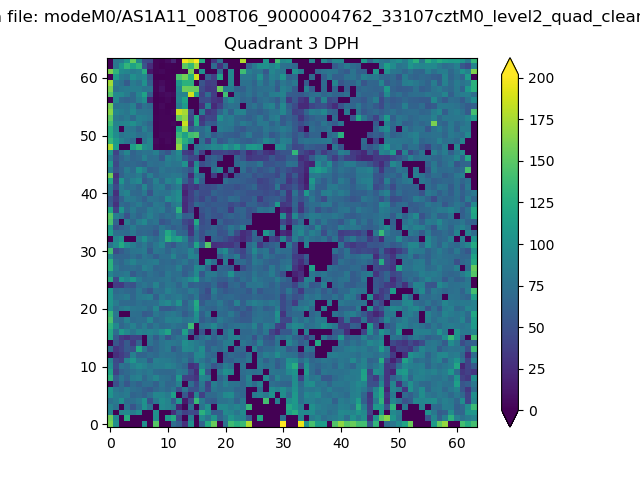 |
 |
Quadrant C |
| Plot type | Count rate plots | Images |
|---|---|---|
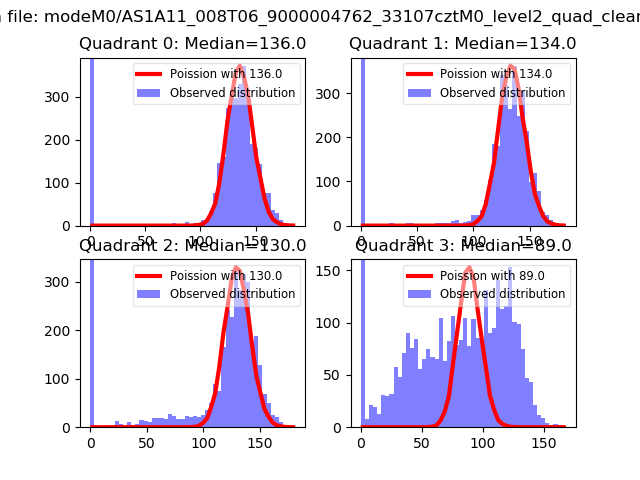
| Comparison with Poisson distribution Blue bars denote a histogram of data divided into 1 sec bins. Red curve is a Poisson curve with rate = median count rate of data. |
 |
 |
| Quadrant-wise count rates Data is divided into 100 sec bins |
 |
|
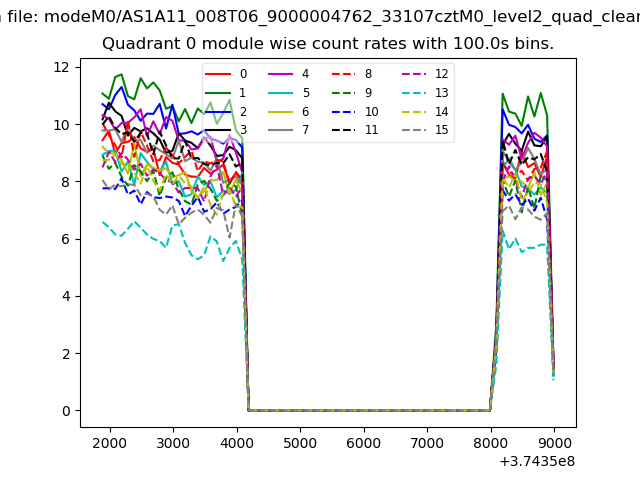
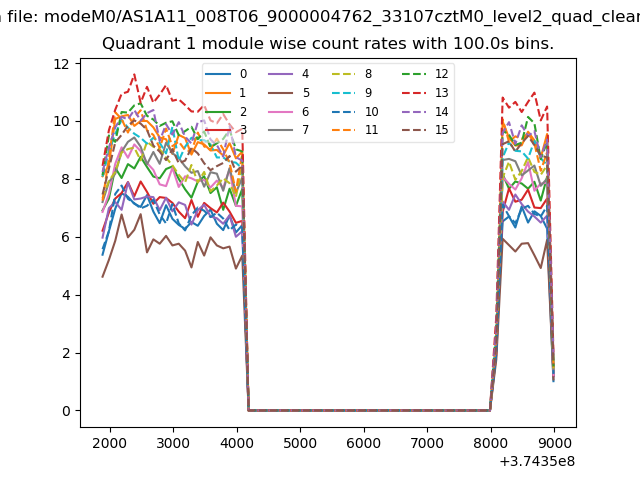
| Module-wise count rates for Quadrant A Data is divided into 100 sec bins |
 |
 |
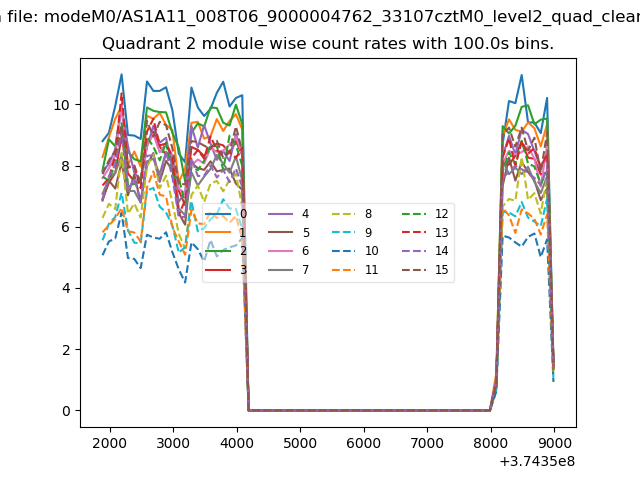
| Module-wise count rates for Quadrant B Data is divided into 100 sec bins |
 |
 |
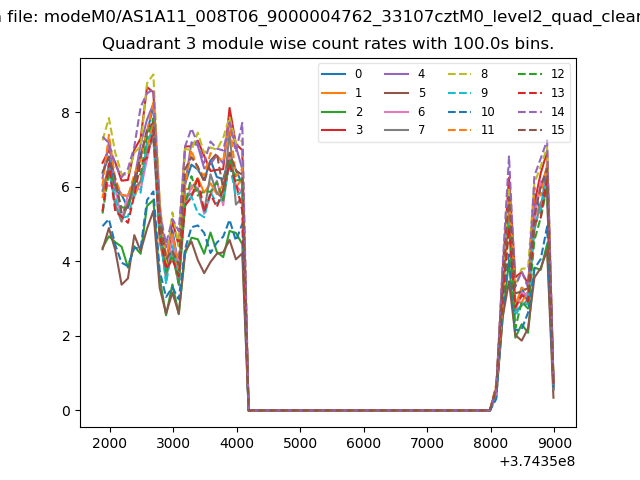
| Module-wise count rates for Quadrant C Data is divided into 100 sec bins |
 |
 |
| Module-wise count rates for Quadrant D Data is divided into 100 sec bins |
 |
 |
| Parameter | Plot |
|---|---|
| CZT HV Monitor |  |
| D_VDD |  |
| Temperature 1 | 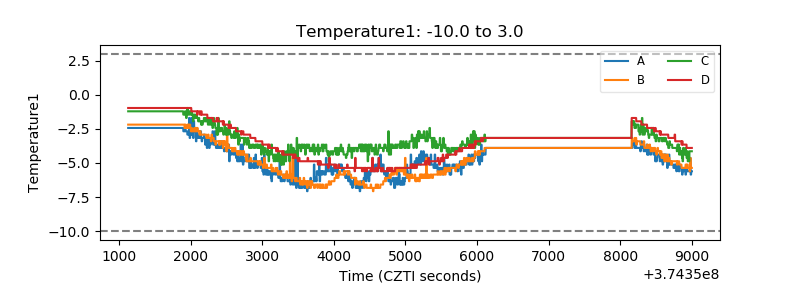 |
| Veto HV Monitor | 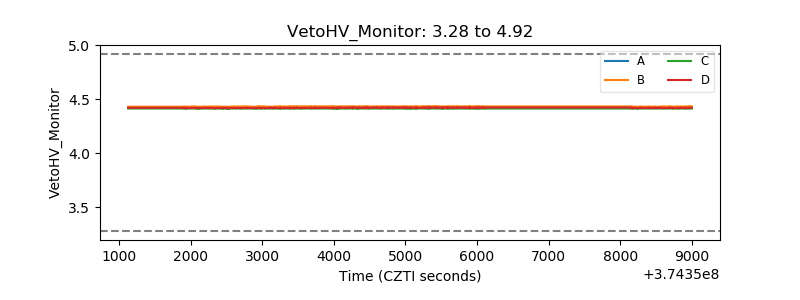 |
| Veto LLD | 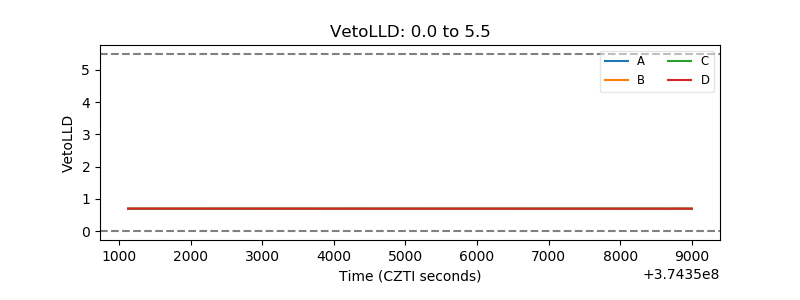 |
| Alpha Counter | 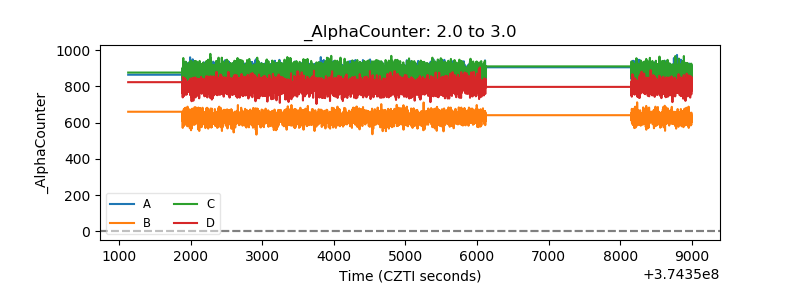 |
| _CPM_Rate | 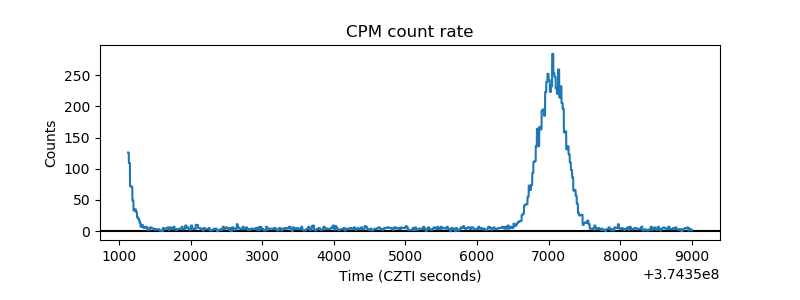 |
| CZT Counter |  |
| +2.5 Volts monitor |  |
| +5 Volts monitor |  |
| _ROLL_ROT | 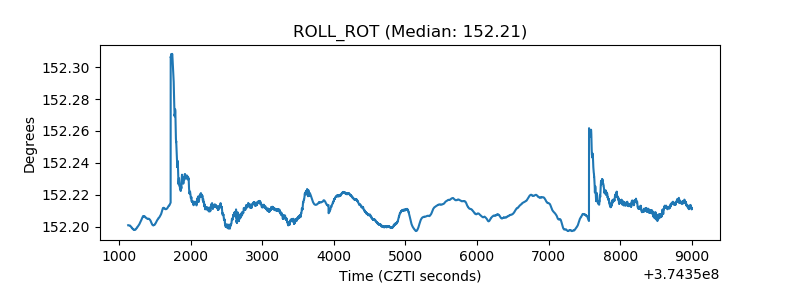 |
| _Roll_DEC | 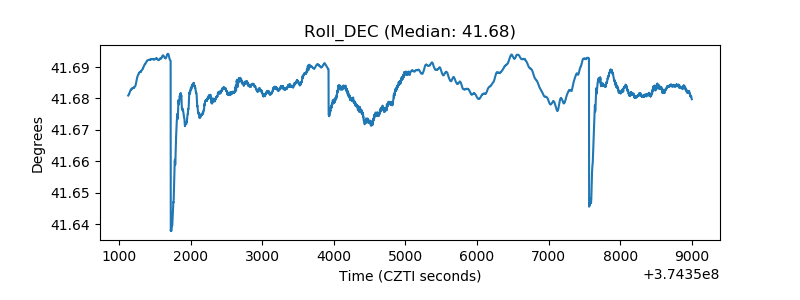 |
| _Roll_RA | 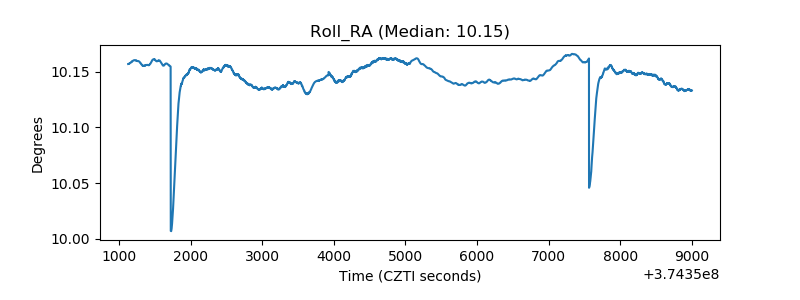 |
| Veto Counter | 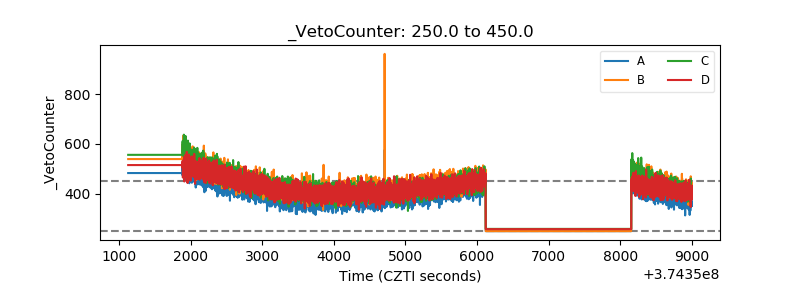 |