| Param | Original file | Final file |
|---|---|---|
| Filename | modeM0/AS1A11_008T06_9000004762_33110cztM0_level2.evt | modeM0/AS1A11_008T06_9000004762_33110cztM0_level2_quad_clean.evt |
| Size (bytes) | 776,387,520 | 64,082,880 |
| Size | 740.4 MB | 61.1 MB |
| Events in quadrant A | 2,672,439 | 439,103 |
| Events in quadrant B | 3,428,624 | 431,925 |
| Events in quadrant C | 3,493,995 | 427,235 |
| Events in quadrant D | 13,519,636 | 229,339 |
| Mode M9 | |||
|---|---|---|---|
| Quadrant | BADHDUFLAG | Total packets | Discarded packets |
| A | 0 | 23 | 0 |
| B | 0 | 23 | 0 |
| C | 0 | 23 | 0 |
| D | 0 | 24 | 0 |
| Mode SS | |||
|---|---|---|---|
| Quadrant | BADHDUFLAG | Total packets | Discarded packets |
| A | 0 | 120 | 0 |
| B | 0 | 120 | 0 |
| C | 0 | 120 | 0 |
| D | 0 | 120 | 0 |
| Mode M0 | |||
|---|---|---|---|
| Quadrant | BADHDUFLAG | Total packets | Discarded packets |
| A | 0 | 11921 | 3 |
| B | 0 | 14174 | 2 |
| C | 0 | 14224 | 2 |
| D | 0 | 44218 | 2 |
| Quadrant | Total seconds | Saturated seconds | Saturation percentage |
|---|---|---|---|
| A | 5884 | 10 | 0.169952% |
| B | 5884 | 160 | 2.719239% |
| C | 5884 | 116 | 1.971448% |
| D | 5884 | 4682 | 79.571720% |
Noise dominated data is calculated using 1-second bins in cleaned event files. If a bin has >2000 counts, and if more than 50% of those come from <1% of pixels, then it is considered to be noise-dominated and hence unusable.
| Quadrant | # 1 sec bins | Bins with >0 counts | Bins with >2000 counts | High rate bins dominated by noise | Noise dominated (total time) | Noise dominated (detector-on time) | Marked lightcurve |
|---|---|---|---|---|---|---|---|
| A | 7197 | 5885 | 1 | 1 | 0.01% | 0.02% | 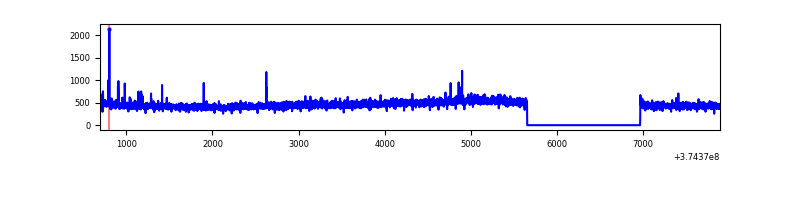 |
| B | 7197 | 5885 | 95 | 95 | 1.32% | 1.61% | 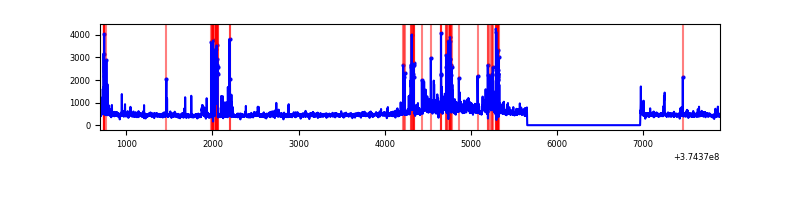 |
| C | 7197 | 5885 | 84 | 84 | 1.17% | 1.43% | 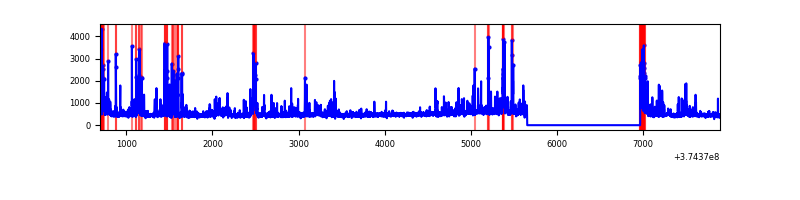 |
| D | 7197 | 5885 | 4592 | 4592 | 63.80% | 78.03% | 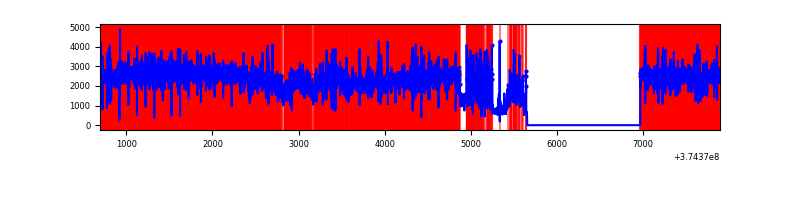 |
Top three noisy pixels from each quadrant. If the there are fewer than three noisy pixels in the level2.evt file, extra rows are filled as -1
| Pixel properties | Quadrant properties | ||||||
|---|---|---|---|---|---|---|---|
| Quadrant | DetID | PixID | Counts | Sigma | Mean | Median | Sigma |
| A | 13 | 254 | 11135 | 76.32 | 683 | 667 | 137.2 |
| A | 15 | 169 | 7584 | 50.43 | 683 | 667 | 137.2 |
| A | 3 | 137 | 6528 | 42.73 | 683 | 667 | 137.2 |
| B | 5 | 172 | 462745 | 3535.29 | 673 | 656 | 130.7 |
| B | 0 | 189 | 126708 | 964.38 | 673 | 656 | 130.7 |
| B | 0 | 219 | 67489 | 511.32 | 673 | 656 | 130.7 |
| C | 7 | 221 | 415464 | 2709.66 | 659 | 664 | 153.1 |
| C | 0 | 10 | 173075 | 1126.27 | 659 | 664 | 153.1 |
| C | 1 | 23 | 159570 | 1038.05 | 659 | 664 | 153.1 |
| D | 7 | 223 | 8665429 | 77606.92 | 462 | 452 | 111.7 |
| D | 8 | 195 | 826366 | 7397.21 | 462 | 452 | 111.7 |
| D | 2 | 249 | 752636 | 6736.85 | 462 | 452 | 111.7 |
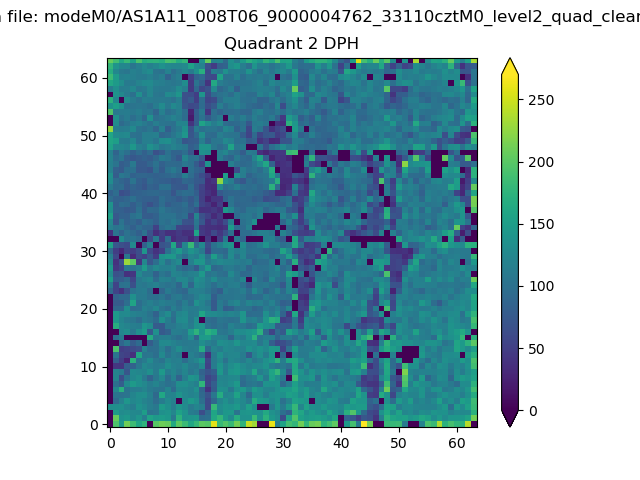
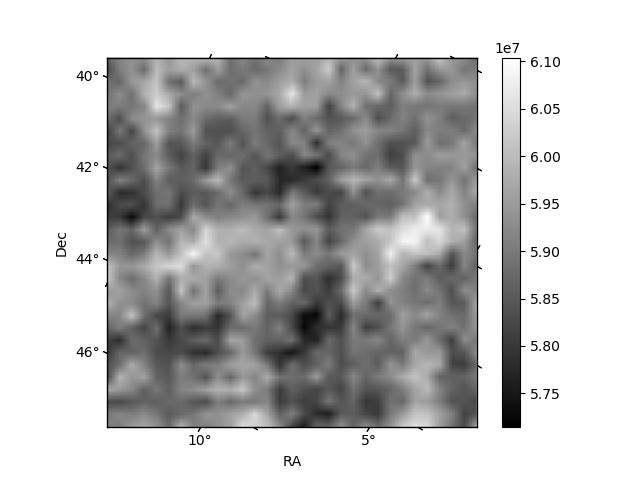
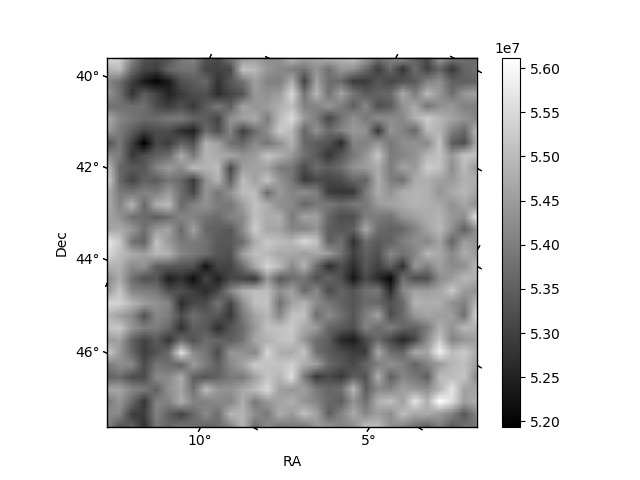
Histogram calculated using DETX and DETY for each event in the final _common_clean file
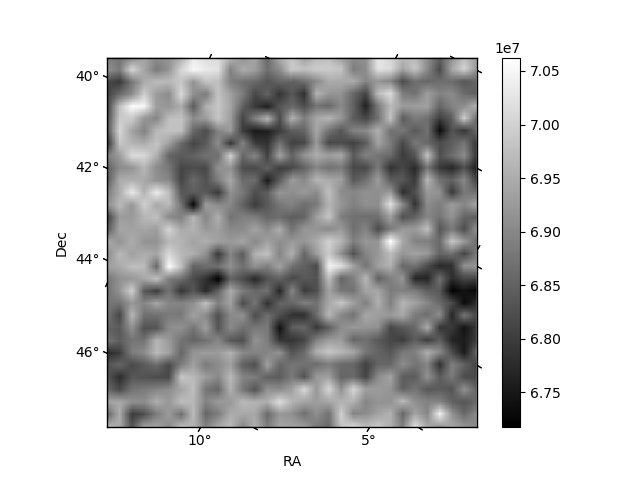
| Quadrant A |  |
 |
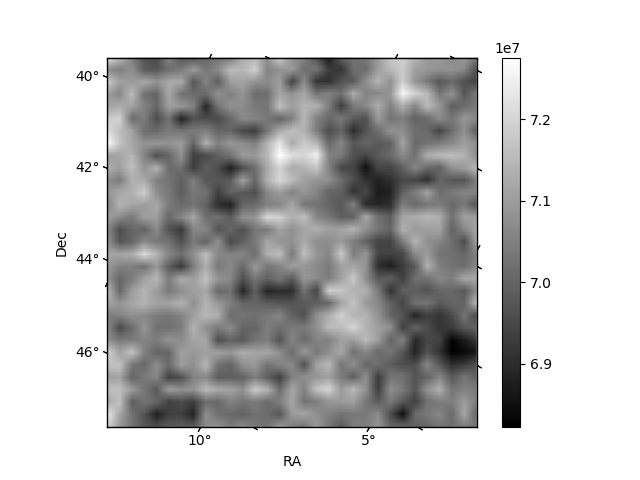
Quadrant B |
|---|---|---|---|
| Quadrant D |  |
 |
Quadrant C |
| Plot type | Count rate plots | Images |
|---|---|---|
| Comparison with Poisson distribution Blue bars denote a histogram of data divided into 1 sec bins. Red curve is a Poisson curve with rate = median count rate of data. |
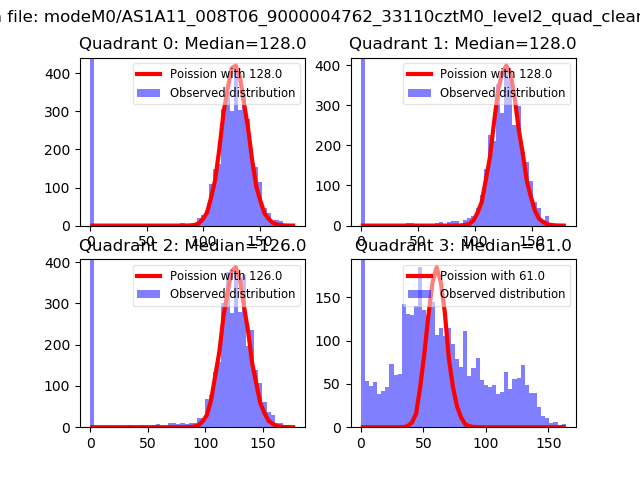 |
 |
| Quadrant-wise count rates Data is divided into 100 sec bins |
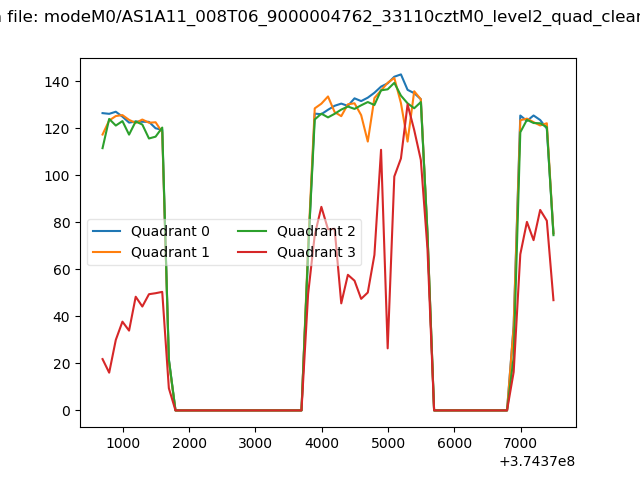 |
|
| Module-wise count rates for Quadrant A Data is divided into 100 sec bins |
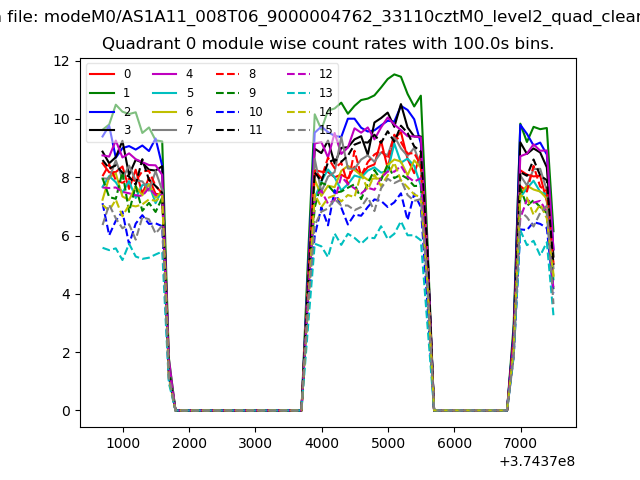 |
 |
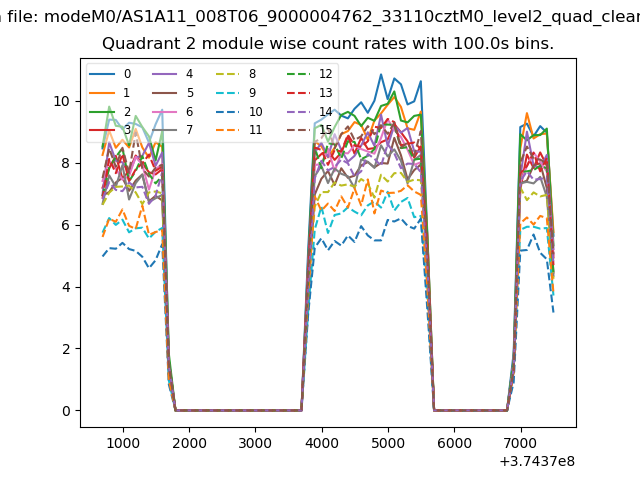
| Module-wise count rates for Quadrant B Data is divided into 100 sec bins |
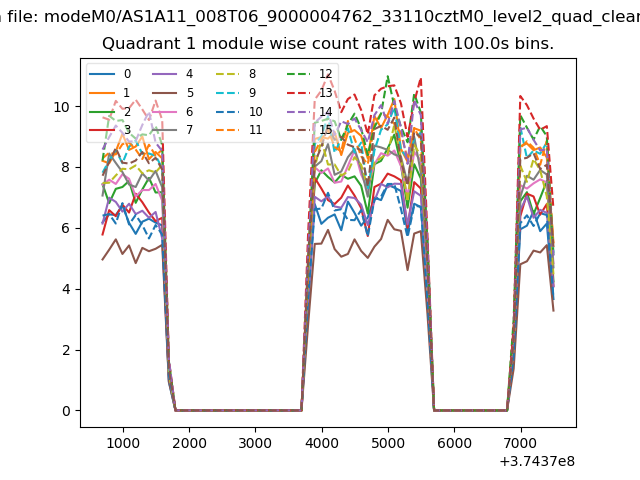 |
 |
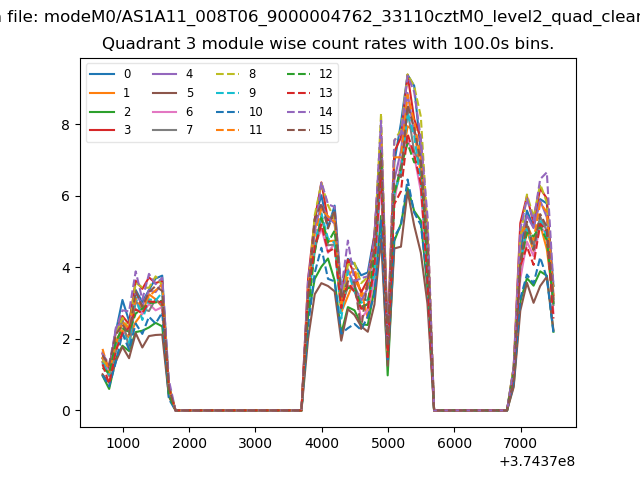
| Module-wise count rates for Quadrant C Data is divided into 100 sec bins |
 |
 |
| Module-wise count rates for Quadrant D Data is divided into 100 sec bins |
 |
 |
| Parameter | Plot |
|---|---|
| CZT HV Monitor |  |
| D_VDD | 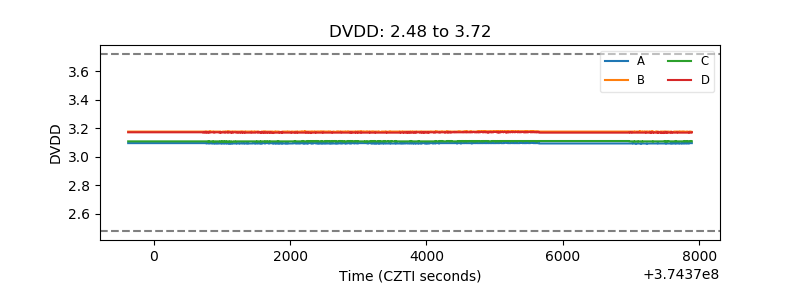 |
| Temperature 1 | 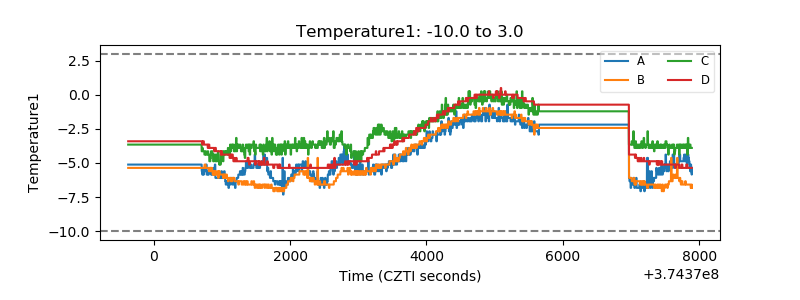 |
| Veto HV Monitor | 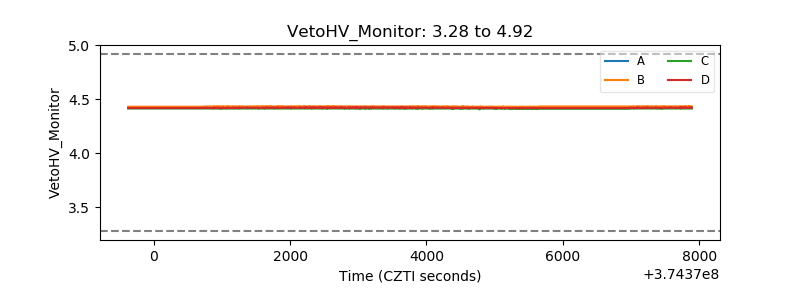 |
| Veto LLD | 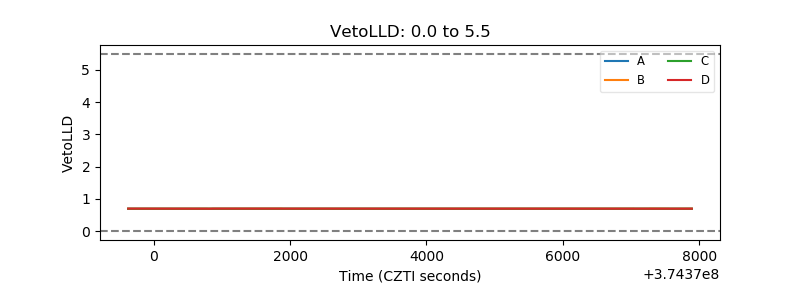 |
| Alpha Counter | 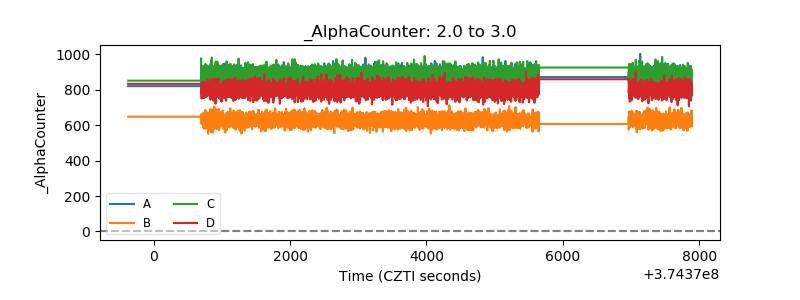 |
| _CPM_Rate | 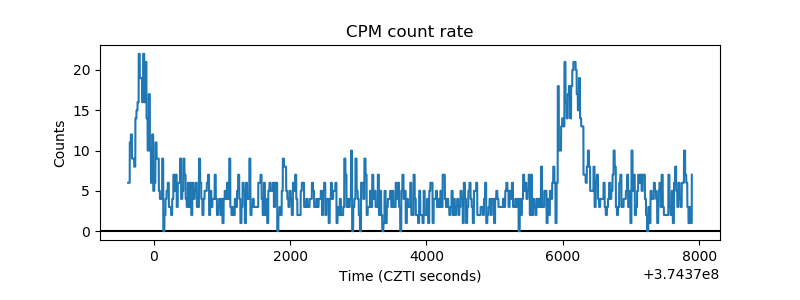 |
| CZT Counter | 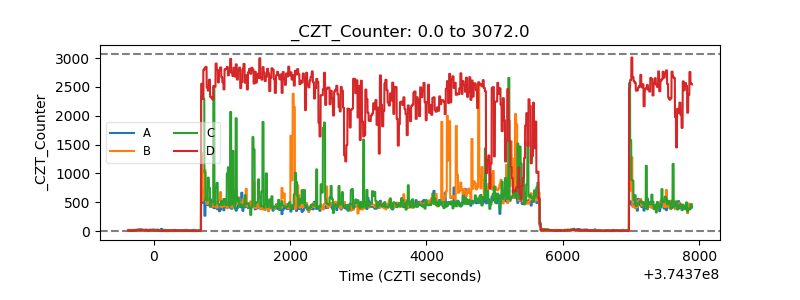 |
| +2.5 Volts monitor |  |
| +5 Volts monitor | 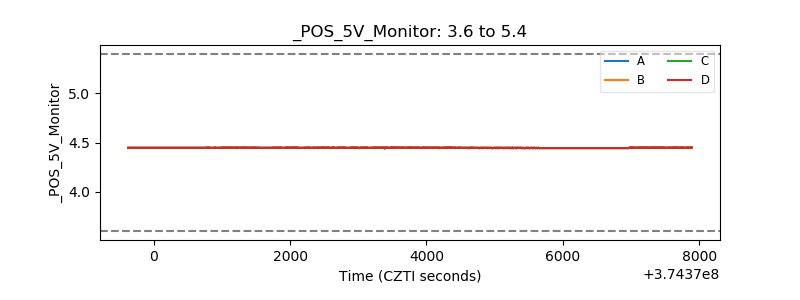 |
| _ROLL_ROT | 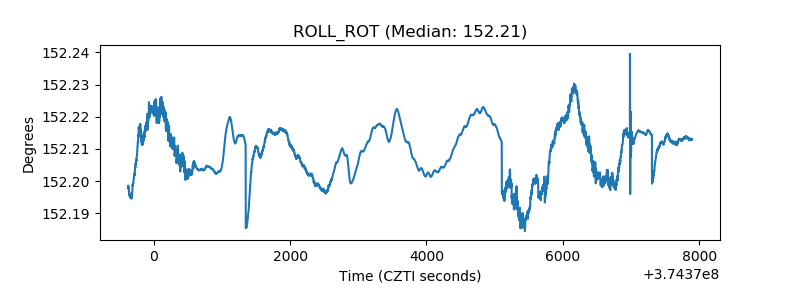 |
| _Roll_DEC | 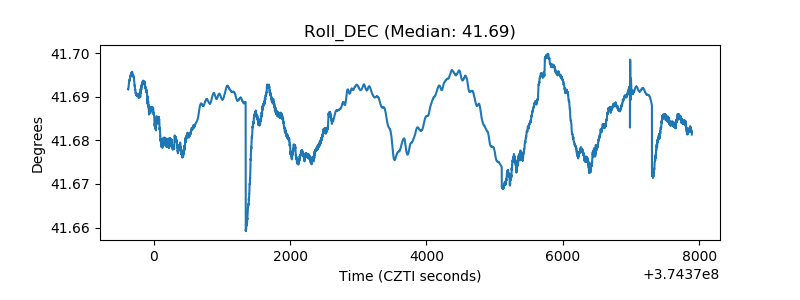 |
| _Roll_RA | 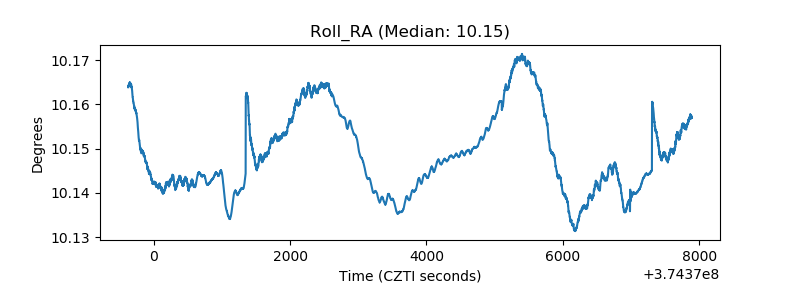 |
| Veto Counter | 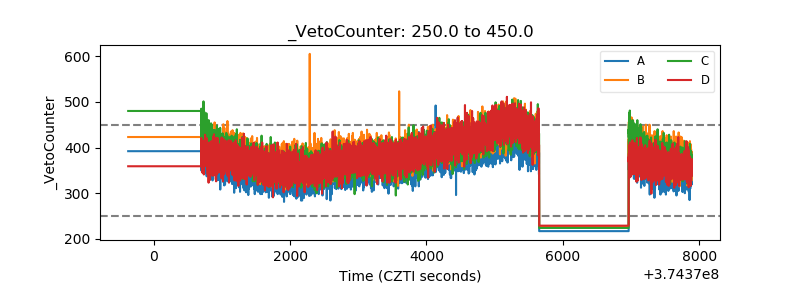 |