| Param | Original file | Final file |
|---|---|---|
| Filename | modeM0/AS1A11_008T06_9000004762_33113cztM0_level2.evt | modeM0/AS1A11_008T06_9000004762_33113cztM0_level2_quad_clean.evt |
| Size (bytes) | 1,702,264,320 | 173,309,760 |
| Size | 1.6 GB | 165.3 MB |
| Events in quadrant A | 6,828,134 | 1,128,925 |
| Events in quadrant B | 9,725,287 | 1,082,597 |
| Events in quadrant C | 8,822,268 | 1,104,592 |
| Events in quadrant D | 25,176,824 | 903,825 |
| Mode M9 | |||
|---|---|---|---|
| Quadrant | BADHDUFLAG | Total packets | Discarded packets |
| A | 0 | 53 | 0 |
| B | 0 | 52 | 0 |
| C | 0 | 52 | 0 |
| D | 0 | 52 | 0 |
| Mode SS | |||
|---|---|---|---|
| Quadrant | BADHDUFLAG | Total packets | Discarded packets |
| A | 0 | 304 | 0 |
| B | 0 | 304 | 0 |
| C | 0 | 304 | 0 |
| D | 0 | 304 | 0 |
| Mode M0 | |||
|---|---|---|---|
| Quadrant | BADHDUFLAG | Total packets | Discarded packets |
| A | 0 | 29966 | 3 |
| B | 0 | 38663 | 3 |
| C | 0 | 36026 | 3 |
| D | 0 | 85119 | 3 |
| Quadrant | Total seconds | Saturated seconds | Saturation percentage |
|---|---|---|---|
| A | 14888 | 19 | 0.127620% |
| B | 14888 | 801 | 5.380172% |
| C | 14888 | 260 | 1.746373% |
| D | 14888 | 5994 | 40.260613% |
Noise dominated data is calculated using 1-second bins in cleaned event files. If a bin has >2000 counts, and if more than 50% of those come from <1% of pixels, then it is considered to be noise-dominated and hence unusable.
| Quadrant | # 1 sec bins | Bins with >0 counts | Bins with >2000 counts | High rate bins dominated by noise | Noise dominated (total time) | Noise dominated (detector-on time) | Marked lightcurve |
|---|---|---|---|---|---|---|---|
| A | 18917 | 14891 | 1 | 1 | 0.01% | 0.01% | 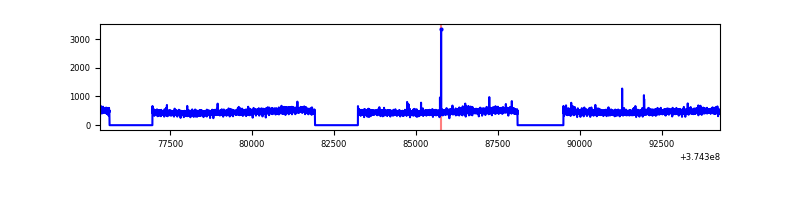 |
| B | 18917 | 14891 | 494 | 494 | 2.61% | 3.32% | 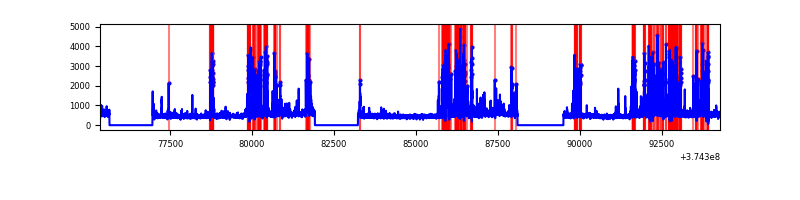 |
| C | 18917 | 14891 | 178 | 178 | 0.94% | 1.20% | 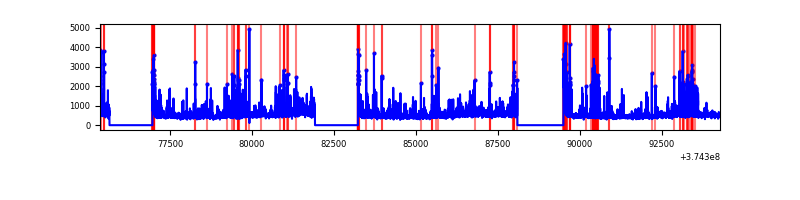 |
| D | 18917 | 14891 | 6284 | 6284 | 33.22% | 42.20% | 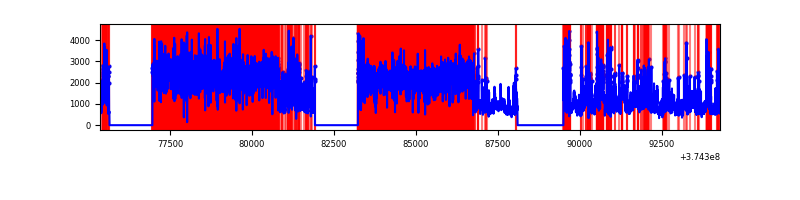 |
Top three noisy pixels from each quadrant. If the there are fewer than three noisy pixels in the level2.evt file, extra rows are filled as -1
| Pixel properties | Quadrant properties | ||||||
|---|---|---|---|---|---|---|---|
| Quadrant | DetID | PixID | Counts | Sigma | Mean | Median | Sigma |
| A | 13 | 254 | 27327 | 73.51 | 1755 | 1718 | 348.4 |
| A | 13 | 6 | 22290 | 59.05 | 1755 | 1718 | 348.4 |
| A | 3 | 137 | 16723 | 43.07 | 1755 | 1718 | 348.4 |
| B | 5 | 172 | 2138328 | 6476.81 | 1710 | 1663 | 329.9 |
| B | 5 | 200 | 234104 | 704.59 | 1710 | 1663 | 329.9 |
| B | 0 | 189 | 194210 | 583.66 | 1710 | 1663 | 329.9 |
| C | 7 | 221 | 1019333 | 2591.41 | 1695 | 1709 | 392.7 |
| C | 0 | 10 | 487206 | 1236.33 | 1695 | 1709 | 392.7 |
| C | 8 | 111 | 302423 | 765.78 | 1695 | 1709 | 392.7 |
| D | 7 | 223 | 13391498 | 37132.03 | 1510 | 1476 | 360.6 |
| D | 8 | 195 | 2355141 | 6526.98 | 1510 | 1476 | 360.6 |
| D | 2 | 249 | 862479 | 2387.66 | 1510 | 1476 | 360.6 |
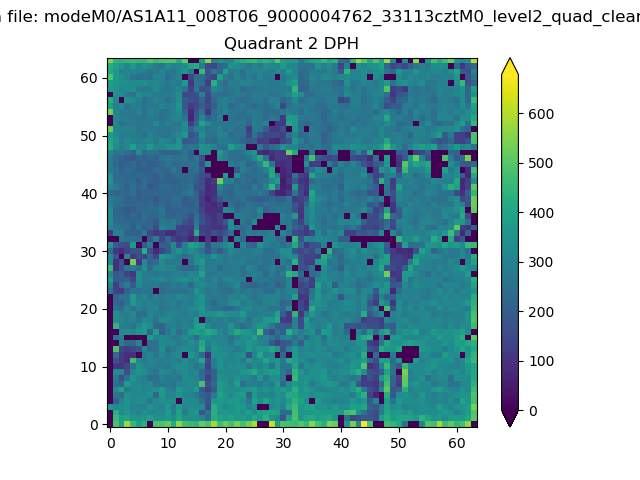
Histogram calculated using DETX and DETY for each event in the final _common_clean file
| Quadrant A | 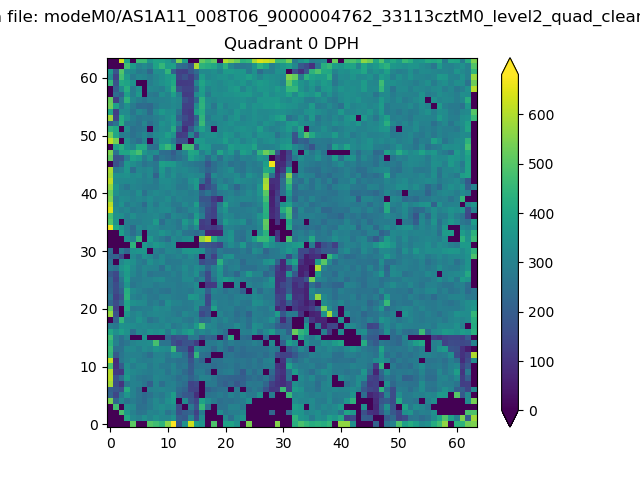 |
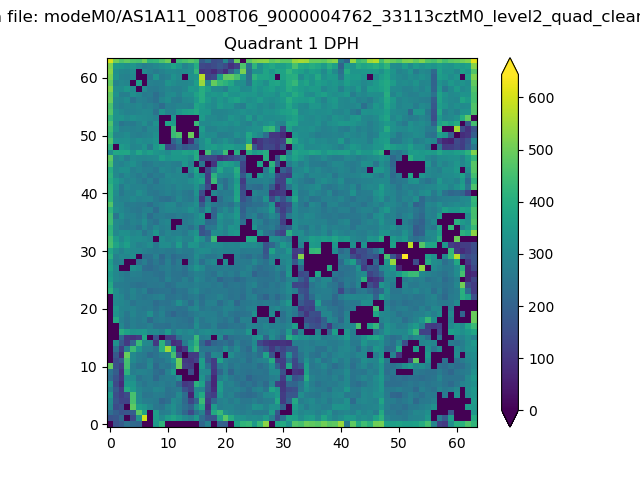 |
Quadrant B |
|---|---|---|---|
| Quadrant D | 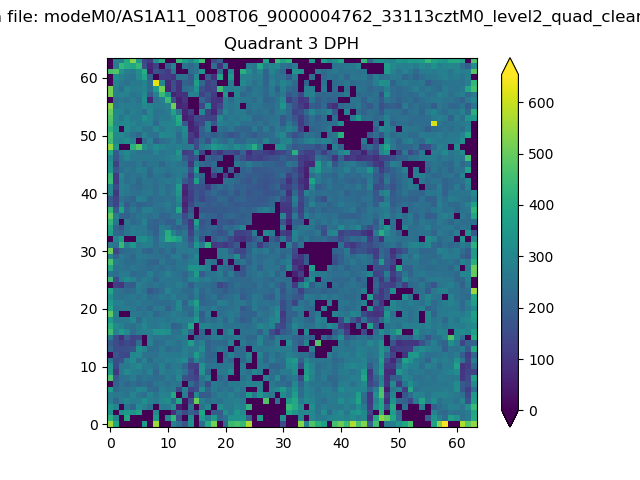 |
 |
Quadrant C |
| Plot type | Count rate plots | Images |
|---|---|---|
| Comparison with Poisson distribution Blue bars denote a histogram of data divided into 1 sec bins. Red curve is a Poisson curve with rate = median count rate of data. |
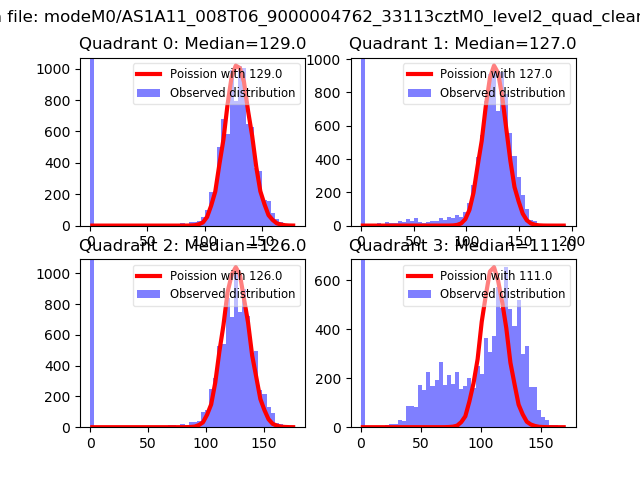 |
 |
| Quadrant-wise count rates Data is divided into 100 sec bins |
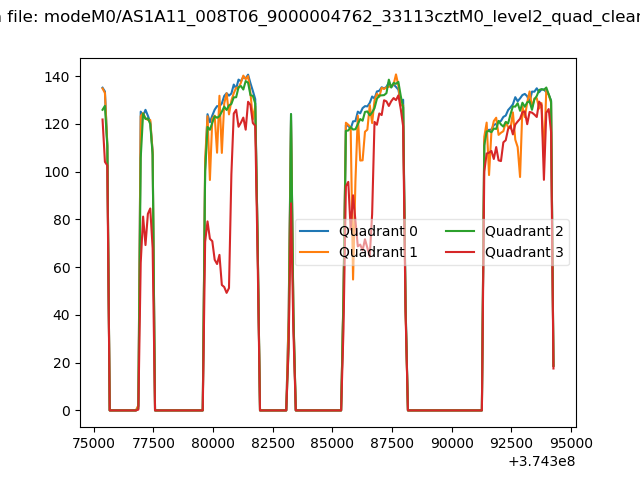 |
|
| Module-wise count rates for Quadrant A Data is divided into 100 sec bins |
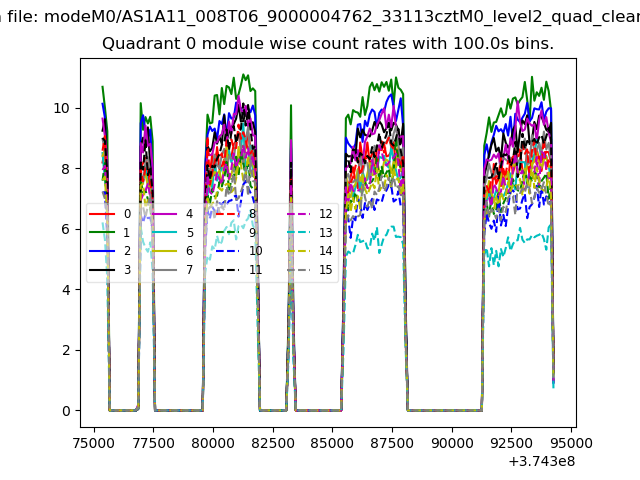 |
 |
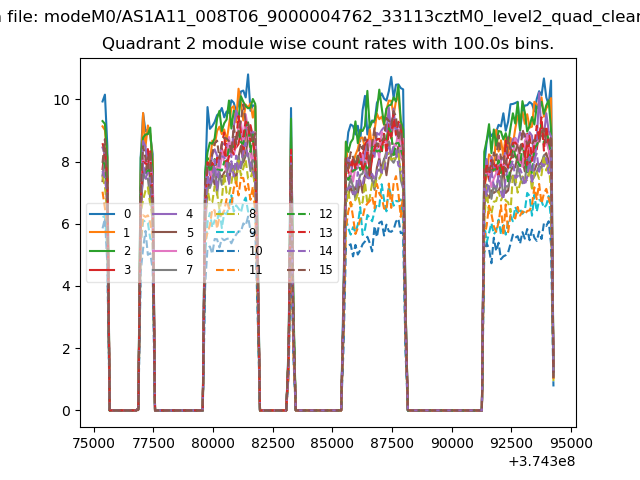
| Module-wise count rates for Quadrant B Data is divided into 100 sec bins |
 |
 |
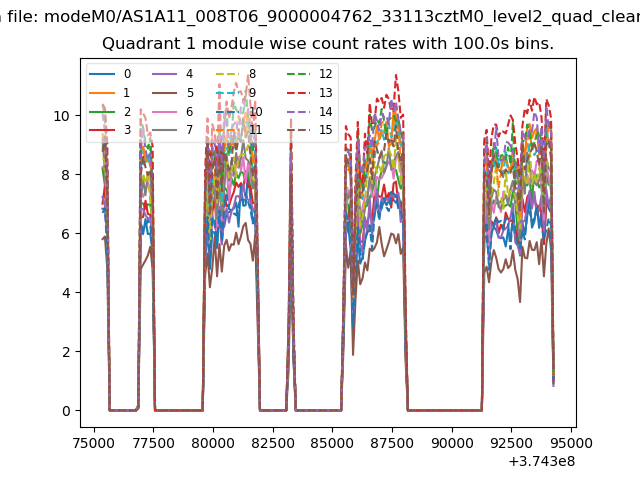
| Module-wise count rates for Quadrant C Data is divided into 100 sec bins |
 |
 |
| Module-wise count rates for Quadrant D Data is divided into 100 sec bins |
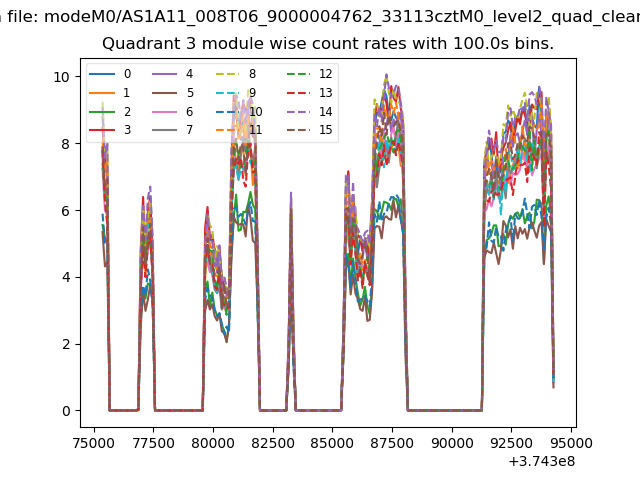 |
 |
| Parameter | Plot |
|---|---|
| CZT HV Monitor | 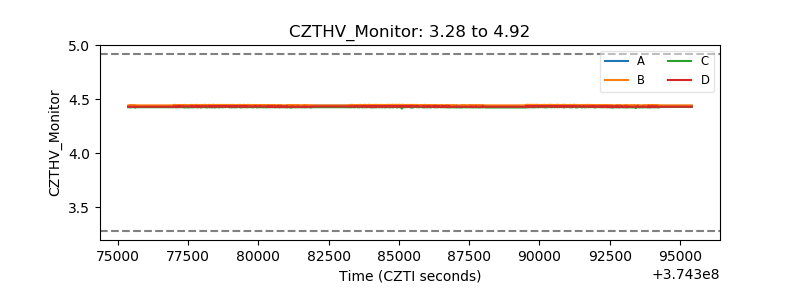 |
| D_VDD | 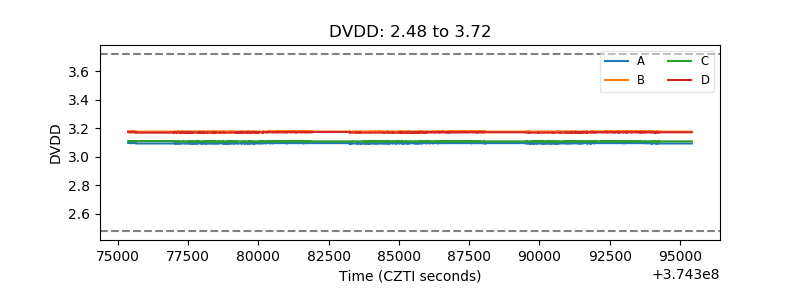 |
| Temperature 1 | 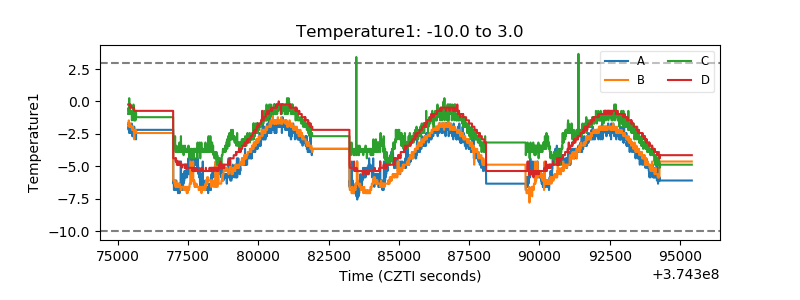 |
| Veto HV Monitor | 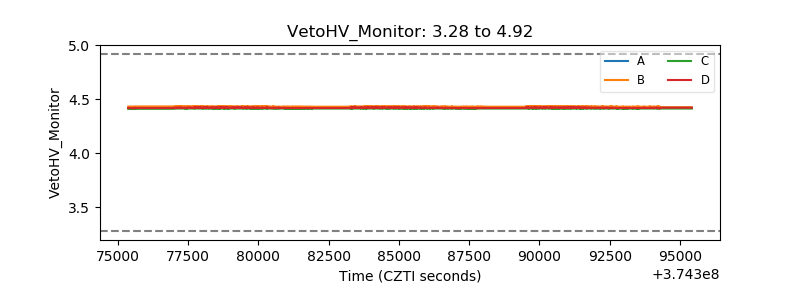 |
| Veto LLD | 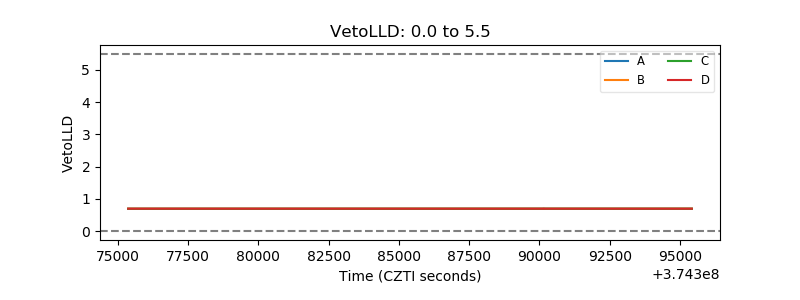 |
| Alpha Counter | 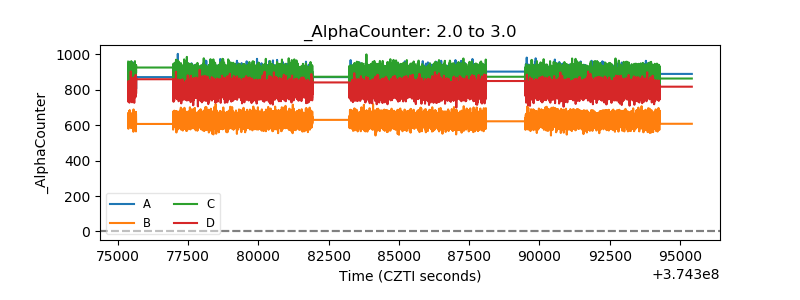 |
| _CPM_Rate | 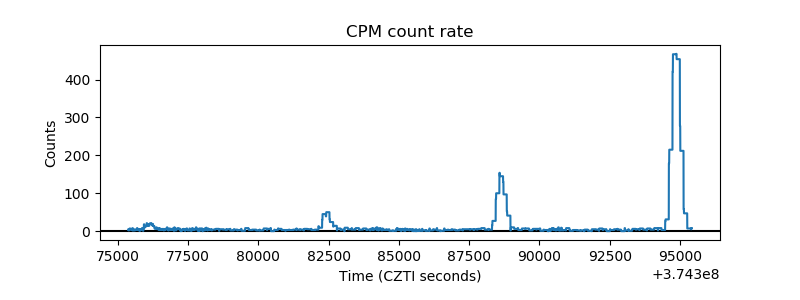 |
| CZT Counter |  |
| +2.5 Volts monitor |  |
| +5 Volts monitor |  |
| _ROLL_ROT | 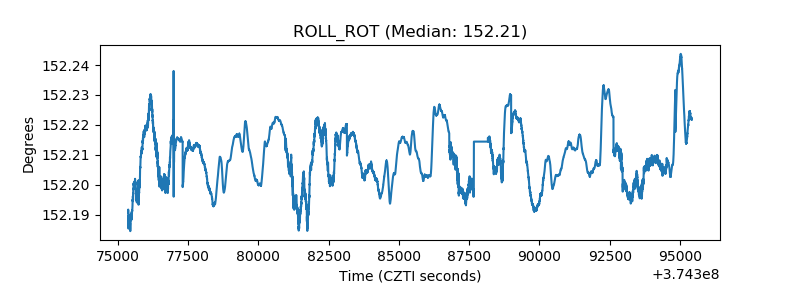 |
| _Roll_DEC |  |
| _Roll_RA | 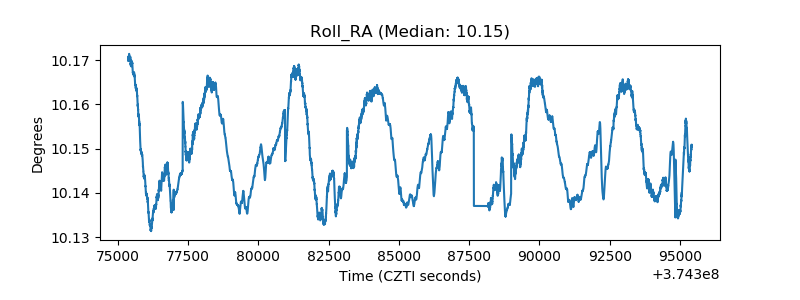 |
| Veto Counter | 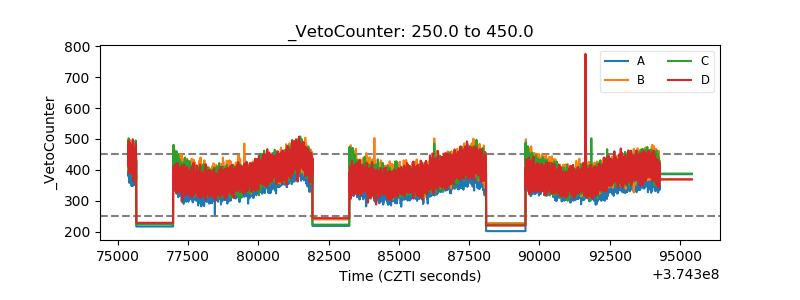 |